
BELOIT, WI / ACCESSWIRE / January 27, 2021 / Blackhawk Bancorp, Inc. (OTCQX:BHWB) reported net income of $3.3 million for the fourth quarter of 2020, a 17% increase over the $2.9 million earned the previous quarter, and a 42% increase compared to the $2.4 million earned the fourth quarter of 2019. Fully diluted earnings per share (EPS) for the quarter ended December 31, 2020, was $1.00, an increase of $0.14 as compared to $0.86 for the quarter ended September 30, 2020 and an increase of $0.29 as compared to $0.71 earned for the quarter ended December 31, 2019. The fourth quarter 2020 results produced an annualized Return on Average Equity (ROAE) of 12.08% and Return on Average Assets (ROAA) of 1.20%.
The earnings increase compared to the most recent quarter was driven by a $0.9 million decrease in provision for loan losses and a $0.4 million increase in securities gains. These were offset by a $0.5 million decrease in net interest income.
The increase in net income for the fourth quarter of 2020 compared to the fourth quarter of 2019 reflects increases of $0.9 million, $2.3 million and $0.4 million in net interest income, net revenue from the sale and servicing of mortgage loans, and securities gains, respectively. The growth in revenue was partially offset by increases in provision for loan losses of $0.7 million and operating expenses of $0.8 million.
For the year ended December 31, 2020, the Company reported record earnings with net income of $10.8 million, an increase of 13% over the previous record of $9.6 million reported for 2019. EPS for 2020 increased by 12% to $3.25 compared to $2.90 for 2019. The Company's results for the year ended December 31, 2020 produced a ROAE of 10.35% and a ROAA of 1.02%.
"I'm extremely proud of what our team accomplished this past year", said Todd James, the Company's Chief Executive Officer. "Blackhawk achieved record earnings, despite having to take a much different path to those results than originally planned", he added. "In response to the unprecedented events of 2020, our bankers focused their efforts on assisting our customers and prospects and helping them deal with the financial implications of the economic shutdown that was brought on by the pandemic. This included originating over $80 million in Paycheck Protection Program (PPP) loans, providing payment relief on another $72 million of loans, and helping over 1,900 homeowners lock in $295 million of mortgage loans at historical low rates", said James.
Total assets of the Company increased by $177.7 million, or 18%, to $1.1 billion at December 31, 2020, compared to $963.9 million as of December 31, 2019. Total gross loans increased by $44.4 million, or 7%, and total investment securities increased $114.6 million, or 48%, during the year of 2020. Total Deposits increased by $157.6 million, or 19%, to $987.3 million compared to $829.6 million at the end of 2019.
Net Interest Income
Net interest income for the fourth quarter of 2020 totaled $9.4 million, a decrease of $0.5 million, or 5%, compared to the third quarter of 2020, and up $0.9 million, or 10%, compared to the fourth quarter of 2019. The net interest margin was 3.63% for the fourth quarter of 2020 as compared to 3.83% for both the quarter ended September 30, 2020, and the fourth quarter of 2019.
The increase in net interest income compared to the fourth quarter of 2019 was the result of growth in average total earning assets, which increased by $148.6 million, or 17%. The increase was driven by the PPP, other pandemic stimulus and an overall influx of deposits as we saw a flight to safety. While the increase in average earning assets boosted net interest income, the net interest margin realized on many of the assets added was lean. Total average deposits increased by $126.1 million, or 15%, for the fourth quarter of 2020 compared to the fourth quarter of 2019. With average total loans increasing by $35.9 million, or 6%, for the same comparative quarters, much of the growth in deposits was deployed in the investment portfolio or held in interest-bearing bank accounts. The average balance of investment securities increased by $103.1 million, or 44%, for the fourth quarter of 2020 compared to the fourth quarter of 2019. With these securities being added during a time of historically low interest rates, the yield on investments dropped by 79 basis points to 2.47% for the fourth quarter of 2020 compared to 3.26% for the fourth quarter of 2019. The average balance of PPP loans for the fourth quarter of 2020 was $73.6 million. Including the $0.5 million in PPP origination fees recognized in the fourth quarter, the yield on PPP Loans was 3.82%.
Net interest income for the year ended December 31, 2020 increased by $4.2 million, or 12%, to $37.8 million as compared to $33.7 million for 2019. The net interest margin for 2020 decreased by six basis points to 3.82% compared to 3.88% for 2019.
The increase in net interest income for 2020, compared to the prior year, was the result of a $123.8 million, or 14%, increase in average total earning assets to $1.0 billion. Average total loans for the twelve months of 2020 were $675.5 million, an increase of $65.0 million, or 11%, as compared to $610.5 million for 2019. Average total loans for 2020 included $54.9 million of PPP loans. Average total deposits for 2020 were $915.2 million, an increase of $101.5 million, or 12%, as compared to $813.7 million for 2019. With deposit growth outpacing loan growth, average total investments for 2020 increased by $49.9 million, or 20%, to $294.0 million compared to $244 million for 2019. The Federal Reserve's aggressive rate cuts to address the economic fallout from the pandemic led to a 48 basis-point decrease in the yield on average earning assets as compared to 2019. Being funded primarily by a stable, core deposit base, the Company was able to act swiftly in adjusting deposit rates, achieving a 47 basis-point decrease in the cost of deposits and a 51 basis-point drop in cost of funds, limiting the decrease in the net interest margin to six basis points compared to the prior year.
Provision for Loan Losses and Asset Quality
The provision for loan losses for the quarter ended December 31, 2020, totaled $1.7 million, as compared to $2.6 million for the quarter ended September 30, 2020, and $1.0 million for the fourth quarter of 2019. The provision for loan losses for the year ended December 31, 2020 increased $5.6 million to $7.6 million compared to $2.0 million for 2019. The increased provision was made to replenish the allowance for loan losses for charge-offs taken in 2020, and to accommodate an increase in qualitative factors due to uncertainty and potential losses related COVID-19. Net charge-offs for the year equaled $4.8 million, with $3.8 million of that amount being related to one relationship.
Total nonperforming assets, which include troubled debt restructures that are performing in accordance with their modified terms, equaled $9.1 million as of December 31, 2020, as compared to $11.0 million as of September 30, 2020, and $13.6 million at December 31, 2019. At December 31, 2020, the ratio of nonperforming assets to total assets equaled 0.79%, as compared to 0.97% at September 30, 2020, and 1.41% at December 31, 2019. The allowance for loan losses to total loans was 1.59% as of December 31, 2020, as compared to 1.44% at September 30, 2020, and 1.25% as of December 31, 2019. The allowance for loan losses to total loans, excluding PPP loans, at December 31, 2020 is 1.74% compared to 1.64% at September 30, 2020. The ratio of the allowance for loan losses to nonperforming loans increased to 118.7% as of December 31, 2020, as compared to 90.8% at September 30, 2020, and 58.8% at December 31, 2019.
While overall delinquency rates and non-performing asset levels have improved, management believes that current economic conditions present a heightened level of uncertainty that could result in elevated losses in future quarters. Many borrowers have taken advantage of PPP, other stimulus programs, and payment deferral loan modifications provided by the Bank. Blackhawk will continue being proactive with borrowers to ensure credit issues are identified and addressed as early as possible, and will grant borrower concessions that improve the overall probability of repayment.
Blackhawk implemented a program to provide payment relief to borrowers negatively affected by the COVID-19 pandemic, including payment deferrals, interest only payments, and forbearance agreements offering other relief. Many of these customers have returned to normal payments, however some are still under the original or extended modification agreements. The table below summarizes the status of loans that have been modified under the program. The portfolio balances in the tables exclude loans originated under PPP, which are 100% guaranteed by the SBA:
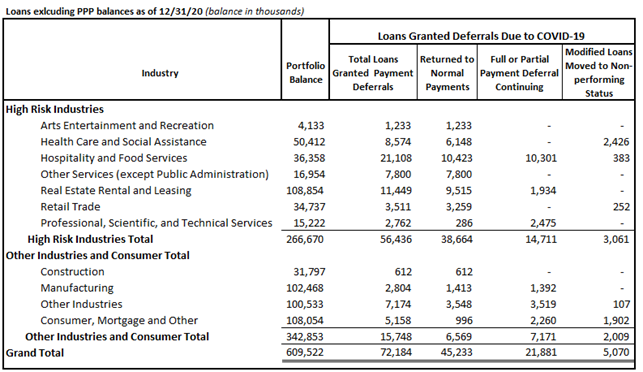
Of the total $72.2 million of loans that were modified to grant payment relief, $45.2 million have returned to normal payments. Of the remaining $27 million, $5.1 million has been transferred to non-accrual status and $21.9 million are still categorized as performing loans. The decision to move a credit to non-accrual or non-performing status is based upon management's assessment of likelihood the borrower will ultimately be able to make all principal and interest payments post-COVID.
Non-Interest Income and Operating Expenses
Non-interest income for the quarter ended December 31, 2020, totaled $6.0 million, a $0.3 million increase compared to $5.7 million the prior quarter, and a $2.1 million increase over the $3.9 million recorded in the fourth quarter of 2019. The increase compared to the third quarter of 2020 was due to $0.4 million of securities gains recognized in the fourth quarter and none the previous quarter. This was partially offset by a $0.2 million decrease in net loan servicing income reflecting an increase in the valuation allowance on the originated mortgage servicing rights asset. The increase in non-interest income compared to the fourth quarter of 2019 includes a $2.3 million increase in net revenue from the sale and servicing of mortgage loans. The increase also includes $0.4 million of securities gains for the fourth quarter of 2020 with none realized in the fourth quarter of the prior year. These increases were offset by a $0.2 million decrease in service charges on deposits and a $0.3 million decrease in other non-interest income.
Non-interest income for the full year 2020 increased $4.7 million, or 31%, to $19.8 million as compared to $15.1 million for 2019, including a $6.1 million increase in revenue from the sale and servicing of mortgage loans. This increase was offset by $0.7 million decrease in deposit service charges and a $0.6 million decrease in gain on sale of securities.
Operating expenses for the quarter ended December 31, 2020, totaled $9.3 million, unchanged compared to the quarter ended September 30, 2020, and increasing by $0.8 million, or 10%, compared to the fourth quarter of 2019. The increase compared to the fourth quarter of 2019 was due to a $0.9 million increase in compensation, which includes elevated variable compensation related to increased mortgage loan originations.
Operating expenses for the full year 2020 increased $1.5 million, or 4%, to $36.2 million as compared to $34.6 million the year before. The 2019 results included $2 million of nonrecurring acquisition related expenses. Excluding the acquisition related expenses for 2019, operating expenses would have increased by $3.5 million, or 11%, over the previous year. This increase reflects operating the three acquired locations for the full year, versus only ten months in 2019, and the increased variable expenses related to mortgage banking activity.
Share Repurchase Program
At its meeting on October 21, 2020, the Company's Board of Directors authorized a share repurchase program, under which the Company may repurchase up to 200,000 shares of its outstanding common stock. As of December 31, 2020, the Company has repurchased 6,400 shares under the program. The extent to which the Company repurchases its shares, and the timing of such repurchases, will depend upon a variety of factors including market conditions, capital requirements, and other corporate considerations as determined by the Company's management team. The repurchase program may be suspended or discontinued at any time. The Company expects to finance the purchases with existing cash balances.
Outlook
The outlook for Blackhawk as well as the entire banking industry is clouded by uncertainty related to the COVID-19 pandemic crisis. Blackhawk believes there is risk of elevated credit losses in future quarters as the economic impact of the crisis plays out. In addition, a prolonged low interest rate environment has the potential to negatively affect net interest income and the net interest margin. The Company will continue taking steps to increase revenue, implement government stimulus programs and work with credit customers to offset and mitigate losses to the extent possible. Management believes the Company's financial position is strong and it has ample resources to withstand a potentially severe and protracted recession. In addition to responding to this crisis, Blackhawk will continue to pursue creditworthy and profitable business and consumer relationships in its Wisconsin and Illinois markets, emphasizing the value of its personal attention and service that remains unmatched by larger competitors. In addition to organic growth opportunities, Blackhawk may also pursue growth through selective acquisitions. Ability to grow or maintain profitability may be affected by uncertain economic conditions, competitive pressures, changes in regulatory burden and the interest rate environment.
About Blackhawk Bancorp
Blackhawk Bancorp, Inc. is headquartered in Beloit, Wisconsin and is the parent company of Blackhawk Bank. The combined entity operates eleven full-service banking centers and a dedicated commercial office, which are located in Rock County, Wisconsin and the Illinois counties of Winnebago, Boone, McHenry, Lake, and Kane. The Company's footprint stretches along the I-90 corridor from Janesville, Wisconsin to Elgin, Illinois and into the Northwest collar counties of the Chicagoland area. The company offers a variety of value-added consultative services to its business customers and their employees related to the financial products it provides.
Disclosures Regarding non-GAAP Measures
This report refers to financial measures that are identified as non-GAAP that the Company believes help to evaluate and measure the Company's performance, including the presentation of the net interest margin ratio and efficiency ratio calculations on a taxable-equivalent basis. Non-GAAP measures are also used to assist investor comparison by identifying nonrecurring events such as the 2019 acquisition-related expenses, nonrecurring securities gains and the impact such items have on the performance measures of return on average assets, return on average equity, diluted earnings per share, and the efficiency ratio. This supplemental information should not be considered in isolation or as a substitute for the related GAAP measures.
Forward-Looking Statements
When used in this communication, the words "believes," "expects," "likely", "would", and similar expressions are intended to identify forward-looking statements. The company's actual results may differ materially from those described in the forward-looking statements. Factors which could cause such a variance to occur include, but are not limited to: heightened competition; adverse state and federal regulation; failure to obtain new or retain existing customers; ability to attract and retain key executives and personnel; changes in interest rates; unanticipated changes in industry trends; unanticipated changes in credit quality and risk factors, including general economic conditions particularly in the Company's markets; potential deterioration in real estate values, success in gaining regulatory approvals when required; changes in the Federal Reserve Board monetary policies; unexpected outcomes of new and existing litigation in which Blackhawk or its subsidiaries, officers, directors or employees is named defendants; technological changes; changes in accounting principles generally accepted in the United States; changes in assumptions or conditions affecting the application of "critical accounting policies"; inability to recover previously recorded losses as anticipated, and the inability of third party vendors to perform critical services for the company or its customers. The inclusion of forward-looking information should not be construed as a representation by the Company or any person that future events or plans contemplated by the Company will be achieved. The Company undertakes no obligation to publicly update or revise any forward-looking statements whether as a result of new information or otherwise.
Further information is available on the company's website at www.blackhawkbank.com.
Blackhawk Bancorp, Inc.
Todd J. James, Chairman & CEO
tjames@blackhawkbank.com
Matthew McDonnell, SVP & CFO
mmcdonnell@blackhawkbank.com
Phone: (608) 364-8911
BLACKHAWK BANCORP, INC. AND SUBSIDIARIES
CONSOLIDATED BALANCE SHEETS
DECEMBER 31, 2020 AND DECEMBER 31, 2019
(UNAUDITED)
| December 31, | December 31, | |||||||
Assets | 2020 | 2019 | ||||||
| (Dollars in thousands, except | ||||||||
| share and per share data) | ||||||||
Cash and due from banks | $ | 12,012 | $ | 12,320 | ||||
Interest-bearing deposits in banks and other institutions | 42,119 | 20,761 | ||||||
Total cash and cash equivalents | 54,131 | 33,081 | ||||||
Certificates of deposit in banks and other institutions | 4,159 | 6,325 | ||||||
Equity securities at fair value | 2,517 | 2,365 | ||||||
Securities available-for-sale | 349,565 | 235,083 | ||||||
Loans held for sale | 6,096 | 6,540 | ||||||
Federal Home Loan Bank stock, at cost | 2,150 | 742 | ||||||
Loans, less allowance for loan losses of $10,764 and $7,941 | ||||||||
at December 31, 2020 and December 31, 2019, respectively | 662,225 | 619,359 | ||||||
Premises and equipment, net | 20,254 | 21,025 | ||||||
Goodwill and core deposit intangible | 12,018 | 12,455 | ||||||
Mortgage servicing rights | 3,409 | 3,106 | ||||||
Cash surrender value of bank-owned life insurance | 11,126 | 11,118 | ||||||
Other assets | 13,949 | 12,662 | ||||||
Total assets | $ | 1,141,599 | $ | 963,861 | ||||
Liabilities and Stockholders' Equity | ||||||||
Liabilities | ||||||||
Deposits: | ||||||||
Noninterest-bearing | $ | 268,866 | $ | 155,978 | ||||
Interest-bearing | 718,388 | 673,631 | ||||||
Total deposits | 987,254 | 829,609 | ||||||
Short-term borrowings | - | - | ||||||
Subordinated debentures and notes (including $1,031 at fair value at | ||||||||
December 31, 2020 and December 31, 2019) | 5,155 | 5,155 | ||||||
Senior secured term note | 12,833 | 14,000 | ||||||
Other borrowings | 14,000 | 10,000 | ||||||
Other liabilities | 10,602 | 7,773 | ||||||
Total liabilities | 1,029,844 | 866,537 | ||||||
Stockholders' equity | ||||||||
Common stock, $0.01 par value, 10,000,000 shares authorized; | ||||||||
3,435,348 and 3,399,803 shares issued as of December 31, 2020 and | ||||||||
December 31, 2019, respectively | 35 | 34 | ||||||
Additional paid-in capital | 35,062 | 33,989 | ||||||
Retained earnings | 69,676 | 60,295 | ||||||
Treasury stock, 62,999 and 105,185 shares at cost as of December 31, 2020 | ||||||||
and December 31, 2019, respectively | (941 | ) | (1,408 | ) | ||||
Accumulated other comprehensive income (loss) | 7,923 | 4,414 | ||||||
| Total stockholders' equity | 111,755 | 97,324 | ||||||
Total liabilities and stockholders' equity | $ | 1,141,599 | $ | 963,861 | ||||
BLACKHAWK BANCORP, INC. AND SUBSIDIARIES
CONSOLIDATED STATEMENTS OF INCOME
(UNAUDITED)
| Twelve months ended December 31, | |||||||||||
| 2020 | 2019 | ||||||||||
| (Amounts in thousands, except per share data) | |||||||||||
Interest Income: | |||||||||||
Interest and fees on loans | $ | 33,441 | $ | 32,449 | |||||||
Interest and dividends on available-for-sale securities: | |||||||||||
Taxable | 6,328 | 6,089 | |||||||||
Tax-exempt | 1,451 | 1,587 | |||||||||
Interest on other financial institutions | 276 | 528 | |||||||||
Total interest income | 41,496 | 40,653 | |||||||||
Interest Expense: | |||||||||||
Interest on deposits | 2,840 | 5,806 | |||||||||
Interest on short-term borrowings | 44 | 313 | |||||||||
Interest on subordinated debentures | 182 | 248 | |||||||||
Interest on senior secured term note | 498 | 591 | |||||||||
Interest on other | 83 | 11 | |||||||||
Total interest expense | 3,647 | 6,969 | |||||||||
Net interest income before provision for loan losses | 37,849 | 33,684 | |||||||||
Provision for loan losses | 7,600 | 2,010 | |||||||||
Net interest income after provision for loan losses | 30,249 | 31,674 | |||||||||
Noninterest Income: | |||||||||||
Service charges on deposits accounts | 3,035 | 3,715 | |||||||||
Net gain on sale of loans | 11,080 | 4,211 | |||||||||
Net loan servicing income | (431 | ) | 369 | ||||||||
Debit card interchange fees | 3,738 | 3,402 | |||||||||
Net gains on sales of securities available-for-sale | 535 | 1,171 | |||||||||
Net other gains (losses) | 64 | 89 | |||||||||
Increase in cash surrender value of bank-owned life insurance | 310 | 306 | |||||||||
Change in value of equity securities | 70 | 33 | |||||||||
Other | 1,380 | 1,832 | |||||||||
Total noninterest income | 19,781 | 15,128 | |||||||||
Noninterest Expenses: | |||||||||||
Salaries and employee benefits | 21,948 | 19,382 | |||||||||
Occupancy and equipment | 4,278 | 4,115 | |||||||||
Data processing | 2,383 | 3,574 | |||||||||
Debit card processing and issuance | 1,584 | 1,574 | |||||||||
Advertising and marketing | 297 | 450 | |||||||||
Amortization of core deposit intangible | 437 | 398 | |||||||||
Professional fees | 1,531 | 1,659 | |||||||||
Office Supplies | 363 | 405 | |||||||||
Telephone | 577 | 536 | |||||||||
Other | 2,752 | 2,520 | |||||||||
Total noninterest expenses | 36,150 | 34,613 | |||||||||
Income before income taxes | 13,880 | 12,189 | |||||||||
Provision for income taxes | 3,033 | 2,585 | |||||||||
Net income | $ | 10,847 | $ | 9,604 | |||||||
Key Ratios | |||||||||||
Basic Earnings Per Common Share | $ | 3.25 | $ | 2.90 | |||||||
Diluted Earnings Per Common Share | 3.25 | 2.90 | |||||||||
Dividends Per Common Share | 0.44 | 0.40 | |||||||||
Net Interest Margin (1) | 3.82 | % | 3.88 | % | |||||||
Efficiency Ratio (1)(2) | 63.14 | % | 72.10 | % | |||||||
Return on Assets | 1.02 | % | 1.02 | % | |||||||
Return on Common Equity | 10.35 | % | 10.49 | % | |||||||
(1) Non-GAAP Presentations: Management discloses certain non-GAAP financial measures to evaluate and measure the Company's performance, including the presentation of the net interest margin and efficiency ratio calculations on a taxable equivalent basis ("TE"). The net interest margin ratio is calculated by dividing net interest income on a tax equivalent basis by average earning assets for the period. Management believes this measure provides investors with information regarding comparative balance sheet profitability. (2) The efficiency ratio is calculated as noninterest expense divided by the sum of net interest income on a TE basis, noninterest income less any securities gains (losses) or other gains (losses), and also includes a TE adjustment on the increases in cash surrender value of bank-owned life insurance. | |||||||||||
BLACKHAWK BANCORP, INC. AND SUBSIDIARIES
CONSOLIDATED STATEMENTS OF INCOME
(UNAUDITED)
| For the Quarter Ended | ||||||||||||||||||||||
| December 31, | September 30, | June 30 | March 31, | December 31, | ||||||||||||||||||
| 2020 | 2020 | 2020 | 2020 | 2019 | ||||||||||||||||||
Interest Income: | (Dollars in thousands, except per share data) | |||||||||||||||||||||
Interest and fees on loans | $ | 8,079 | $ | 8,671 | $ | 8,658 | $ | 8,033 | $ | 8,284 | ||||||||||||
Interest on available-for-sale securities: | ||||||||||||||||||||||
Taxable | 1,598 | 1,607 | 1,618 | 1,505 | 1,496 | |||||||||||||||||
Tax-exempt | 384 | 372 | 371 | 323 | 331 | |||||||||||||||||
Interest on other financial institutions | 33 | 41 | 40 | 162 | 107 | |||||||||||||||||
Total interest income | 10,094 | 10,691 | 10,687 | 10,023 | 10,218 | |||||||||||||||||
Interest Expense: | ||||||||||||||||||||||
Interest on deposits | 458 | 565 | 639 | 1,177 | 1,400 | |||||||||||||||||
Interest on subordinated debentures | 41 | 42 | 45 | 53 | 58 | |||||||||||||||||
Interest on senior secured term note | 113 | 119 | 111 | 156 | 165 | |||||||||||||||||
Interest on other borrowings | 40 | 47 | 19 | 22 | 24 | |||||||||||||||||
Total interest expense | 652 | 773 | 814 | 1,408 | 1,647 | |||||||||||||||||
Net interest income before provision for loan losses | 9,442 | 9,918 | 9,873 | 8,615 | 8,571 | |||||||||||||||||
Provision for loan losses | 1,715 | 2,615 | 2,505 | 765 | 980 | |||||||||||||||||
Net interest income after provision for loan losses | 7,727 | 7,303 | 7,368 | 7,850 | 7,591 | |||||||||||||||||
Noninterest Income: | ||||||||||||||||||||||
Service charges on deposits accounts | 781 | 747 | 610 | 897 | 1,002 | |||||||||||||||||
Net gain on sale of loans | 3,572 | 3,412 | 3,192 | 905 | 1,257 | |||||||||||||||||
Net loan servicing income | (177 | ) | 26 | (389 | ) | 110 | 119 | |||||||||||||||
Debit card interchange fees | 979 | 1,002 | 924 | 832 | 876 | |||||||||||||||||
Net gains on sales of securities available-for-sale | 428 | - | 8 | 99 | - | |||||||||||||||||
Net other gains (losses) | - | 58 | 6 | - | (87 | ) | ||||||||||||||||
Increase in cash surrender value of bank-owned life insurance | 75 | 76 | 74 | 85 | 75 | |||||||||||||||||
Other | 310 | 344 | 425 | 273 | 632 | |||||||||||||||||
Total noninterest income | 5,968 | 5,665 | 4,850 | 3,201 | 3,874 | |||||||||||||||||
Noninterest Expenses: | ||||||||||||||||||||||
Salaries and employee benefits | 5,851 | 5,585 | 5,477 | 5,035 | 4,964 | |||||||||||||||||
Occupancy and equipment | 986 | 1,137 | 1,074 | 1,083 | 1,038 | |||||||||||||||||
Data processing | 683 | 629 | 561 | 510 | 520 | |||||||||||||||||
Debit card processing and issuance | 384 | 409 | 394 | 397 | 449 | |||||||||||||||||
Advertising and marketing | 75 | 87 | 38 | 97 | 101 | |||||||||||||||||
Amortization of intangibles | 107 | 107 | 107 | 115 | 119 | |||||||||||||||||
Professional fees | 373 | 386 | 405 | 367 | 300 | |||||||||||||||||
Office Supplies | 90 | 94 | 88 | 90 | 118 | |||||||||||||||||
Telephone | 140 | 138 | 149 | 150 | 153 | |||||||||||||||||
Other | 637 | 714 | 659 | 646 | 730 | |||||||||||||||||
Total noninterest expenses | 9,326 | 9,286 | 8,952 | 8,490 | 8,492 | |||||||||||||||||
Income before income taxes | 4,369 | 3,682 | 3,266 | 2,561 | 2,973 | |||||||||||||||||
Provision for income taxes | 1,022 | 819 | 704 | 487 | 621 | |||||||||||||||||
Net income | $ | 3,347 | $ | 2,863 | $ | 2,562 | $ | 2,074 | $ | 2,352 | ||||||||||||
Key Ratios | ||||||||||||||||||||||
Basic Earnings Per Common Share | $ | 1.00 | $ | 0.86 | $ | 0.77 | $ | 0.63 | $ | 0.71 | ||||||||||||
Diluted Earnings Per Common Share | 1.00 | 0.86 | 0.77 | 0.63 | 0.71 | |||||||||||||||||
Dividends Per Common Share | 0.11 | 0.11 | 0.11 | 0.11 | 0.10 | |||||||||||||||||
Net Interest Margin (1) | 3.63 | % | 3.83 | % | 3.99 | % | 3.83 | % | 3.83 | % | ||||||||||||
Efficiency Ratio (1)(2) | 61.80 | % | 59.39 | % | 60.43 | % | 71.89 | % | 67.25 | % | ||||||||||||
Return on Assets | 1.20 | % | 1.03 | % | 0.96 | % | 0.85 | % | 0.97 | % | ||||||||||||
Return on Common Equity | 12.08 | % | 10.64 | % | 10.16 | % | 8.31 | % | 9.60 | % | ||||||||||||
| (2) The efficiency ratio is calculated as noninterest expense divided by the sum of net interest income on an TE basis, noninterest income less any securities gains (losses) or other gains (losses), and also includes a TE adjustment on interest on tax-exempt securities, loans, and the increases in cash surrender value of bank-owned life insurance.
| ||||||||||||||||||||||
(UNAUDITED) | As of | |||||||||||||||||||
| December 31, | September 30, | June 30, | March 31, | December 31, | ||||||||||||||||
| 2020 | 2020 | 2020 | 2020 | 2019 | ||||||||||||||||
| (Amounts in thousands, except per share data) | ||||||||||||||||||||
Cash and due from banks | $ | 12,012 | $ | 17,403 | $ | 14,527 | $ | 15,240 | $ | 12,320 | ||||||||||
Interest-bearing deposits in banks and other | 46,278 | 47,848 | 25,246 | 6,775 | 27,086 | |||||||||||||||
Securities | 352,082 | 317,761 | 301,726 | 265,165 | 237,448 | |||||||||||||||
Net loans/leases | 668,321 | 681,060 | 697,881 | 626,797 | 625,899 | |||||||||||||||
Goodwill and core deposit intangible | 12,018 | 12,125 | 12,232 | 12,340 | 12,455 | |||||||||||||||
Other assets | 50,888 | 50,105 | 49,485 | 50,688 | 48,653 | |||||||||||||||
Total assets | $ | 1,141,599 | $ | 1,126,302 | $ | 1,101,097 | $ | 977,005 | $ | 963,861 | ||||||||||
Deposits | $ | 987,254 | $ | 960,773 | $ | 939,066 | $ | 843,061 | $ | 829,609 | ||||||||||
Subordinated debentures | 5,155 | 5,155 | 5,155 | 5,155 | 5,155 | |||||||||||||||
Senior secured term note | 12,833 | 13,222 | 13,611 | 14,000 | 14,000 | |||||||||||||||
Borrowings | 14,000 | 29,000 | 29,000 | 10,000 | 10,035 | |||||||||||||||
Other liabilities | 10,602 | 10,161 | 9,758 | 6,083 | 7,738 | |||||||||||||||
Stockholders' equity | 111,755 | 107,991 | 104,507 | 98,706 | 97,324 | |||||||||||||||
Total liabilities and stockholders' equity | $ | 1,141,599 | $ | 1,126,302 | $ | 1,101,097 | $ | 977,005 | $ | 963,861 | ||||||||||
ASSET QUALITY DATA | ||||||||||||||||||||
(Amounts in thousands) | December 31, | September 30, | June 30, | March 31, | December 31, | |||||||||||||||
| 2020 | 2020 | 2020 | 2020 | 2019 | ||||||||||||||||
Non-accrual loans | $ | 7,013 | $ | 8,584 | $ | 8,427 | $ | 9,680 | $ | 10,642 | ||||||||||
Accruing loans past due 90 days or more | - | 196 | - | 845 | - | |||||||||||||||
Troubled debt restructures - accruing | 2,057 | 2,176 | 2,361 | 2,770 | 2,866 | |||||||||||||||
Total nonperforming loans | $ | 9,070 | $ | 10,956 | $ | 10,788 | $ | 13,295 | $ | 13,508 | ||||||||||
Other real estate owned | 1 | 1 | 762 | 123 | 54 | |||||||||||||||
Total nonperforming assets | $ | 9,071 | $ | 10,957 | $ | 11,550 | $ | 13,418 | $ | 13,562 | ||||||||||
Total loans | $ | 679,085 | $ | 691,003 | $ | 707,983 | $ | 634,957 | $ | 633,840 | ||||||||||
Allowance for loan losses | $ | 10,764 | $ | 9,943 | $ | 10,102 | $ | 8,160 | $ | 7,941 | ||||||||||
| $ | 668,321 | $ | 681,060 | $ | 697,881 | $ | 626,797 | $ | 625,899 | |||||||||||
Nonperforming Assets to total Assets | 0.79 | % | 0.97 | % | 1.05 | % | 1.37 | % | 1.41 | % | ||||||||||
Nonperforming loans to total loans | 1.34 | % | 1.59 | % | 1.52 | % | 2.09 | % | 2.13 | % | ||||||||||
Allowance for loan losses to total loans | 1.59 | % | 1.44 | % | 1.43 | % | 1.29 | % | 1.25 | % | ||||||||||
Allowance for loan losses to nonperforming loans | 118.7 | % | 90.8 | % | 93.6 | % | 61.4 | % | 58.8 | % | ||||||||||
| For the Quarter Ended | ||||||||||||||||||||
| December 31, | September 30, | June 30, | March 31, | December 31, | ||||||||||||||||
ROLLFORWARD OF ALLOWANCE | 2020 | 2020 | 2020 | 2020 | 2019 | |||||||||||||||
Beginning Balance | $ | 9,943 | $ | 10,102 | $ | 8,160 | $ | 7,941 | $ | 8,324 | ||||||||||
Provision | 1,715 | 2,615 | 2,505 | 765 | 980 | |||||||||||||||
Loans charged off | 1,334 | 2,892 | 639 | 633 | 1,463 | |||||||||||||||
Loan recoveries | 440 | 118 | 76 | 87 | 100 | |||||||||||||||
Net charge-offs | 894 | 2,774 | 563 | 546 | 1,363 | |||||||||||||||
Ending Balance | $ | 10,764 | $ | 9,943 | $ | 10,102 | $ | 8,160 | $ | 7,941 | ||||||||||
BLACKHAWK BANCORP, INC. AND SUBSIDIARIES
AVERAGE BALANCE SHEET WITH RESULTANT INTEREST AND RATES
Average Balance Sheet with Resultant Interest and Rates
(Amounts in thousands)
(yields on a tax-equivalent basis)(1)
| For the Twelve Months Ended | ||||||||||||||||||||||||
| December 31, 2020 | December 31, 2019 | |||||||||||||||||||||||
| Average | Average | Average | Average | |||||||||||||||||||||
| Balance | Interest | Rate | Balance | Interest | Rate | |||||||||||||||||||
Interest Earning Assets: | ||||||||||||||||||||||||
Interest-bearing deposits and other | $ | 31,899 | $ | 276 | 0.86 | % | $ | 23,058 | $ | 528 | 2.29 | % | ||||||||||||
Investment securities: | ||||||||||||||||||||||||
Taxable investment securities | 247,389 | 6,328 | 2.56 | % | 193,954 | 6,089 | 3.14 | % | ||||||||||||||||
Tax-exempt investment securities | 46,594 | 1,451 | 4.01 | % | 50,100 | 1,587 | 3.88 | % | ||||||||||||||||
Total Investment securities | 293,983 | 7,779 | 2.79 | % | 244,054 | 7,676 | 3.29 | % | ||||||||||||||||
Loans | 675,466 | 33,441 | 4.95 | % | 610,472 | 32,449 | 5.32 | % | ||||||||||||||||
Total Earning Assets | $ | 1,001,348 | $ | 41,496 | 4.19 | % | $ | 877,584 | $ | 40,653 | 4.67 | % | ||||||||||||
Allowance for loan losses | (9,535 | ) | (7,778 | ) | ||||||||||||||||||||
Cash and due from banks | 16,453 | 15,765 | ||||||||||||||||||||||
Other assets | 58,475 | 57,920 | ||||||||||||||||||||||
Total Assets | $ | 1,066,741 | $ | 943,491 | ||||||||||||||||||||
Interest Bearing Liabilities: | ||||||||||||||||||||||||
Interest bearing checking accounts | $ | 281,053 | $ | 807 | 0.29 | % | $ | 254,228 | $ | 1,483 | 0.58 | % | ||||||||||||
Savings and money market deposits | 318,169 | 676 | 0.21 | % | 286,719 | 2,237 | 0.78 | % | ||||||||||||||||
Time deposits | 97,747 | 1,357 | 1.39 | % | 116,814 | 2,086 | 1.79 | % | ||||||||||||||||
Total interest bearing deposits | 696,969 | 2,840 | 0.41 | % | 657,761 | 5,806 | 0.88 | % | ||||||||||||||||
Subordinated debentures | 5,155 | 182 | 3.53 | % | 5,155 | 248 | 4.81 | % | ||||||||||||||||
Borrowings | 34,227 | 625 | 1.83 | % | 27,145 | 915 | 3.37 | % | ||||||||||||||||
Total Interest-Bearing Liabilities | $ | 736,351 | $ | 3,647 | 0.50 | % | $ | 690,061 | $ | 6,969 | 1.01 | % | ||||||||||||
Interest Rate Spread | 3.69 | % | 3.66 | % | ||||||||||||||||||||
Noninterest checking accounts | 218,254 | 155,936 | ||||||||||||||||||||||
Other liabilities | 7,357 | 5,956 | ||||||||||||||||||||||
Total liabilities | 961,962 | 851,953 | ||||||||||||||||||||||
Total Stockholders' equity | 104,779 | 91,538 | ||||||||||||||||||||||
Total Liabilities and | ||||||||||||||||||||||||
Stockholders' Equity | $ | 1,066,741 | $ | 943,491 | ||||||||||||||||||||
Net Interest Income/Margin | $ | 37,849 | 3.82 | % | $ | 33,684 | 3.88 | % | ||||||||||||||||
(1) Management discloses certain non-GAAP financial measures to evaluate and measure the Company's performance including a presentation of net interest income with a net interest margin ratio on a tax-equivalent (TE) basis. The net interest margin is calculated by dividing net interest income on a TE basis by average earning assets for the period. Management believes this measure provides investors with information regarding comparative balance sheet profitability. Nonaccrual loans are included in the above-stated average balances.
| ||||||||||||||||||||||||
BLACKHAWK BANCORP, INC. AND SUBSIDIARIES
ANALYSIS of AVERAGE BALANCES & TAX EQUIVALENT INTEREST RATES
Average Balance Sheet with Resultant Interest and Rates
(Yields on a tax-equivalent basis) (1)
| For the Quarter Ended | |||||||||||||||||||||||||||
| December 31, 2020 | September 30, 2020 | ||||||||||||||||||||||||||
| Average | Average | Average | Average | ||||||||||||||||||||||||
| Balance | Interest | Rate | Balance | Interest | Rate | ||||||||||||||||||||||
Interest Earning Assets: | |||||||||||||||||||||||||||
Interest-bearing deposits and other | $ | 30,058 | $ | 32 | 0.43 | % | $ | 42,716 | $ | 41 | 0.38 | % | |||||||||||||||
Investment securities: | |||||||||||||||||||||||||||
Taxable investment securities | 285,167 | 1,598 | 2.23 | % | 257,506 | 1,607 | 2.48 | % | |||||||||||||||||||
Tax-exempt investment securities | 51,902 | 384 | 3.78 | % | 47,090 | 372 | 4.09 | % | |||||||||||||||||||
Total Investment securities | 337,069 | 1,982 | 2.47 | % | 304,596 | 1,979 | 2.73 | % | |||||||||||||||||||
Loans | 678,335 | 8,079 | 4.74 | % | 693,418 | 8,670 | 4.97 | % | |||||||||||||||||||
Total Earning Assets | $ | 1,045,462 | $ | 10,093 | 3.88 | % | $ | 1,040,730 | $ | 10,690 | 4.13 | % | |||||||||||||||
Allowance for loan losses | (10,313 | ) | (11,018 | ) | |||||||||||||||||||||||
Cash and due from banks | 16,032 | 18,901 | |||||||||||||||||||||||||
Other assets | 58,663 | 58,022 | |||||||||||||||||||||||||
Total Assets | $ | 1,109,844 | $ | 1,106,635 | |||||||||||||||||||||||
Interest Bearing Liabilities: | |||||||||||||||||||||||||||
Interest bearing checking accounts | $ | 261,739 | $ | 150 | 0.23 | % | $ | 292,875 | $ | 166 | 0.23 | % | |||||||||||||||
Savings and money market deposits | 349,028 | 98 | 0.11 | % | 335,043 | 111 | 0.13 | % | |||||||||||||||||||
Time deposits | 84,166 | 210 | 0.99 | % | 91,366 | 288 | 1.25 | % | |||||||||||||||||||
Total interest bearing deposits | 694,933 | 458 | 0.26 | % | 719,284 | 565 | 0.31 | % | |||||||||||||||||||
Subordinated debentures and notes | 5,155 | 41 | 3.19 | % | 5,155 | 42 | 3.25 | % | |||||||||||||||||||
Borrowings | 30,186 | 152 | 2.01 | % | 42,637 | 165 | 1.54 | % | |||||||||||||||||||
Total Interest-Bearing Liabilities | $ | 730,274 | $ | 651 | 0.36 | % | $ | 767,076 | $ | 772 | 0.40 | % | |||||||||||||||
Interest Rate Spread | 3.52 | % | 3.73 | % | |||||||||||||||||||||||
Noninterest checking accounts | 261,182 | 224,552 | |||||||||||||||||||||||||
Other liabilities | 8,202 | 7,950 | |||||||||||||||||||||||||
Total liabilities | 999,658 | 999,578 | |||||||||||||||||||||||||
Total Stockholders' equity | 110,186 | 107,057 | |||||||||||||||||||||||||
Total Liabilities and | |||||||||||||||||||||||||||
Stockholders' Equity | $ | 1,109,844 | $ | 1,106,635 | |||||||||||||||||||||||
Net Interest Income/Margin | $ | 9,442 | 3.63 | % | $ | 9,918 | 3.83 | % | |||||||||||||||||||
| (1) Management discloses certain non-GAAP financial measures to evaluate and measure the Company's performance including a presentation of net interest income with a net interest margin ratio on a tax-equivalent (TE) basis. The net interest margin is calculated by dividing net interest income on a TE basis by average earning assets for the period. Management believes this measure provides investors with information regarding comparative balance sheet profitability. Nonaccrual loans are included in the above-stated average balances. | |||||||||||||||||||||||||||
SOURCE: Blackhawk Bancorp, Inc.
View source version on accesswire.com:
https://www.accesswire.com/626435/Blackhawk-Bancorp-Achieves-Record-Earnings-for-2020
