

- Delivered record second-quarter operating revenues of $6.3 billion, driven by strong demand across the network
- Reported an adjusted EBITDA of $719 million, at the top end of the second-quarter guidance range, and an operating loss of $215 million, including $388 million of labour-related and other charges
- Generated $651 million in net cash flows from operating activities and $174 million in free cash flow*
- Deployed $125 million in the quarter to repurchase over six million shares
- Reinstated and updated full-year 2026 guidance, including adjusted EBITDA of $2.9 billion to $3.2 billion
MONTRÉAL, Aug. 11, 2026 (GLOBE NEWSWIRE) -- Air Canada today reported its second quarter 2026 financial results and provided updated full-year 2026 financial guidance.
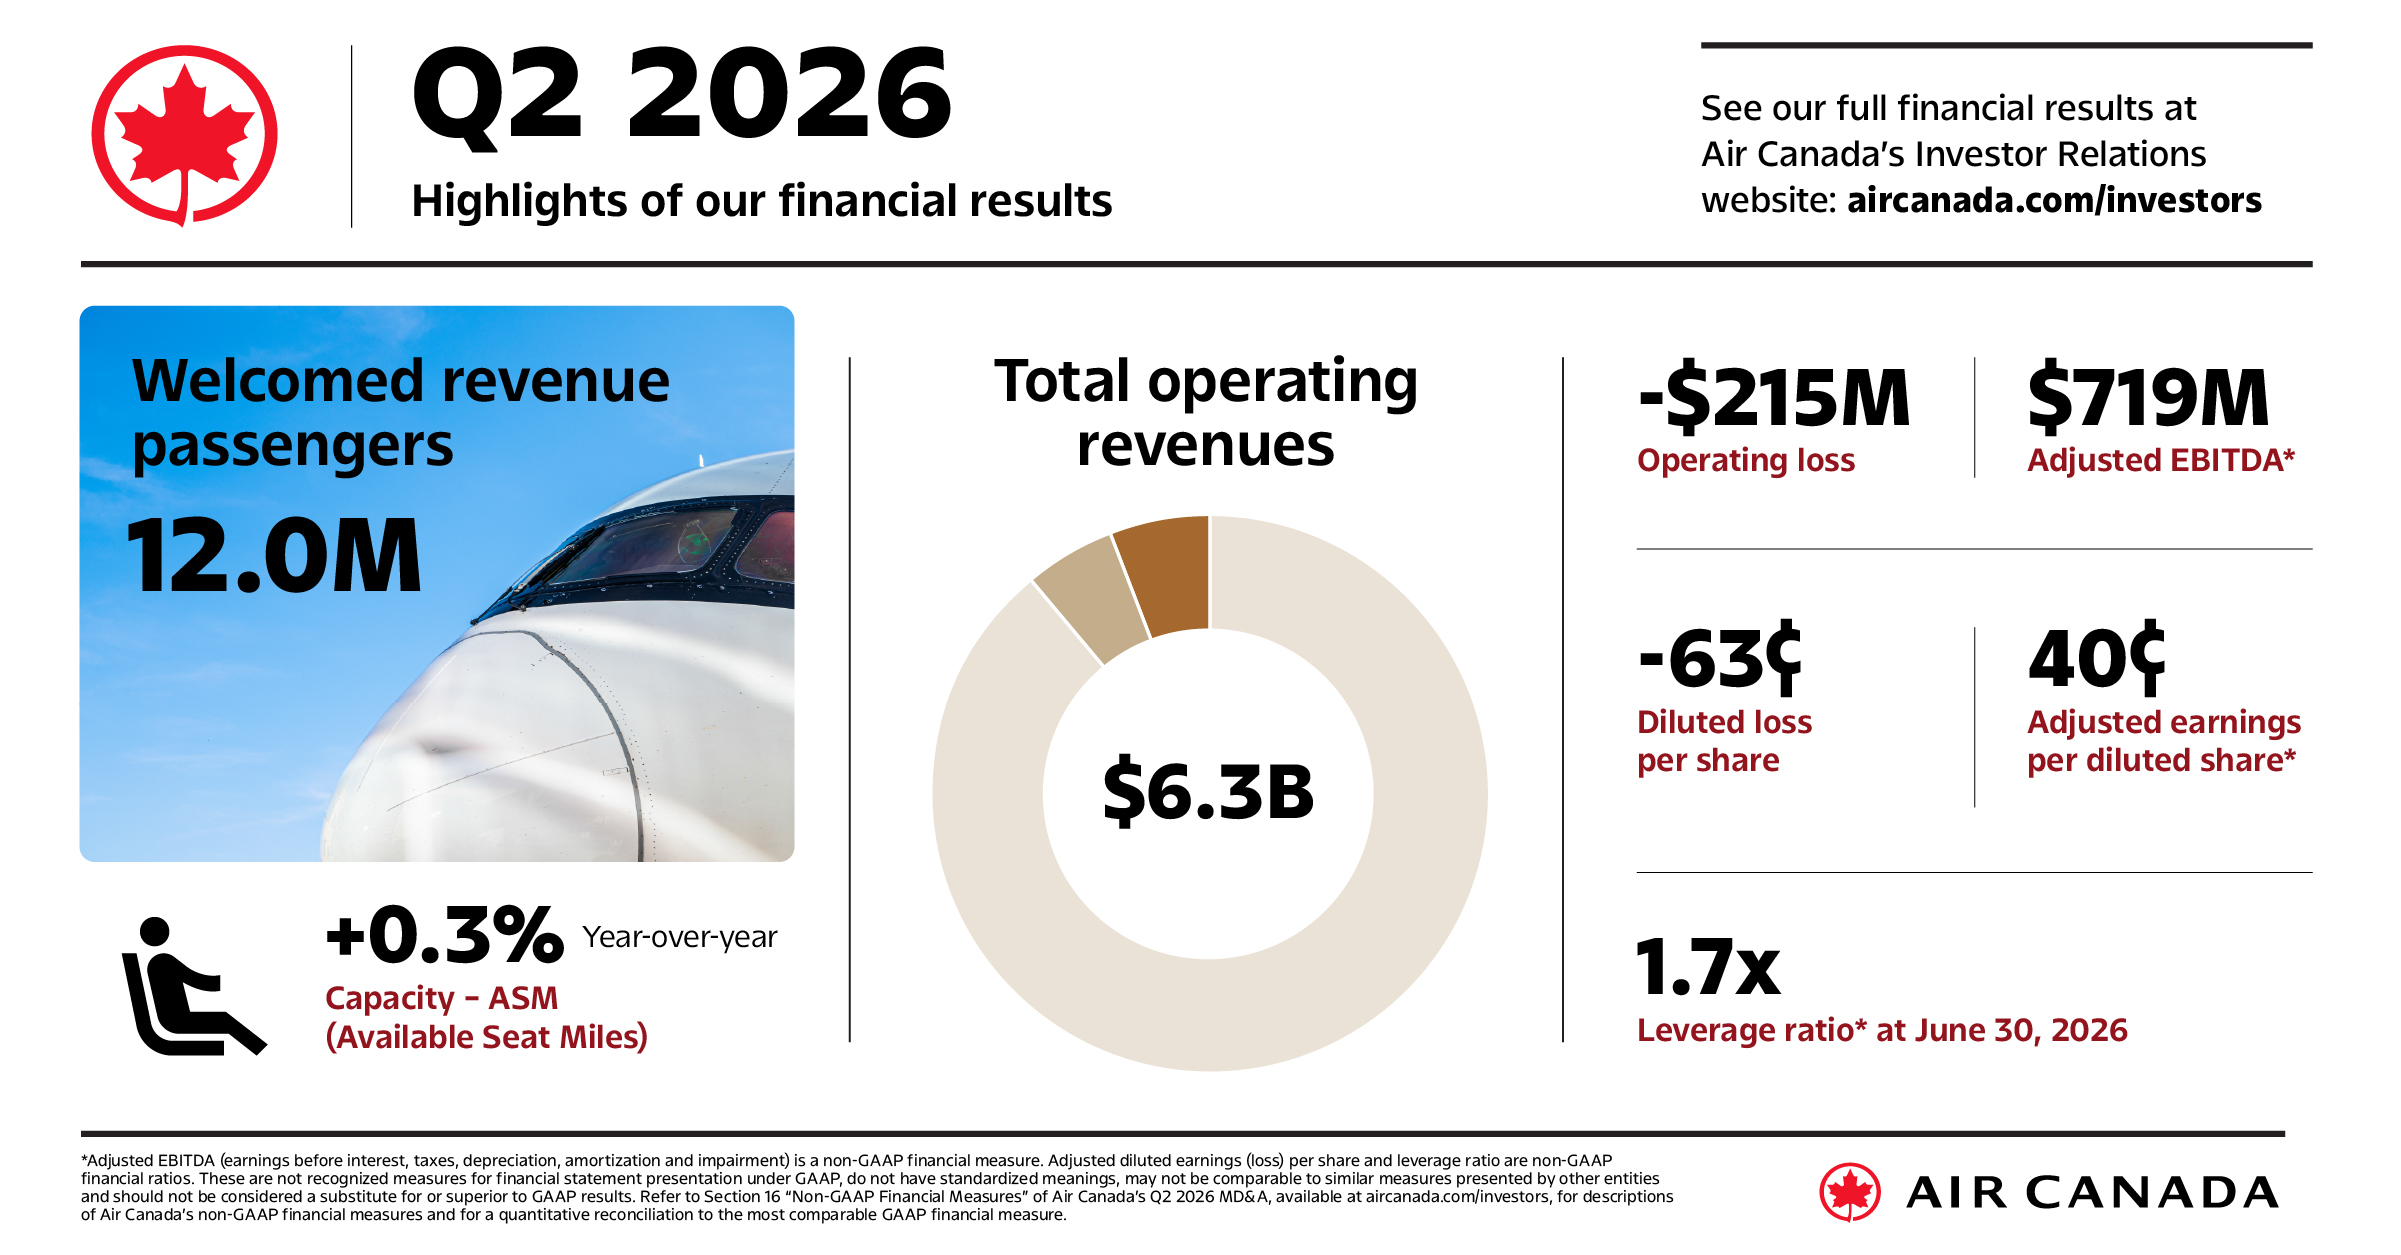
"Air Canada delivered record second-quarter operating revenues, up 11 per cent year over year, supported by strong demand across our network, including continued strength in premium and corporate travel, as well as Sixth Freedom traffic. Capacity increased 0.3 per cent year over year, 0.2 percentage points below the lower end of our second quarter guidance mainly due to weather-related disruptions that negatively affected flight completion rates in the latter part of the quarter. Adjusted EBITDA reached $719 million, at the top end of our second quarter guidance range, despite a 49 per cent year-over-year increase in fuel expense. The performance in the quarter reflected the benefits of our diversified sources of revenue, the effectiveness of our pricing actions, and our continued focus on controllable cost execution. It especially underscores the dedication and professionalism of our employees, whom I thank for their unwavering commitment to serving our customers with excellence," said Michael Rousseau, President and Chief Executive Officer.
"Cash generation and balance sheet strength remain key anchors of Air Canada's financial foundation. In the quarter, we generated $651 million in net cash flows from operating activities and $174 million in free cash flow, fuelling our ability to invest in the business and return capital to shareholders. In the quarter, we deployed $125 million for share repurchases and maintained our leverage ratio* at 1.7.
"Looking ahead, we are reinstating and updating full-year 2026 guidance, supported by resilient demand for premium and corporate travel, our fare actions to mitigate fuel-price volatility and our disciplined cost management. Reflecting the progress we have made in strengthening our financial position, we believe an investment grade rating is achievable in the mid-term. Beyond 2026, with Anko van der Werff announced as my successor, I am confident Air Canada has leadership continuity, a clear strategy and the financial strength to continue driving its long-term objectives and create significant sustainable value for all stakeholders," concluded Mr. Rousseau.
- Adjusted CASM, adjusted EBITDA (earnings before interest, taxes, depreciation- amortization and impairment), adjusted EBITDA margin, leverage ratio, net debt, adjusted pre-tax income (loss), adjusted net income (loss), adjusted earnings (loss) per share - diluted, and free cash flow are referred to in this news release. Such measures are non-GAAP financial measures, non-GAAP ratios or supplementary financial measures, are not recognized measures for financial statement presentation under GAAP, do not have standardized meanings, may not be comparable to similar measures presented by other entities and should not be considered a substitute for or superior to GAAP results. Leverage ratio of 1.4 at June 30, 2025. Adjusted EBITDA and operating income for the trailing 12-month period ended June 30, 2026 were $3- 170 billion and $510 million, respectively ($3.515 billion and $1.096 billion, respectively for the trailing 12-month period ended June 30, 2025)- Refer to the "Non-GAAP Financial Measures" section of this news release for descriptions of these measures and for a reconciliation of Air Canada non-GAAP measures used in this news release to the most comparable GAAP financial measure.
Second Quarter 2026 Financial Results
- Operating revenues of $6.266 billion
- Operating expenses of $6.481 billion
- Operating loss of $215 million with an operating margin of (3.4)% and an adjusted EBITDA* of $719 million with an adjusted EBITDA margin* of 11.5%
- Loss before income taxes of $316 million and adjusted pre-tax income* of $77 million
- Net loss of $178 million and diluted loss per share of $0.63
- Adjusted net income* of $114 million and adjusted earnings per diluted share* of $0.40
- Adjusted CASM* of 15.47 cents
- Net cash flows from operating activities of $651 million and free cash flow of $174 million
- Long-term debt and lease liabilities of $12.794 billion and a net leverage ratio* of 1.7
Outlook
Air Canada is reinstating updated financial guidance for full-year 2026 as follows:
| Metric | Updated Full-Year 2026 Guidance | Prior Full-Year 2026 Guidance (Suspended on April 30, 2026) |
| Adjusted EBITDA* | $2.9 billion to $3.2 billion | $3.35 billion to $3.75 billion |
| ASM capacity | 2.25% to 3.25% increase from 2025 | 3.5% to 5.5% increase versus 2025 |
| Adjusted CASM* | 5-6% increase from 2025 | 15.05 ¢ to 15.35 ¢ |
| Free cash flow* | $200 million to $500 million | $400 million to $800 million |
*Refer to the "Non-GAAP Financial Measures" section of this news release for descriptions of these measures, and for a reconciliation of Air Canada non-GAAP measures used in this news release to the most comparable GAAP financial measure.
Major Assumptions
Air Canada made assumptions in providing its guidance, including a modest Canadian GDP growth for 2026 and current demand trends continuing through the third quarter and remainder of 2026. Air Canada assumes that the Canadian dollar will trade, on average, at C$1.41 per U.S. dollar for the full year 2026 (previously C$1.36 per U.S. dollar). Air Canada also assumes that the price of jet fuel will average at approximately C$1.38 per litre for the third quarter of 2026 and C$1.29 per litre for the fourth quarter of 2026 (previously an average of C$0.90 per litre for the full year 2026). Our assumptions are based on the forward curve as of July 29, 2026, adjusted to reflect Air Canada's specific supply chain environment, including Air Canada's fuel infrastructure at Canadian hubs, where fuel is typically contracted and received on a one- to two-month forward basis, as well as pricing exposure at international station locations. These jet fuel estimates reflect Air Canada's capacity plans and remain subject to ongoing volatility in global energy markets.
Air Canada expects it can offset, for the third quarter of 2026, approximately 60 per cent of the estimated incremental jet fuel expense above its assumptions immediately prior to February 12, 2026, which includes the expected hedging gains in the third quarter, and 100% for the fourth quarter of 2026.
Air Canada has entered into non-binding letters for up to $2 billion in sale and leaseback transactions scheduled to close in 2026 and 2027, subject to the execution of definitive and binding agreements and completion of standard conditions precedent. As part of the assumptions for 2026 guidance, Air Canada has assumed execution on its sale-leaseback transactions for $1 billion in 2026.
Air Canada's guidance constitutes forward-looking information within the meaning of applicable securities laws and is subject to important risks and uncertainties, including in relation to statements or actions by governments and uncertainty relating to the imposition of (or threats to impose) tariffs on Canadian exports or imports and their resulting impacts on the Canadian, North American and global economies and travel demand. In addition, aircraft fuel prices have been, and continue to be, subject to high volatility as a result of the ongoing conflicts in the Middle East. Moreover, there has been significant disruption to international shipping trade routes through the Strait of Hormuz, further exacerbating the impact on fuel supply and prices, including for aircraft fuel. A prolonged or escalating conflict could further disrupt global energy markets and cause aircraft fuel prices to remain elevated or rise even higher. We cannot predict future supply constraints, price volatility or cost of aircraft fuel, or how long current or future conflicts will last or their ultimate impact on global energy markets and across the aviation industry. Please see the discussion below under Caution Regarding Forward-looking Information.
2028 targets and 2030 aspirations
Air Canada announced the following long-term 2028 financial targets and 2030 aspirations in December 2024:
| Metric | 2028 Targets | 2030 Aspirations |
| Operating revenues | Approximately $30 billion | Exceed $30 billion |
| Adjusted EBITDA margin* | Greater than or equal to 17% | Between 18% and 20% |
| Net cash flows from operating activities as a percentage of adjusted EBITDA* | Approximately 90% | Approximately 90% |
| Additions to property, equipment and intangible assets as a percentage of operating revenues* | Lower than or equal to 12% | Lower than 12% |
| Free cash flow margin* | Approximately 5% | Approximately 5% |
| Return on invested capital* | Not provided | Greater than or equal to 12% |
| Fully diluted share count | Lower than 300 million shares | Lower than 300 million shares |
- Adjusted EBITDA (earnings before interest, taxes, depreciation, amortization and impairment), adjusted EBITDA margin, net cash flows from operating activities as a percentage of adjusted EBITDA, additions to property, equipment and intangible assets as a percentage of operating revenues, free cash flow margin and return on invested capital are referred to in this news release. Such measures are non-GAAP financial measures, non-GAAP ratios or supplementary financial measures, are not recognized measures for financial statement presentation under GAAP, do not have standardized meanings, may not be comparable to similar measures presented by other entities and should not be considered a substitute for or superior to GAAP results. Refer to the "Non-GAAP Financial Measures" section of this news release for descriptions of these measures and for a reconciliation of Air Canada non-GAAP measures used in this news release to the most comparable GAAP financial measure.
The 2028 long-term targets and 2030 aspirations provided in this news release do not constitute guidance or outlook but rather are provided for the purpose of assisting the reader in measuring progress toward Air Canada's objectives. Readers are cautioned that these targets and aspirations may change as conditions evolve and are referred to the assumptions, risks and uncertainties described in the 2024 Investor Day presentations, which are available in the events section at aircanada.com/investors and elsewhere in this news release, including assumptions relating to demand trends, jet fuel supply, prices and forward curves, the ability to significantly recapture elevated fuel prices, increasing revenues, growing fleet and network capacity and successfully executing on other key investments and initiatives.
Non-GAAP Financial Measures
Below is a description of certain non-GAAP financial measures and ratios used by Air Canada to provide readers with additional information on its financial and operating performance. Such measures are not recognized measures for financial statement presentation under GAAP, do not have standardized meanings, may not be comparable to similar measures presented by other entities and should not be considered a substitute for or superior to GAAP results. The non-GAAP financial measures or ratios described in this section typically have exclusions or adjustments that include one or more of the following characteristics: being highly variable, difficult to project, unusual in nature, significant to the results of a particular period or not indicative of past or future operating results. These items are excluded because Air Canada believes these may distort the analysis of certain business trends and render comparative analysis across periods less meaningful and their exclusion generally allows for a more meaningful analysis of Air Canada's operating expense performance and may allow for a more meaningful comparison to other airlines.
In the second quarter of 2026, Air Canada concluded a four-year collective agreement with Unifor and recorded a pension past service cost of $132 million related to pension plan amendments in relation to this agreement. Air Canada also recorded a $208 million charge related to pensioner lump sum payments and voluntary separation packages following the completion, in April 2026, of this agreement, allowing proceeds from the sale of shares held in the union pension funding trust to be used for these purposes. Air Canada also recorded a $20 million benefits-related past service cost and a $28 million provision in respect of a legal matter. These items were excluded in the calculation of adjusted CASM, adjusted EBITDA, adjusted pre-tax income and adjusted net income. Additionally, a related $41 million interest expense associated with a legal matter was excluded from adjusted pre-tax income and adjusted net income.
In 2025, Air Canada recorded a one-time pension past service cost and other labour-related charges of $194 million, including from the pension plan amendments made in conjunction with the collective agreement reached with the Canadian Union of Public Employees (CUPE) and an operating expense related to the streamlining of Air Canada's management structure. In 2024, with ratification of the collective agreement with the Air Line Pilots Association (ALPA), Air Canada recorded a pension past service cost of $490 million in the fourth quarter of 2024. Air Canada has excluded these charges in computing its adjusted EBITDA, adjusted CASM, adjusted pre-tax income and adjusted net income.
A charge of $34 million was recorded in the third quarter of 2024 in other operating expenses related to estimated costs associated with contractual lease obligations. Air Canada excluded this expense in computing adjusted CASM, adjusted EBITDA, adjusted pre-tax income and adjusted net income.
Air Canada excludes the effect of impairment of assets, if any, when calculating adjusted CASM, adjusted EBITDA, adjusted EBITDA margin, adjusted pre-tax income (loss) and adjusted net income (loss) as it may distort the analysis of certain business trends and render comparative analysis across periods or to other airlines less meaningful. Air Canada did not record charges for impairment of assets in 2026, 2025 or 2024.
Adjusted CASM
Air Canada uses adjusted CASM to assess the operating and cost performance of its ongoing airline business without the effects of aircraft fuel expense, the cost of ground packages at Air Canada Vacations, freighter costs and other items. These items may distort the analysis of certain business trends and render comparative analysis across periods less meaningful and their exclusion generally allows for a more meaningful analysis of Air Canada's operating expense performance and may allow for a more meaningful comparison to that of other airlines.
In calculating adjusted CASM, aircraft fuel expense is excluded from operating expense results as it fluctuates widely depending on many factors, including international market conditions, geopolitical events, jet fuel refining costs and Canada/U.S. currency exchange rates. Air Canada also incurs expenses related to ground packages at Air Canada Vacations, which some airlines, without comparable tour operator businesses, may not incur. In addition, these costs do not generate ASMs and therefore excluding these costs from operating expense results provides for a more meaningful comparison across periods when such costs may vary.
Air Canada also incurs expenses related to the operation of freighter aircraft, which some airlines, without comparable cargo businesses, may not incur. Air Canada had six Boeing 767 dedicated freighter aircraft in service as at June 30, 2026, and as at June 30, 2025. These costs do not generate ASMs and therefore excluding these costs from operating expense results provides for a more meaningful comparison of the passenger airline business across periods.
The following tables provide the adjusted CASM reconciliation to GAAP operating expense for the periods indicated.
| (Canadian dollars in millions, except where indicated) | Second Quarter | First Six Months | ||||||||||||||||
| 2026 | 2025 | Change | 2026 | 2025 | Change | |||||||||||||
| Operating expense - GAAP | - | 6,481 | - | 5,214 | - | 1,267 | - | 12,149 | - | 10,518 | - | 1,631 | ||||||
| Adjusted for: | ||||||||||||||||||
| Aircraft fuel | (1,713 | - | (1,148 | - | (565 | - | (2,907 | - | (2,334 | - | (573 | - | ||||||
| Ground package costs | (164 | - | (157 | - | (7 | - | (596 | - | (530 | - | (66 | - | ||||||
| Freighter costs (excluding fuel) | (49 | - | (42 | - | (7 | - | (91 | - | (84 | - | (7 | - | ||||||
| Pension plan share trust | (208 | - | - | (208 | - | (208 | - | - | (208 | - | ||||||||
| Pension plan amendments | (132 | - | - | (132 | - | (132 | - | - | (132 | - | ||||||||
| Benefits-related past service cost | (20 | - | - | (20 | - | (20 | - | - | (20 | - | ||||||||
| Provision for legal reserve | (28 | - | - | (28 | - | (28 | - | - | (28 | - | ||||||||
| Operating expense, adjusted for the above-noted items | - | 4,167 | - | 3,867 | - | 300 | 8,167 | 7,570 | 597 | |||||||||
| ASMs (millions) | 26,942 | 26,860 | 0.3: | 51,771 | 51,100 | 1.3: | ||||||||||||
| Adjusted CASM (cents) | - | 15.47 | - | 14.40 | - | 1.07 | - | 15.78 | - | 14.81 | - | 0.97 | ||||||
Adjusted EBITDA and Adjusted EBITDA Margin
Adjusted EBITDA (earnings before interest, taxes, depreciation, amortization and impairment) and adjusted EBITDA margin (adjusted EBITDA as a percentage of operating revenues) are commonly used in the airline industry and are used by Air Canada as a means to view operating results and the related margin before interest, taxes, depreciation, amortization and impairment and other items. These items can vary significantly among airlines due to differences in the way airlines finance their aircraft and other assets.
Adjusted EBITDA and adjusted EBITDA margin are reconciled to GAAP operating income as follows:
| (Canadian dollars in millions, except where indicated) | Second Quarter | First Six Months | ||||||||||||||||
| 2026 | 2025 | Change | 2026 | 2025 | Change | |||||||||||||
| Operating income (loss) - GAAP | - | (215 | - | - | 418 | - | (633 | - | - | (98 | - | - | 310 | - | (408 | - | ||
| Add back: | ||||||||||||||||||
| Depreciation, amortization and impairment | 546 | 491 | 55 | 1,052 | 986 | 66 | ||||||||||||
| Pension plan share trust | 208 | - | 208 | 208 | - | 208 | ||||||||||||
| Pension plan amendments | 132 | - | 132 | 132 | - | 132 | ||||||||||||
| Benefits-related past service cost | 20 | - | 20 | 20 | - | 20 | ||||||||||||
| Provision for legal reserve | 28 | - | 28 | 28 | - | 28 | ||||||||||||
| Adjusted EBITDA | - | 719 | - | 909 | - | (190 | - | - | 1,342 | - | 1,296 | - | 46 | |||||
| Operating revenues | - | 6,266 | - | 5,632 | - | 634 | - | 12,051 | - | 10,828 | - | 1,223 | ||||||
| Operating margin | (3.4) | 7.4 | (10.8) pp 8) | (0.8) | 2.9 | (3.7) pp | ||||||||||||
| Adjusted EBITDA (2) | 719 | 909 | (190) | 1,342 | 1,296 | 46 | ||||||||||||
| Adjusted EBITDA margin (2) (%) | 11.5 | 16.1 | (4.6) pp | 11.1 | 12.0 | (0.9) pp | ||||||||||||
| Income (loss) before income taxes | (316) | 103 | (419) | (193) | (64) | (129) | ||||||||||||
| Net income (loss) | (178) | 186 | (364) | (130) | 84 | (214) | ||||||||||||
| Adjusted pre-tax income (2) | 77 | 300 | (223) | 95 | 85 | 10 | ||||||||||||
| Adjusted net income (2) | 114 | 207 | (93) | 98 | 57 | 41 | ||||||||||||
| Total liquidity (3) | 8,910 | 8,364 | 546 | 8,910 | 8,364 | 546 | ||||||||||||
| Net cash flows from operating activities | 651 | 895 | (244) | 2,449 | 2,421 | 28 | ||||||||||||
| Free cash flow (2) | 174 | 183 | (9) | 1,778 | 1,014 | 764 | ||||||||||||
| Net debt (2) | 5,270 | 4,757 | 513 | 5,270 | 4,757 | 513 | ||||||||||||
| Long-term debt and lease liabilities | 12,794 | 11,794 | 1,000 | 12,794 | 11,794 | 1,000 | ||||||||||||
| Diluted earnings (loss) per share | (0.63) | 0.51 | (1.14) | (0.45) | 0.10 | (0.55) | ||||||||||||
| Adjusted earnings per share - diluted (2) | 0.40 | 0.60 | (0.20) | 0.34 | 0.16 | 0.18 | ||||||||||||
| Operating Statistics (4) | 2026 | 2025 | Change % | 2026 | 2025 | Change % | ||||||||||||
| Revenue passenger miles (RPMs) (millions) | 23,597 | 22,796 | 3.4 | 44,970 | 42,683 | 5.4 | ||||||||||||
| Available seat miles (ASMs) (millions) | 26,942 | 26,860 | 0.3 | 51,771 | 51,100 | 1.3 | ||||||||||||
| Passenger load factor % | 87.5% | 84.9% | 2.6 pp | 86.9% | 83.5% | 3.3 pp | ||||||||||||
| Passenger revenue per RPM (Yield) (cents) | 23.7 | 22.1 | 7.2 | 23.1 | 21.9 | 5.1 | ||||||||||||
| Passenger revenue per ASM (PRASM) (cents) | 20.7 | 18.7 | 10.5 | 20.0 | 18.3 | 9.3 | ||||||||||||
| Operating revenue per ASM (TRASM) (cents) | 23.3 | 21.0 | 10.9 | 23.3 | 21.2 | 9.9 | ||||||||||||
| Operating expense per ASM (CASM) (cents) | 24.1 | 19.4 | 24.3 | 23.5 | 20.6 | 14.0 | ||||||||||||
| Adjusted CASM (cents) (2) | 15.5 | 14.4 | 7.4 | 15.8 | 14.8 | 6.5 | ||||||||||||
| Average number of full-time-equivalent (FTE) employees (thousands) (5) | 37.0 | 37.3 | (0.8) | 36.5 | 37.2 | (2.1) | ||||||||||||
| Aircraft in operating fleet at period-end | 357 | 364 | (1.9) | 357 | 364 | (1.9) | ||||||||||||
| Seats dispatched (thousands) | 14,644 | 14,478 | 1.2 | 28,049 | 27,817 | 0.8 | ||||||||||||
| Aircraft frequencies (thousands) | 100.3 | 98.5 | 1.8 | 192.4 | 189.9 | 1.3 | ||||||||||||
| Average stage length (miles) (6) | 1,840 | 1,855 | (0.8) | 1,846 | 1,837 | 0.5 | ||||||||||||
| Fuel cost per litre (cents) | 132.7 | 88.0 | 50.8 | 115.7 | 92.9 | 24.5 | ||||||||||||
| Fuel litres (thousands) | 1,273,971 | 1,271,963 | 0.2 | 2,479,145 | 2,463,407 | 0.6 | ||||||||||||
| Revenue passengers carried (thousands) (7) | 12,032 | 11,551 | 4.2 | 22,992 | 21,934 | 4.8 | ||||||||||||
| (1) | Operating margin is a supplementary financial measure and is defined as operating income (loss) as a percentage of operating revenues. |
| (2) | Adjusted EBITDA (earnings before interest, taxes, depreciation, amortization and impairment), adjusted EBITDA margin, adjusted pre-tax income (loss), adjusted net income (loss), free cash flow, net debt, adjusted earnings (loss) per share, and adjusted CASM are non-GAAP financial measures, capital management measures, non-GAAP ratios or supplementary financial measures. Such measures are not recognized measures for financial statement presentation under GAAP, do not have standardized meanings, may not be comparable to similar measures presented by other entities and should not be considered a substitute for or superior to GAAP results. Refer to section "Non-GAAP Financial Measures" of this release for descriptions of Air Canada's non-GAAP financial measures and for a quantitative reconciliation of Air Canada's non-GAAP financial measures to the most comparable GAAP measure. |
| (3) | Total liquidity refers to the sum of cash, cash equivalents, short- and long-term investments and the amounts available under Air Canada's credit facilities. Total liquidity, as at June 30, 2026, of $8,910 million, consisted of $7,524 million in cash, cash equivalents and short- and long- term investments and $1,386 million available under undrawn credit facilities. As at June 30, 2025, total liquidity of $8,364 million consisted of $7,037 million in cash, cash equivalents, short- and long-term investments and $1,327 million available under undrawn credit facilities. These amounts also include funds ($188 million as at June 30, 2026 and $168 million as at June 30, 2025) held in trust by Air Canada Vacations in accordance with regulatory requirements governing advance sales for tour operators. |
| (4) | Except for the reference to average number of full-time equivalent (FTE) employees, operating statistics in this table include third-party carriers operating under capacity purchase agreements with Air Canada. |
| (5) | Reflects FTE employees at Air Canada and its subsidiaries. Excludes FTE employees at third-party carriers operating under capacity purchase agreements with Air Canada. |
| (6) | Average stage length is calculated by dividing the total number of available seat miles by the total number of seats dispatched. |
| (7) | Revenue passengers are counted on a flight number basis (rather than by journey/itinerary or by leg), which is consistent with the IATA definition of revenue passengers carried. |
| (8) | The acronym "pp" is a measure of the arithmetic / absolute difference between two percentages. |
A photo accompanying this announcement is available at https://www.globenewswire.com/NewsRoom/AttachmentNg/7fe544e2-3fb8-4ce3-9a4c-da4784186a25

