

Olvi plc Half-year report 14 August 2026 at 9:00 am
Olvi Group's half-year report January-June 2026: net sales and operating result increased in the second quarter, with sales volume growth supported by acquisitions
April-June 2026
- Sales volume increased by 4.2% and amounted to 300.6 (288.3) million litres.
- Net sales increased by 15.0% and were EUR 224.4 (195.1) million, supported by volume, improved product portfolio and average price.
- The operating result increased by 21.0% to EUR 31.8 (26.3) million.
January-June 2026
- Sales volume increased by 3.8% and amounted to 505.9 (487.,5) million litres.
- Net sales increased by 13.5 % and were EUR 372.4 (327.9) million, driven by the strong development of sales in the second quarter.
- The operating result increased by 9.6% to EUR 42.5 (38.7) million. The development of profitability was supported by price and product portfolio optimisation.
- The equity ratio was 46.8% (55.1%).
Near-term outlook for 2026 (updated)
Olvi Group's operating result for the 2026 financial year is expected to be EUR 84-90 million. Earlier, the operating result was expected to be EUR 84-92 million. The estimated operating result has been updated based on the actual results of the first half of the year.
The Group's key ratios
4-6/ 2026 | 4-6/ 2025 | Change, % | 1-6/ 2026 | 1-6/ 2025 | Change, % | 1-12/ 2025 | |
Sales volume, Mltr | 300.6 | 288.3 | 4.2 | 505.9 | 487.5 | 3.8 | 970.1 |
Net sales, MEUR | 224.4 | 195.1 | 15.0 | 372.4 | 327.9 | 13.5 | 665.3 |
Gross profit, MEUR | 94.2 | 80.0 | 17.8 | 156.7 | 134.3 | 16.7 | 277.3 |
% of net sales | 42.0 | 41.0 | 42.1 | 40.9 | 41.7 | ||
Operating result, MEUR | 31.8 | 26.3 | 21.0 | 42.5 | 38.7 | 9.6 | 81.8 |
% of net sales | 14.2 | 13.5 | 11.4 | 11.8 | 12.3 | ||
Profit for the period, MEUR | 23.2 | 17.5 | 33.2 | 29.1 | 27.2 | 7.0 | 64.8 |
% of net sales | 10.4 | 8.9 | 7.8 | 8.3 | 9.7 | ||
Earnings per share, EUR | 1.11 | 0.83 | 33.6 | 1.39 | 1.30 | 7.2 | 3.09 |
Investments, MEUR | 12.6 | 9.9 | 27.3 | 24.8 | 20.8 | 18.9 | 51.8 |
Equity per share, EUR | 17.80 | 15.77 | 12.9 | 17.73 | |||
Equity ratio, % | 46.8 | 55.1 | 60.8 | ||||
Gearing, % | 16.9 | -5.1 | -3.7 | ||||
Return on investment, % (ROCE) | 17.2 | 22.1 | 19.9 |
The acquisitions completed during the review period have been consolidated into the Baltic Sea segment as of the beginning of January 2026, with the segment's name changed to Rest of Europe.
CEO's review (Patrik Lundell)
Business driven by investments in growth, sales and marketing
As a whole, the first half of 2026 was good for Olvi. Net sales and operating result increased, and earnings performance strengthened in the second quarter. Successful launches of new products, price and product portfolio optimisation, and improved profitability especially in the Baltic countries and Belarus supported the development. Market shares have remained at a good level in tight price competition and the increased cost pressures resulting from the war in Iran have been kept under control. We have also invested in strengthening our brands' market positions, increased our local selection and expanded into new markets. All of the measures taken have strengthened consumer demand, maintained stable customer relationships and laid the foundation for profitable growth. The loss incurred by the Danish business weighed on profitability. Development initiatives in Denmark are under way, with the aim of increasing production capacity utilisation and strengthening the company's commercial position.
The acquisitions aiming for growth announced last year have now all been completed. Most recently, the acquisition of Värska Originaal in Estonia was confirmed, which will significantly increase the share of non-alcoholic products in Olvi's portfolio. The consolidation of Värska's business began in July. Previously confirmed new businesses in Latvia, Norway, Sweden, Bosnia and Herzegovina and Serbia have already increased the Group's sales volume. The integration work is progressing as planned and is expected to last for the duration of this year. The integrations will result in non-recurring costs for 2026 as well as additional depreciation from the allocation of the acquisition price. The most significant synergy benefits are expected to be realised from 2027 onwards. Rapid successes in expanding business operations have already been achieved in Sweden, for example, with the launch of Sandels beer. We expect that following the integration of the businesses and the realisation of synergies, they will contribute to an increasingly significant part of the business of our Group. We see opportunities for growth in several product categories in new geographical markets in particular.
Our investments in our own and our partners' brands and the increase in production capacity will strengthen our position in the tough competition. Business development measures for digital and commercial competence, new consumer-oriented products, clear commercial priorities and committed employees lay a solid foundation for the rest of the year. These measures ensure that we are prepared to respond to rapidly changing market conditions, but also to develop our operations in the long term in line with our strategy.
We are actively monitoring the impact of the war in Iran on the prices of packaging materials, raw materials and transport costs as well as consumer demand. We will take the necessary measures to ensure profitability and the availability of materials. In order to improve profitability, we will continue to work on optimising prices and the product portfolio and improving the efficiency of our operations.
Our vision is to be the most wanted multi-local beverage house. In 2026, we will continue to systematically implement our strategy, both at Group level and locally, guided by our values and through strong partnerships - positively and together.
Financial development
April-June 2026
The sales volume increased by 4.2% in the second quarter, totalling 300.6 (288.3) million litres. The sales volume increased in all reporting segments. Of the sales channels, the hotel and restaurant channel (HoReCa) and exports grew the most. Retail sales also increased as a whole, taking into account the impact of the decline in sales in Denmark. The previous year's figures included a significant share of private label production in Denmark. Excluding Denmark, the Group's second-quarter sales volume grew by 8.4%. Of the product categories, mild alcoholic beverages grew the most, with the emphasis on beer and mixed drinks. The sales volume increased by 4.7% year-on-year due to new businesses consolidated following acquisitions.
Net sales increased to EUR 224.4 (195.1) million. The average sales price per litre increased through the optimisation of our product portfolio's prices and range. The operating result increased by 21.0% to EUR 31.8 (26.3) million. The Rest of Europe and Belarus reporting segments accounted for most of the growth. Measured by gross profit, profitability improved both in euros and relative to net sales, covering growing fixed expenses and improving the operating result. Costs were again under upward pressure, particularly due to the war in Iran.
January-June 2026
Sales volume increased by 3.8% and amounted to 505.9 (487.5) million litres. The development of the sales volume improved in the second quarter. Launches of new products and strong local brands supported the growth in sales and keeping market shares at a good level. In many markets, the market for alcoholic beverages continues to decline, while the market for non-alcoholic beverages continues to grow. The sales volume increased by 4.4% year-on-year following acquisitions. Excluding Denmark, the sales volume grew by 8.1%. Net sales grew by 13.5% following new acquisitions and an increase in the average price to EUR 372.4 (327.9) million.
The operating result increased by 9.6% from the comparison period and was EUR 42.5 (38.7) million. Profitability improved in Belarus in particular, thanks to a more optimum product portfolio. In the Rest of Europe segment, the profitability of the Baltic countries improved significantly year-on-year, while the loss-making operations in Denmark significantly decrease the operating result for the segment. Finland's operating result remained at the previous year's level. The integration of new subsidiaries has gone according to plan, but take-over and business development costs, among other things, are burdening profitability in 2026. Previous acquisitions have been generating net sales since January, but the acquisition of Värska Originaal in June only from the beginning of July.
Segment-specific business development: January-June 2026
Finland: growth in sales volume from own brands
The sales volume of business operations in Finland increased by 4.4% to 132.3 (126.8) million litres and net sales increased by 4.7% to EUR 122.2 (116.7) million. With regard to the product categories, sales of both alcoholic and non-alcoholic products have increased, with an emphasis on own brands. Of the products, sales of hard seltzers in particular continued to grow strongly, and the new Juju soft drink brand has been well received in the market, significantly increasing sales of Olvi's own soft drink brands compared to the previous year. Sales growth focused on retail trade, while in the HoReCa segment, consumers' modest purchasing behaviour continued to be reflected in a slight decline in sales. Exports were supported by the successful start of the sales of Sandels beer in Sweden, taking place through the new subsidiary Brewery International. Olvi's market shares remained strong and also growth was achieved in many product categories. The warehouse investment in Iisalmi will significantly improve delivery accuracy, especially in the summer season.
The operating result of the Finnish business operations was EUR 14.3 (14.2) million. The operating result remained at the previous year's level. The strengthened product portfolio has maintained profitability as costs have been rising. Increased price competition, the focus of sales growth being on retail trade, the impact of the war in Iran on cost inflation, particularly in freight and packaging materials, limited opportunities for price increases and investments in the marketing of own brands have weakened the development of profitability. Measures to improve profitability, such as developing the product portfolio and strengthening cost efficiency to increase the gross profit, have helped to cover the rising costs, and they will be continued further.
Rest of Europe: Profitability improved in the Baltic countries, challenges continue in Denmark and integration of new companies is progressing
The Rest of Europe segment's sales volume increased by 1.0% to 187.1 (185.2) million litres. The sales volume was increased by new businesses. Organic sales volume, i.e. sales volume excluding the new businesses, decreased by 10.6%. Taking into account the impact of Denmark, the organic sales volume remained at the previous year's level. New businesses in Latvia, Norway, Sweden, Bosnia and Herzegovina and Serbia increased the segment's sales volume by 11.7% year-on-year, already accounting for a relatively significant share of the entire Group's sales volumes. Market shares have mainly remained at the previous year's level.
The segment's net sales increased by 16.4% to EUR 154.1 (132.5) million. Organic net sales declined by 2.8%, while excluding Denmark, organic net sales increased by 2.5%. New businesses increased the segment's net sales by 19.2%. The average price was increased by product portfolio optimisation measures in several markets and the higher price point of the brands represented in Sweden and Norway.
The Rest of Europe segment's operating result decreased by 10.0% to EUR 7.4 (8.3) million. The decline was mainly due to Denmark, where the operating result is at a loss due to the low sales volume. The low capacity utilisation rate and the costs associated with the ongoing development programme increased the operating loss. To improve profitability, efforts are focused on securing additional production volume and adapting operations to the changed volume level. On the other hand, profitability has been significantly improved in the Baltic countries through measures such as price and product portfolio optimisation and adapting operations to changed market conditions. The impact of new businesses on the segment's operating result was already clearly positive in the second quarter. Takeovers and integrations will result in non-recurring costs for 2026. The synergies will begin to materialise mainly in 2027.
Belarus: Net sales and operating result improved
The sales volume increased by 6.7% to 189.7 (177.7) million litres. Sales volumes increased the most year-on-year in non-alcoholic product categories, such as water and soft drinks, in line with the strategic targets. Beer sales also grew, supported by new launches. Of the sales channels, there was growth in retail trade and HoReCa. The stable exchange rate, growing consumer purchasing power and market growth, especially in non-alcoholic product categories, have supported the development of the sales volume.
Net sales increased by 22.3% to EUR 98.6 (80.6) million. In the local currency, net sales grew by 17.6%. The growth in net sales was supported by price and product portfolio optimisation measures in beer and soft drinks in particular, successful launches of new products and improved delivery accuracy. The operating result increased by 31.3% to EUR 21.8 (16.5) million. In the local currency, the operating result grew by 26.0%. The improvement in profitability was supported by the increased gross profit due to the improvement in the average price.
The Belarusian business is reported as part of Olvi Group, but it operates by means of its own cash flow financing. There are temporary restrictions on the distribution of profits to the parent company, described under "Business risks and their management".
Sales development
Olvi Group's sales volume increased by 3.8% in January-June, totalling 505.9 (487.5) million litres. The organic sales volume remained at the previous year's level at 486.0 million litres.
Sales volume, million litres | 4-6/ 2026 | 4-6/ 2025 | Change, % | 1-6/ 2026 | 1-6/ 2025 | Change, % |
Finland | 76.3 | 72.2 | 5.8 | 132.3 | 126.8 | 4.4 |
Rest of Europe *) | 113.1 | 110.1 | 2.7 | 187.1 | 185.2 | 1.0 |
Belarus | 113.3 | 107.3 | 5.6 | 189.7 | 177.7 | 6.7 |
Eliminations | -2.1 | -1.3 | -3.2 | -2.2 | ||
Total | 300.6 | 288.3 | 4.2 | 505.9 | 487.5 | 3.8 |
*) For the comparison period, the Rest of Europe segment does not include the new companies acquired during 2026.
The Group's net sales in January-June increased by 13.5% to EUR 372.4 (327.9) million. The Group's organic net sales increased by 5.8% to EUR 346.9 million.
Net sales, EUR million | 4-6/ 2026 | 4-6/ 2025 | Change, % | 1-6/ 2026 | 1-6/ 2025 | Change, % |
Finland | 70.6 | 66.8 | 5.6 | 122.2 | 116.7 | 4.7 |
Rest of Europe *) | 95.7 | 81.2 | 17.9 | 154.1 | 132.5 | 16.4 |
Belarus | 59.8 | 48.2 | 24.1 | 98.6 | 80.6 | 22.3 |
Eliminations | -1.7 | -1.1 | -2.5 | -1.9 | ||
Total | 224.4 | 195.1 | 15.0 | 372.4 | 327.9 | 13.5 |
*) For the comparison period, the Rest of Europe segment does not include the new companies acquired during 2026.
Financial performance
The Group's operating result in April-June was EUR 31.8 (26.3) million, or 14.2% (13.5%) of net sales. Profitability improved in the Belarus segment in particular. The second-quarter operating result does not include items affecting comparability.
The January-June operating result increased by 9.6% to EUR 42.5 (38.7) million. The operating result improved in Belarus, remained at the previous year's level in Finland and weakened in the Rest of Europe segment due to an increase in losses resulting from the decline in the sales volume in Denmark. The Group's organic operating result increased by 10.3% to EUR 42.7 million.
Operating result, EUR million | 4-6/ 2026 | 4-6/ 2025 | Change, % | 1-6/ 2026 | 1-6/ 2025 | Change, % |
Finland | 10.1 | 10.0 | 1.0 | 14.3 | 14.2 | 0.9 |
Rest of Europe *) | 7.3 | 6.6 | 10.7 | 7.4 | 8.3 | -10.0 |
Belarus | 14.6 | 9.8 | 48.6 | 21.8 | 16.5 | 31.3 |
Eliminations **) | -0.2 | -0.1 | -1.0 | -0.3 | ||
Total | 31.8 | 26.3 | 21.0 | 42.5 | 38.7 | 9.6 |
*) For the comparison period, the Rest of Europe segment does not include the new companies acquired in 2026.
**) Additional depreciation of EUR 1.0 million resulting from the allocation of the acquisition costs of confirmed acquisitions is included in the eliminations.
The Group's profit after taxes in January-June was EUR 29.1 (27.2) million.
In January-June, earnings per share calculated from the profit belonging to parent company shareholders were
EUR 1.39 (1.30).
Financial position and the balance sheet
On 30 June 2026, Olvi Group's balance sheet total was EUR 791.2 (595.4) million. The increase in the balance sheet mainly resulted from corporate acquisitions and an increase in non-current assets following investments. Equity per share was EUR 17.80 (15.77). The equity ratio was 46.8% (55.1%), and gearing was 16.9% (-5.1%). The Group's liquidity indicator, the current ratio, was 1.1 (1.3). The return on capital employed (ROCE) was 17.2% (22.1%). The change is mainly due to an increase in interest-bearing liabilities. Interest-bearing liabilities amounted to EUR 125.8 (24.2) million at the end of June. The long-term green loan for financing the brew house investment amounted to EUR 19.3 million, and EUR 30.0 million of long-term loan was withdrawn to finance acquisitions. In addition, Olvi had short-term financing of EUR 56.5 million in use. Of the interest-bearing liabilities, current liabilities accounted for EUR 63.4 (4.0) million.
Olvi Group's balance sheet and financial position are good. Cash and cash equivalents stood at EUR 63.1 (40.9) million at the end of the review period. The Group aims to secure the availability and flexibility of funding with an account overdraft facility, a commercial paper programme and credit limits. Cash flow from operating activities amounted to EUR 30.0 (12.8) million and improved mainly due to a reduction in working capital. Cash flow from investing activities was EUR -94.0 (-22.4) million, and cash flow from financing activities was EUR 69.8 (-1.0) million. Cash flow from financing activities is improved by the use of long-term and short-term financial instruments.
Investments
In January-June, Olvi Group's extension and replacement investments were EUR 24.8 (20.8) million. Of the investments, EUR 10.4 million was related to Finland, and EUR 12.7 million to subsidiaries in the Rest of Europe segment. The brew house investment at the Iisalmi plant was completed on schedule and on budget in March. In addition, the completion of the warehouse investment with regard to in-house logistics was continued. For the Rest of Europe segment, construction of a new warehouse began in Lithuania, which is the largest individual investment of the segment in 2026. In addition, investments were made in the procurement of sales equipment such as refrigeration equipment and the improvement of production conditions. Replacement investments necessary for the continuity of production were made in Belarus through the subsidiary's own cash flow financing.
In its investments, Olvi Group focuses on environmental friendliness, cost-effective operations and capacity development to meet business requirements.
Seasonal nature of operations
The nature of the Group's business operations involves seasonal fluctuation. The net sales and operating result of the geographical reporting segments are not accumulated steadily. Instead, they fluctuate in accordance with the special characteristics of the seasons of the year and product seasons.
Personnel
Olvi Group's average number of personnel in January-June was 2,881 (2,499) employees. Growth was 15.3% year-on-year. The growth was attributable to acquisitions in the Rest of Europe segment.
Olvi Group's average number of personnel by segment:
4-6/ 2026 | 4-6/ 2025 | Change, % | 1-6/ 2026 | 1-6/ 2025 | Change, % | |
Finland | 518 | 501 | 3.4 | 484 | 463 | 4.5 |
Rest of Europe *) | 1,441 | 1,122 | 28.4 | 1,409 | 1,085 | 29.9 |
Belarus | 1,001 | 968 | 3.4 | 988 | 951 | 3.9 |
Total | 2,960 | 2,591 | 14.2 | 2,881 | 2,499 | 15.3 |
*) For the comparison period, the Rest of Europe segment does not include the new companies acquired during 2026, and the figures for 2026 do not yet include the head count of Värska Originaal.
Sustainability
Environmental sustainability
The long-term reduction target for total emissions is to achieve carbon neutrality in Olvi Group's own operations (Scopes 1 and 2) in 2030. In terms of the value chain (Scope 3), the target is to reduce emissions by 40% compared to 2021 and achieve carbon neutrality in the value chain in 2040.
Emissions from Olvi Group's own operations (Scopes 1 and 2) increased to 17,667 (12,401) tCO2e in the first half of the year, while emission intensity increased by 0.035 (0.024) CO2e per litre produced. Correspondingly, the share of renewable energy in the first half of the year fell to 65.5% (70.9%) of electric energy and to 38.1% (42.7%) of heat and steam energy. The increase in emissions, emissions intensity and non-renewable electricity and energy grew mainly due to the new companies that do not yet use renewable energy. The impact is clear, as the share of renewable energy had already reached a considerable level as a result of prior measures. Olvi Group aims to use only renewable energy and electricity in its own operations in 2030.
The monitoring of water use in Olvi Group's own operations has been further developed, and measures reducing water consumption have been carried out during the winter, but due to the new consolidated companies, Olvi Group's water consumption increased to 2.82 (2.65) litres per litre of finished product. Olvi Group aims to reduce its water use to 2.5 litres per litre of finished product by 2030. We will continue to assess the impacts of water use in the value chain, especially in relation to the production of raw materials and packaging.
The environmental sustainability ratios for 2026 include the new companies acquired during the year, with the exception of Värska Originaal, which will be consolidated into the Group ratios as of 1 July 2026. The ratios for the comparison year 2025 do not include the new companies.
Social sustainability
During the first half of the year, we continued to update and supplement our human rights evaluations. The work will result in a deeper understanding of the potential human rights impacts and risks of Olvi Group and its value chain. The development work will continue in the value chain on a risk basis with focus on the risk assessment of wines and logistics.
Efforts to develop occupational health and well-being continued. Company-specific development plans were drawn up based on the results of the People Power survey conducted in early 2026, and these plans are being implemented. The work to further develop our safety at work culture is also underway. The number of occupational accidents in the first half of the year was 10 (10). One of the accidents was classified as serious based on an absence of more than 30 days. Olvi Group's permanent target is zero serious accidents.
The development of product-related data will continue in order to develop the sustainability of the product portfolio. The sales of non-alcoholic products declined during the first half of the year, and the non-alcoholic product category accounts for 41.8% (44.8%) of the product portfolio. The change is largely due to the new companies' product portfolios.
The social sustainability ratios for 2026 include the new companies acquired during the year, with the exception of Värska Originaal, which will be consolidated into the Group ratios as of 1 July 2026. The ratios for the comparison year 2025 do not include the new companies.
Good governance
Olvi Group has continued to monitor and prepare for changes in the EU's sustainability-related legislation. The Finnish Accounting Act and the Auditing Act have been amended to take into account the changes in sustainability regulations as a result of the Omnibus package. At the same time, the revision of the ESRS standards has been monitored and the impacts of the changes on the company's reporting practices have been assessed. The current ESRS requirements have still been applied in reporting, as the updated ESRS standards are still under review by the European Parliament and the Council before their possible adoption and entry into force in the EU.
Preparations are also continuing for the obligations of the Packaging and Packaging Waste Regulation (PPWR), the Green Transition Consumer Protection Directive (ECGT), the Deforestation Regulation and the Forced Labour Regulation. The application of the PPWR began on 12 August 2026 and the application of the ECGT will begin on 27 September 2026, when the new prohibitions and information requirements for environmental claims will enter into force. The Deforestation Regulation will be applied from 30 December 2026. Preparations for the application of the EU Forced Labour Regulation have continued both in the EU and nationally. The Regulation will apply from 14 December 2027.
In line with the annual targets, the commitment of partners to the Code of Conduct has been continued, as has the Code of Conduct training and commitment of personnel.
Board of Directors and management
The Board of Directors of Olvi plc comprises Nora Hortling (Chair), Lasse Heinonen (Vice Chair), and the members Tarmo Noop, Juho Nummela, Pekka Tiainen and Anette Vaini-Antila. KPMG Oy Ab, an Authorised Public Accounting firm, was elected as the company's auditor, with Heidi Hyry, Authorised Public Accountant, as the principal auditor. KPMG Oy Ab also assures the company's sustainability statement, with Heidi Hyry, APA and Authorised Sustainability Auditor (KRT), as the principal sustainability auditor.
During the review period, Olvi plc's Board of Directors appointed Juha Kauppinen as CFO and member of the Group Leadership Team. He will take on the position of CFO during the third quarter.
Other events during the review period
Annual General Meeting
Olvi plc's Annual General Meeting (AGM) on 1 April 2026 adopted the financial statements and discharged the members of the Board and the CEO from liability for the financial year that ended on 31 December 2025.
In accordance with the Board's proposal, the AGM decided to pay a dividend of EUR 1.35 (1.30) for Series A and Series K shares for the 2025 financial year. The dividend is 43.7% (43.6%) of Olvi Group's earnings per share. The dividend shall be paid in two instalments. The first instalment of EUR 0.67 per share was paid on 30 April 2026, and the second instalment of EUR 0.68 will be paid on 30 September 2026. The AGM's decisions were published in a stock exchange release on 1 April 2026.
Changes in the Group structure
In June, Olvi completed the acquisition agreed last year, in which its Estonian subsidiary A. Le Coq acquired 100% of the shares in Värska Originaal. The transaction was completed on 19 June 2026. With regard to the consolidated balance sheet, consolidation was carried out in June and the consolidation of business operations will be carried out from the beginning of July.
During the second quarter, Olvi carried out a restructuring of the internal group structure in the ownership of Banjalucka Pivara. In connection with this, OAO Lidskoe Pivo became a minority shareholder in the Bosnian brewery through an investment in the company's equity and liabilities.
Share-based payments
The purpose of long-term remuneration is to implement Olvi's strategy and achieve Olvi's targets, increase shareholder value, improve competitiveness, support profitable growth and relative profitability, and engage the company's operational management and key people.
More information on incentive plans and related acquisitions of treasury shares is provided in Table 5, sections 4 and 5 of the half-year report.
Business risks and their management
Geopolitical situation
Geopolitical uncertainty has affected the Group's operating environment. The war in Iran and the associated geopolitical tensions will significantly increase uncertainty in the energy, material and transport markets, which will be reflected in the cost level and the functioning of supply chains in 2026. The impacts are expected to extend into the coming years, especially with regard to packaging materials and freight costs. In addition, the war in Ukraine and tensions in many other regions, together with weather events caused by climate change, affect the prices and availability of raw materials and packaging materials and energy in the markets. The uncertain geopolitical situation may also weaken general economic development and consumer demand.
Olvi is actively monitoring the development of the situation and is prepared for potential impacts through, for example, decentralisation of procurement, contract, hedging and pricing mechanisms, and supply chain risk management tools. Olvi Group is responding to the increase in costs by improving operational productivity and assessing sales prices and selections to maintain profitability.
Consumer behaviour
Historically high consumer prices and the deterioration of the general economic outlook due to geopolitical uncertainty may reduce consumer confidence and purchasing power and affect consumer behaviour. This may increase the shift in consumption to more affordable product options, for example. In addition, overall consumption may decrease, and the premiumisation trend may come to a halt. However, there are differences between markets. Olvi Group is responding to the change by developing its product portfolio in line with consumer demand and by maintaining and strengthening market shares.
Operating environment in Belarus
The business operations and financial forecasting in Belarus continue to involve uncertainty. For example, the uncertainty concerns the development of exchange rates, the unpredictability of the operating environment, local legislation and taxation, trade sanctions, and the functioning of financial transactions with Western countries. Olvi's subsidiary operates independently in Belarus and is responsible for its procurements, among other aspects. In addition, the IT operating environment has been separated. The subsidiary finances its operations with cash flow from its own operations.
The restriction on the payment of dividends by Western-owned companies is valid until the end of 2026. The regulations limit the maximum amount of dividends that can be paid abroad. According to the current interpretation, the dividend that the Belarusian company can legally pay to the parent company is around EUR 1-4 million annually during the validity of the restrictions. According to Olvi Group's management's assessment, the now known temporary restriction on the payment of dividends by the Belarusian subsidiary does not impair the parent company's ability to pay dividends. Restrictions on the sale of shares in Olvi's subsidiary continue to apply. Olvi has no permission to sell shares in its Belarusian subsidiary. We monitor the legislative situation and actively evaluate the prerequisites and options for operating in the market.
Other current risks
Acquisitions offer growth opportunities, but also involve risks in terms of the success of the acquisition and expectations for growth in enterprise value. The risks may relate to, for example, the extent of due diligence and the implementation of business and integration plans. The benefits of acquisitions and the return on investment depend on the success of the integration and the implementation of the business plan. Acquisitions often generate goodwill on the consolidated balance sheet, which is regularly tested against fair value. Goodwill is subject to risks of impairment losses if future cash flows do not support the valuation. Olvi manages the risks related to acquisitions by developing its acquisition processes and allocating resources to the implementation of the processes adequately.
Cybersecurity threats have increased because of the escalation of the global geopolitical situation and technological development, among other reasons. Olvi Group has prepared for increased data security threats in a variety of ways, and the new requirements under the NIS2 cybersecurity directive have been implemented according to schedule. Cybersecurity-related training, guidelines and threat situation training have been increased. Training is arranged annually for the personnel and information on data security risks and how to avoid them is shared. Olvi Group regularly audits its suppliers' data security practices and assesses the related risks.
The EU Packaging and Packaging Waste Regulation was adopted, and it entered into force on 11 February 2025. The regulation will apply from 12 August 2026. The regulation also contains several transitional provisions for the start dates of the various obligations. In the coming years, the European Commission will issue several implementing and delegated acts, as well as guidelines to further specify the requirements and their application. According to the current estimate, the new regulation will increase energy consumption and, consequently, climate emissions of product manufacturing and logistics, as well as water consumption, which will have a direct impact on Olvi Group's chances of achieving the set environmental targets. In addition, the regulation is likely to cause needs to invest in reusable bottles and transport packaging, and in equipment for product filling and handling. The process of implementing the regulation is being monitored closely, and efforts are being made to affect its application guidelines so that the sustainability aspects of Olvi Group's countries of operation are also taken into account.
Sustainability risks are identified through human rights and climate change impact assessments as part of the company's strategic, business, financial and compliance risks.
Preparedness
Olvi Group has prepared several scenarios related to the development of the business environment and is prepared to respond to changing situations. The company is prepared for production disruptions and has drawn up continuity plans related to the availability of labour, raw materials and energy, for example. The company has made investments to secure its energy supply and has also made efforts to ensure the availability of raw materials and packaging materials. Particular attention has been paid to the adequacy of risk management plans in accordance with risk assessments and the introduction of new risk assessment methods in terms of information security and sustainability risks, for example.
A more detailed description of the risks related to business operations is provided in Olvi Group's Board of Directors' report and the notes to the financial statements and on the company website at https://www.olvigroup.fi/en/investors/corporate-governance/corporate-governance/.
Events after the review period
After the review period, Tatiana Ostrovskaya was appointed Managing Director of Banjalucka Pivara, succeeding Ilija Šetka.
OLVI PLC
Board of Directors
Webcast
Olvi plc and its CEO will hold a press conference, which can be followed athttps://olvi.events.inderes.com/q2-2026 from 12:00 noon onwards on the date of publication of the half-year report. The press conference will be held in English.
A recording of the webcast can be viewed later on the company's website at
https://www.olvigroup.fi/en/releases-and-publications/financial-releases/
More information:
Patrik Lundell, CEO, Olvi plc, tel. +358 290 00 1050
Tiina-Liisa Liukkonen, CFO & CIO, Olvi plc, tel. +358 290 00 1050
Communications, communications@olvi.fi
TABLES:
- Consolidated statement of comprehensive income, Table 1
- Consolidated balance sheet, Table 2
- Consolidated statement of changes in equity, Table 3
- Consolidated cash flow statement, Table 4
- Notes to the half-year report, Table 5
DISTRIBUTION:
Nasdaq Helsinki Ltd
Main media
www.olvigroup.fi
OLVI GROUP | TABLE 1 | ||||||||
CONSOLIDATED STATEMENT OF COMPREHENSIVE INCOME | |||||||||
EUR 1,000 | 4-6/2026 | 4-6/2025 | 1-6/2026 | 1-6/2025 | 1-12/2025 | ||||
Gross sales | 461,517 | 396,186 | 774,278 | 673,635 | 1,385,528 | ||||
Excise taxes and other adjustments | -237,088 | -201,059 | -401,912 | -345,696 | -720,253 | ||||
Net sales | 224,429 | 195,127 | 372,366 | 327,939 | 665,275 | ||||
Cost of sales | -130,247 | -115,174 | -215,618 | -193,665 | -388,014 | ||||
Gross profit | 94,182 | 79,953 | 156,748 | 134,274 | 277,261 | ||||
Logistics, sales and marketing expenses | -48,275 | -42,228 | -84,705 | -72,929 | -145,329 | ||||
Administrative expenses | -14,337 | -12,311 | -30,169 | -23,716 | -51,374 | ||||
Other operating income | 328 | 997 | 755 | 1,295 | 1,832 | ||||
Other operating expenses | -75 | -110 | -166 | -182 | -579 | ||||
Operating result | 31,823 | 26,301 | 42,463 | 38,742 | 81,811 | ||||
Financial income | 1,270 | 501 | 1,920 | 1,370 | 2,899 | ||||
Financial expenses | -2,734 | -503 | -3,938 | -863 | -1,914 | ||||
Share of the profit of associated companies and joint ventures | 0 | 0 | 0 | 0 | 55 | ||||
Profit before tax | 30,359 | 26,299 | 40,445 | 39,249 | 82,851 | ||||
Income taxes | -7,115 | -8,844 | -11,332 | -12,042 | -18,027 | ||||
PROFIT FOR THE PERIOD | 23,244 | 17,455 | 29,113 | 27,207 | 64,824 | ||||
Other items of comprehensive income that may be subsequently reclassified as profit or loss: | |||||||||
Translation differences related to foreign subsidiaries | 1,745 | -1,692 | 2,381 | 1,707 | 2,756 | ||||
Change in fair value, other investments | 0 | 0 | 0 | -93 | -93 | ||||
Taxes related to items | 0 | 0 | 0 | 18 | 18 | ||||
TOTAL OTHER COMPREHENSIVE INCOME | 1,745 | -1,692 | 2,381 | 1,632 | 2,681 | ||||
TOTAL COMPREHENSIVE INCOME FOR THE PERIOD | 24,989 | 15,763 | 31,494 | 28,839 | 67,505 | ||||
Distribution of the profit for the period: | |||||||||
- Owners of the parent company | 22,968 | 17,236 | 28,677 | 26,812 | 64,003 | ||||
- Non-controlling interests | 276 | 219 | 436 | 395 | 821 | ||||
Distribution of comprehensive income for the period: | |||||||||
- Owners of the parent company | 24,662 | 15,605 | 30,989 | 28,381 | 66,583 | ||||
- Non-controlling interests | 327 | 158 | 505 | 458 | 922 | ||||
Earnings per share calculated from profit attributable to owners of the parent company, EUR | |||||||||
- Undiluted | 1.11 | 0.83 | 1.39 | 1.30 | 3.09 | ||||
- Diluted | 1.11 | 0.83 | 1.39 | 1.30 | 3.09 | ||||
OLVI GROUP | TABLE 2 | ||||||||
CONSOLIDATED BALANCE SHEET | |||||||||
EUR 1,000 | 30 Jun 2026 | 30 Jun 2025 | 31 Dec 2025 | ||||||
ASSETS | |||||||||
Non-current assets | |||||||||
Intangible assets | 41,339 | 9,139 | 8,186 | ||||||
Goodwill | 56,781 | 22,204 | 22,405 | ||||||
Tangible assets | 311,938 | 245,034 | 263,155 | ||||||
Holdings in associated companies and joint ventures | 983 | 962 | 983 | ||||||
Other investments | 709 | 961 | 682 | ||||||
Loans receivable and other long-term receivables | 8,422 | 6,609 | 7,196 | ||||||
Deferred tax assets | 6,999 | 4,305 | 7,050 | ||||||
Total non-current assets | 427,171 | 289,214 | 309,657 | ||||||
Current assets | |||||||||
Inventories | 101,337 | 95,636 | 77,955 | ||||||
Accounts receivable and other receivables | 198,791 | 168,934 | 162,541 | ||||||
Income tax receivables | 809 | 690 | 1,329 | ||||||
Cash and cash equivalents | 63,130 | 40,885 | 56,292 | ||||||
Total current assets | 364,067 | 306,145 | 298,117 | ||||||
TOTAL ASSETS | 791,238 | 595,359 | 607,774 | ||||||
EQUITY AND LIABILITIES | |||||||||
Equity attributable to owners of the parent company | |||||||||
Share capital | 20,759 | 20,759 | 20,759 | ||||||
Fair value reserve | 220 | 220 | 220 | ||||||
Treasury shares | -2,943 | -642 | -511 | ||||||
Other reserves | 1,092 | 1,092 | 1,092 | ||||||
Translation differences | -53,114 | -56,437 | -55,426 | ||||||
Retained earnings | 401,359 | 361,372 | 400,966 | ||||||
367,373 | 326,364 | 367,100 | |||||||
Non-controlling interests | 2,851 | 1,733 | 2,265 | ||||||
Total equity | 370,224 | 328,097 | 369,365 | ||||||
Non-current liabilities | |||||||||
Financial liabilities | 62,397 | 20,202 | 23,099 | ||||||
Other liabilities | 14,197 | 740 | 848 | ||||||
Deferred tax liabilities | 13,975 | 13,688 | 10,980 | ||||||
Current liabilities | |||||||||
Financial liabilities | 63,427 | 4,024 | 19,524 | ||||||
Accounts payable and other payables | 262,977 | 220,411 | 182,472 | ||||||
Income tax liability | 4,041 | 8,197 | 1,486 | ||||||
Total liabilities | 421,014 | 267,262 | 238,409 | ||||||
TOTAL EQUITY AND LIABILITIES | 791,238 | 595,359 | 607,774 | ||||||
OLVI GROUP | TABLE 3 | |||||||||
CONSOLIDATED STATEMENT OF CHANGES IN EQUITY | ||||||||||
EUR 1,000 | Share capital | Fair value reserve | Reserve for treasury shares | Other reserves | Transla-tion differ-ences | Retained earnings | Owners of the parent company | Non-control-ling interests | Total | |
Equity 1 Jan 2026 | 20,759 | 220 | -511 | 1,092 | -55,426 | 400,966 | 367,100 | 2,265 | 369,365 | |
Comprehensive income: | ||||||||||
Profit for the period | 28,677 | 28,677 | 436 | 229,113 | ||||||
Other items of comprehensive income: | ||||||||||
Translation differences | 2,312 | 2,312 | 69 | 2,381 | ||||||
Total other comprehensive income | 2,312 | 2,312 | 69 | 2,381 | ||||||
Total comprehensive income for the period | 2,312 | 28,677 | 30,989 | 505 | 31,494 | |||||
Business transactions with shareholders: | ||||||||||
Dividend payment | -27,952 | -27,952 | -175 | -28,127 | ||||||
Share-based payments | 543 | 543 | 543 | |||||||
Acquisition of treasury shares | -2,665 | -2,665 | -2,665 | |||||||
Issue of treasury shares to employees | 233 | -393 | -160 | -160 | ||||||
Other changes | -225 | -225 | -1 | -226 | ||||||
Business transactions with shareholders, total | -2,432 | -28,027 | -30,459 | -176 | -30,635 | |||||
Changes in holdings in subsidiaries | ||||||||||
Change in non-controlling interests | -257 | -257 | 257 | 0 | ||||||
Changes in holdings in subsidiaries, total | -257 | -257 | 257 | 0 | ||||||
Equity 30 Jun 2026 | 20,759 | 220 | -2,943 | 1,092 | -53,114 | 401,359 | 367,373 | 2,851 | 370,224 | |
EUR 1,000 | Share capital | Fair value reserve | Reserve for treasury shares | Other reserves | Transla-tion differ-ences | Retained earnings |
| Non-control-ling interests | Total | |
Equity 1 Jan 2025 | 20,759 | 295 | -658 | 1,092 | -58,081 | 360,820 | 324,227 | 1,335 | 325,562 | |
Comprehensive income: | ||||||||||
Profit for the period | 26,812 | 26,812 | 395 | 27,207 | ||||||
Other items of comprehensive income: | ||||||||||
Translation differences | 1,644 | 1,644 | 63 | 1,707 | ||||||
Change in fair value, other | -93 | -93 | -93 | |||||||
Taxes related to items | 18 | 18 | 18 | |||||||
Total other comprehensive income | -75 | 1,644 | 1,569 | 63 | 1,632 | |||||
Total comprehensive income for the period | -75 | 1,644 | 26,812 | 28,381 | 458 | 28,839 | ||||
Business transactions with shareholders: | ||||||||||
Dividend payment | -26,911 | -26,911 | -60 | -26,971 | ||||||
Share-based payments | 751 | 751 | 751 | |||||||
Issue of treasury shares to employees | 16 | 4 | 20 | 20 | ||||||
Other changes | -104 | -104 | -104 | |||||||
Business transactions with shareholders, total | 16 | -26,260 | -26,244 | -60 | -26,304 | |||||
Equity 30 Jun 2025 | 20,759 | 220 | -642 | 1,092 | -56,437 | 361,372 | 326,364 | 1,733 | 328,097 | |
OLVI GROUP | TABLE 4 | ||
CONSOLIDATED CASH FLOW STATEMENT | |||
EUR 1,000 | 1-6/2026 | 1-6/2025 | 1-12/2025 |
Profit for the period | 29,113 | 27,207 | 64,824 |
Adjustments | 27,976 | 24,427 | 44,412 |
Change in net working capital: | |||
Change in accounts receivable and other receivables | -44,761 | -44,895 | -6,175 |
Change in inventories | -12,365 | -19,326 | -488 |
Change in accounts payable and other payables | 39,849 | 29,283 | -1,632 |
Interest paid | -3,032 | -170 | -587 |
Interest received | 951 | 1,017 | 1,967 |
Dividends received | 3 | 5 | 8 |
Taxes paid | -7,689 | -4,792 | -21,533 |
Cash flow from operating activities (A) | 30,045 | 12,756 | 80,796 |
Investments in tangible and intangible assets | -24,567 | -22,397 | -54,331 |
Capital gains on disposal of tangible and intangible assets | 308 | 32 | 393 |
Expenditure on other investments | 0 | -68 | -67 |
Acquired subsidiaries, associated companies and joint ventures | -69,766 | 0 | 7 |
Holdings in associated companies and joint ventures | 0 | 50 | 50 |
Dividends received | 0 | 0 | 34 |
Cash flow from investing activities (B) | -94,025 | -22,383 | -53,914 |
Loan withdrawals | 85,991 | 15,494 | 34,093 |
Repayment of loans | -25,164 | -2,966 | -4,416 |
Acquisition of treasury shares | -2,665 | 0 | 0 |
Dividends paid | -13,848 | -13,538 | -27,000 |
Other cash flows from financing activities | 25,438 | 0 | -25,438 |
Cash flow from financing activities (C) | 69,752 | -1,010 | -22,761 |
Increase (+) / decrease (-) in cash and cash equivalents (A+B+C) | 5,772 | -10,637 | 4,121 |
Cash and cash equivalents 1 Jan | 56,292 | 50,751 | 50,751 |
Impact of exchange rate changes | 1,066 | 771 | 1,420 |
Cash and cash equivalents 30 Jun/31 Dec | 63,130 | 40,885 | 56,292 |
Adjustments to cash flow from operating activities include depreciation and impairment:
1-6/2026 | 1-6/2025 | 1-12/2025 | |
Depreciation and impairment | 16,708 | 13,294 | 26,695 |
OLVI GROUP TABLE 5
NOTES TO THE HALF-YEAR REPORT
The half-year report has been prepared in accordance with IAS 34 Interim Financial Reporting, applying the same accounting principles that were applied to the 2025 financial statements (31 December 2025).
The figures in the half-year report are presented in thousands (1,000) of euros. For presentation, individual figures and totals have been rounded up to full thousands, which causes rounding differences in the totals. Exchange rates obtained from the Central Bank of Belarus have been used as the exchange rate for the Belarusian rouble. The key ratios have been calculated by using accurate euro-denominated figures. The information published in the half-year report has not been audited.
1.SEGMENT INFORMATION | |||||
SEGMENTS' NET SALES AND PROFIT FOR THE PERIOD 1-6/2026 | |||||
EUR 1,000 | Finland | Rest of Europe | Belarus | Eliminations | Group |
INCOME | |||||
External sales | 121,014 | 152,779 | 98,573 | 372,366 | |
Beverage sales | 119,828 | 152,776 | 98,573 | 371,177 | |
Equipment services | 1,186 | 3 | 0 | 1,189 | |
Internal sales | 1,207 | 1,353 | 0 | -2,560 | 0 |
Total net sales | 122,221 | 154,132 | 98,573 | -2,560 | 372,366 |
Total profit for the period | 19,295 | 5,631 | 12,535 | -8,348 | 29,113 |
SEGMENTS' NET SALES AND PROFIT FOR THE PERIOD 1-6/2025 | |||||
EUR 1,000 | Finland | Rest of Europe *) | Belarus | Eliminations | Group |
INCOME | |||||
External sales | 116,206 | 131,122 | 80,611 | 327,939 | |
Beverage sales | 115,077 | 131,122 | 80,611 | 326,810 | |
Equipment services | 1,129 | 0 | 0 | 1,129 | |
Internal sales | 566 | 1,334 | 0 | -1,900 | 0 |
Total net sales | 116,772 | 132,456 | 80,611 | -1,900 | 327,939 |
Total profit for the period | 29,135 | 3,860 | 10,662 | -16,450 | 27,207 |
*) For the comparison period, the Rest of Europe segment does not include the new companies acquired in 2026.
2.RELATED PARTY TRANSACTIONS | ||||||
Management's employee benefits | ||||||
Board members' and the CEO's salaries and other short-term employee benefits | ||||||
EUR 1,000 | 1-6/2026 | 1-6/2025 | 1-12/2025 | |||
CEO | 474 | 430 | 624 | |||
Chair of the Board | 48 | 46 | 94 | |||
Other Board members | 126 | 127 | 251 | |||
Total | 648 | 603 | 969 | |||
3. SHARES AND SHARE CAPITAL | ||||||
30 Jun 2026 | % | |||||
Series A shares, number of shares | 16,989,976 | 82.0 | ||||
Series K shares, number of shares | 3,732,256 | 18.0 | ||||
Total | 20,722,232 | 100.0 | ||||
Total number of votes, Series A shares | 16,989,976 | 18.5 | ||||
Total number of votes, Series K shares | 74,645,120 | 81.5 | ||||
Total number of votes | 91,635,096 | 100.0 | ||||
Votes per Series A share | 1 | |||||
Votes per Series K share | 20 | |||||
The registered share capital totalled EUR 20,759 thousand on 30 June 2026.
In accordance with the decision made by the Annual General Meeting of Olvi plc on 1 April 2026, a dividend of EUR 1.35 per share for 2025 (EUR 1.30 per share for 2024), totalling EUR 28.0 (26.9) million, will be paid on shares in Olvi plc. The dividend shall be paid in two instalments. The first instalment, EUR 0.67 per share, was paid on 30 April 2026. The second instalment, EUR 0.68 per share, will be paid on 30 September 2026. Series K shares and Series A shares provide their holders with equal rights to dividends. The Articles of Association include a redemption clause concerning Series K shares.
4. SHARE-BASED PAYMENTS
During the review period, the Board of Directors of Olvi plc transferred to the company's key employees a total of 2,950 Olvi plc Series A shares held by the company as part of the restricted share plan 2024-2025. In the plan, the target groups could earn Olvi plc's Series A shares based on the continuity of employment. The restricted share plan was announced in a release issued on 19 December 2024. The shares were transferred through a directed bonus issue, and the transfer is based on the share issue authorisation granted to the Board of Directors by Olvi plc's Annual General Meeting on 1 April 2026.
In addition, the Board of Directors of Olvi plc transferred a total of 4,698 Olvi plc Series A shares held by the company to the company's key personnel as part of the performance-based share plan 2023-2025. In the plan, the target group was able to earn Olvi plc's Series A shares based on performance. The performance-based share plan was announced in a bulletin released on 2 March 2023. The shares were transferred through a directed bonus issue, and the transfer is based on the share issue authorisation granted to the Board of Directors by Olvi plc's Annual General Meeting on 1 April 2026.
Performance-based share incentive plans
The table shows performance-based plans that have ended during the review period (e), as well as ongoing (o) plans. From 2023 onwards, the targets and potential rewards of share incentives will be based on the achievement of the targets set for the Group's Finland and Rest of Europe business segments.
Performance period | Earning criteria and weighting (%) | Target group, number of people | Maximum reward, pcs | Actual reward, pcs |
2023-2025 (e) | Operating result (50%), increase in the sales volume of non-alcoholic products (40%), value chain CO2e emissions reduction (10%) | 16 | 10,600 | 4,698 |
2024-2026 (o) | Operating result (50%), growth in net sales from non-alcoholic products (40%), reduction of CO2e emissions from own production (10%) | 37 | 43,150 | |
2025-2027 (o) | Operating result (50%), growth in net sales from non-alcoholic products (40%), Reduction of CO2e emissions from own production (10%) | 36 | 42,702 | |
2026-2028 (o) | Operating result (50%), growth in net sales from non-alcoholic products (40%), Reduction of CO2e emissions from own production (10%) | 39 | 41,440 |
Restricted share incentive plans
Plans that have ended during the review period (e), as well as ongoing (o) plans.
Performance period | Earning criterion | Target group, number of people | Maximum reward, pcs | Actual reward, pcs |
2024-2025 (e) | Employment relationship | 18 | 2,950 | 2,950 |
2024-2026 (o) | Employment relationship | 1 | 300 | |
2025-2026 (o) | Employment relationship | 16 | 2,750 |
The costs related to incentive plans totalled EUR 543.0 thousand in the review period. Olvi Group has no other share or option arrangements in place.
5. TREASURY SHARES
At the beginning of January 2026, Olvi plc held a total of 16,918 Series A shares in the company. At its meeting on 11 February 2026, the Board of Directors of Olvi plc decided to launch a share repurchase programme under the authorisation granted by the Annual General Meeting on 16 April 2025, and to acquire a maximum of 80,000 Series A shares. The repurchase of shares began on 19 February 2026 and ended on 26 March 2026. The shares are purchased for use in financing or completing potential acquisitions or other arrangements, implementing the company's incentive plans, developing the company's capital structure or for other purposes decided by the Board of Directors.
Olvi plc transferred a total of 2,950 of its Series A shares to the key personnel in accordance with the restricted share plan and a total of 4,698 shares in accordance with the performance-based share plan. At the end of the review period, Olvi plc held a total of 87,187 of its own Series A shares as treasury shares. The total purchase price of the treasury shares was EUR 2,942.8 thousand. The treasury shares do not provide the company with voting rights. The Series A shares held by Olvi plc represent 0.42% of all shares in the company and 0.10% of all votes provided by the shares in the company. The treasury shares account for 0.51% of all Series A shares in the company and of the votes provided by all Series A shares in the company.
6. NUMBER OF SHARES OUTSTANDING | |||
1-6/2026 | 1-6/2025 | 1-12/2025 | |
- Average | 20,658,547 | 20,700,808 | 20,703,080 |
- At the end of the period | 20,635,045 | 20,701,018 | 20,705,314 |
7. TRADING IN SERIES A SHARES ON THE NASDAQ HELSINKI | |||
1-6/2026 | 1-6/2025 | 1-12/2025 | |
Trading in Olvi plc Series A shares, number of shares | 1,350,144 | 975,442 | 2,391,988 |
Total value of trading, EUR 1,000 | 44,582 | 32,111 | 75,303 |
Proportion of the trading of the total number of Series A shares, % | 7.9 | 5.7 | 14.1 |
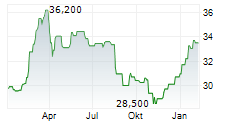
Average share price, EUR | 33.01 | 32.91 | 31.49 |
Closing price, EUR | 32.00 | 33.55 | 31.35 |
Highest price, EUR | 35.50 | 37.20 | 37.20 |
Lowest price, EUR | 30.05 | 28.90 | 28.20 |
8. FOREIGN AND NOMINEE-REGISTERED HOLDINGS 30 Jun 2026 | ||||||
Number of book-entry shares | Number of votes | Shareholders | ||||
number | % | number | % | number | % | |
Finnish, total | 16,490,406 | 79.58 | 87,403,270 | 95.38 | 25,640 | 99.62 |
Foreign, total | 41,250 | 0.20 | 41,250 | 0.05 | 87 | 0.34 |
Nominee-registered (foreign), total | 768,920 | 3.71 | 768,920 | 0.84 | 6 | 0.02 |
Nominee-registered (Finnish), total | 3,421,656 | 16.51 | 3,421,656 | 3.73 | 4 | 0.02 |
Total | 20,722,232 | 100.00 | 91,635,096 | 100.00 | 25,737 | 100.00 |
9. LARGEST SHAREHOLDERS 30 Jun 2026 | ||||||
Series K | Series A | Total | % | Number of votes | % | |
1. Olvi Foundation | 2,363,904 | 990,613 | 3,354,517 | 16.19 | 48,268,693 | 52.67 |
2. The estate of Heikki Hortling* | 903,488 | 103,280 | 1,006,768 | 4.86 | 18,173,040 | 19.83 |
3. Timo Einari Hortling | 212,888 | 49,152 | 262,040 | 1.26 | 4,306,912 | 4.70 |
4. Marit Hortling-Rinne | 149,064 | 14,665 | 163,729 | 0.79 | 2,995,945 | 3.27 |
5. Skandinaviska Enskilda Banken Ab (publ), Helsinki branch, nominee-registered | 472 | 1,872,479 | 1,872,951 | 9.04 | 1,881,919 | 2.05 |
6. Nordea Bank Abp, nominee-registered | 1,482,671 | 1,482,671 | 7.15 | 1,482,671 | 1.62 | |
7. Varma Mutual Pension Insurance Company | 828,075 | 828,075 | 4.00 | 828,075 | 0.90 | |
8. Ilmarinen Mutual Pension Insurance Company | 692,348 | 692,348 | 3.34 | 692,348 | 0.76 | |
9. Citibank Europe plc, nominee-registered | 625,240 | 625,240 | 3.02 | 625,240 | 0.68 | |
10. Pia Johanna Hortling | 23,388 | 29,722 | 53,110 | 0.26 | 497,482 | 0.54 |
Other | 79,052 | 10,301,731 | 10,380,783 | 50.09 | 11,882,771 | 12.98 |
Total | 3,732,256 | 16,989,976 | 20,722,232 | 100.00 | 91,635,096 | 100.00 |
*) The shareholding includes shares held by the shareholder and the entities they control. | ||||||
Olvi did not receive any flagging notifications under chapter 9, section 5 of the Securities Markets Act in January-June 2026.
10. PROPERTY, PLANT AND EQUIPMENT | |||
EUR 1,000 | |||
1-6/2026 | 1-6/2025 | 1-12/2025 | |
Opening balance | 263,155 | 235,669 | 235,669 |
Corporate acquisitions *) | 39,148 | 0 | 0 |
Additions | 24,825 | 20,861 | 52,913 |
Deductions and transfers | -457 | 790 | -636 |
Depreciation and impairment | -15,075 | -12,356 | -24,892 |
Exchange rate differences | 342 | 70 | 101 |
Total | 311,938 | 245,034 | 263,155 |
*) Corporate acquisitions include the companies acquired in January and Värska Originaal acquired in June.
| |||
EUR 1,000 | 30 Jun 2026 | 30 Jun 2025 | 31 Dec 2025 |
Pledged assets and commitments | |||
For own commitments | 2,646 | 2,588 | 2,588 |
Lease and rental liabilities: | |||
Maturing in less than a year | 1,638 | 1,040 | 982 |
Maturing within 1-5 years | 481 | 592 | 374 |
Total lease and rental liabilities | 2,119 | 1,632 | 1,356 |
Other liabilities | 67 | 67 | 67 |
12. VALUATION OF THE BELARUSIAN BUSINESS SEGMENT
For the 2022 financial statements (31 December 2022), the management assessed the book value of the Belarusian business segment in a changed operating environment. An impairment of EUR 35.0 million was recognised on the basis of the assessment. Based on the management's assessment and testing, the balance sheet valuation of the Belarusian business segment on 30 June 2026 is materially at the right level, and there is no need to change the impairment recognised. Accordingly, the written-down fixed assets are not subject to depreciation. The Belarusian business segment's balance sheet value was EUR 80.0 million on 30 June 2026. No changes have been made to the valuation model. During the reporting period, management reassessed certain accounting estimates due to changes in the operating environment and internal restructuring within the Group. The calculation has been refined to take into account the risk associated with Belarus.
13. MERGING BUSINESSES
Valmiermuižas alus
On 2 September 2025, Olvi Group announced the acquisition of Valmiermuižas alus, a Latvian beer and beverage manufacturer. The acquisition has received the approval of the competition authority and was completed on 15 January 2026. As a result of the acquisition, the Group has acquired control over Valmiermuižas alus with a holding of 100 percent. The acquisition supports Olvi's strategic goal of becoming the most wanted multi-local beverage factory, expanding the Group's product selection and opening up further growth opportunities in the restaurant and export markets.
Banjalucka Pivara
On 9 September 2025, Olvi Group announced the acquisition of Banjalucka Pivara, the largest brewery in Bosnia and Herzegovina, which also operates in Serbia. The acquisition has received the approval of the competition authority and was completed on 2 January 2026. As a result of the acquisition, the Group has acquired control of Banjalucka Pivara with a holding of 100 percent. The acquisition supports Olvi's multi-local growth strategy by providing access to strong local brands and production capacity, facilitating growth and expansion in the Balkans. Growth is supported by own production in the vicinity of the Mediterranean Sea, as Olvi is able to serve Mediterranean tourism areas, such as Italy, Croatia, Greece and Montenegro, even better and more flexibly.
Brewery International
On 3 December 2025, Olvi Group announced that it would acquire a 51 percent majority stake in Brewery International, a well-known group of companies specialising in the import and distribution of beverages in Norway and Sweden. The agreement includes an option to acquire the remaining shares later. The transaction was completed on 2 January 2026. In accordance with IFRS, the Brewery International Group has been consolidated 100 percent into the Group. The business group includes Brewery International companies, which focuses on brewery products, and Mission Wine & Spirits companies, which focus on quality wines and spirits. The acquisition supports Olvi Group's strategic growth targets, strengthens its geographical position in the Nordic countries and lays down the foundation for new growth opportunities.
Värska Originaal
Olvi has completed the acquisition agreed last year, in which its Estonian subsidiary A. Le Coq acquired 100 percent of the shares in Värska Originaal. Värska Originaal is Estonia's best-known producer of natural mineral water. The transaction was completed on 19 June 2026. With regard to the consolidated balance sheet, consolidation was carried out in June and the consolidation of business operations will be carried out from the beginning of July.
On 15 September 2025, Olvi announced that it will acquire Värska Originaal through its Estonian subsidiary A. Le Coq. Värska Originaal was founded in 1993 and its operations date back to 1973. The company's production is located in Värska, Southeast Estonia. In addition to natural mineral water, its product portfolio includes flavoured and functional water. The company has approximately 70 employees and had a production volume of 44 million litres in 2025.
The following tables present a summary of the acquisitions and the fair value of the assets acquired and liabilities assumed at the time of acquisition. The balance sheets of the acquired companies have been prepared substantially in accordance with IFRS and the Olvi Group's accounting policies. The acquisitions have been preliminarily recognised in the second quarter.
Acquisition prices | |||
EUR 1,000 | |||
Paid in cash Contingent purchase prices | 74,145 5,371 | ||
Total acquisition prices | 79,516 | ||
Amounts recognised from assets acquired and liabilities assumed (100%) | |||
EUR 1,000 | |||
Tangible assets | 39,160 | ||
Intangible assets | |||
Customer relations Brands | 5,223 27,246 | ||
Intangible assets Other investments Loans receivable and other long-term receivables Deferred tax assets | 1,259 27 1,430 339 | ||
Inventories | 10,341 | ||
Accounts receivable and other receivables Income tax receivables | 11,658 111 | ||
Cash and cash equivalents | 4,568 | ||
Non-current financial liabilities Other non-current liabilities Deferred tax liabilities | 23,660 8,486 3,071 | ||
Current financial liabilities Accounts payable and other payables | 2,890 17,829 | ||
Total identifiable net assets Group's share of net assets | 45,426 45,426 | ||
Goodwill | 34,090 | ||
14. CALCULATION PRINCIPLES FOR KEY RATIOS
In its summary of key ratios (page 1), the Group presents key ratios directly derived from the consolidated income statement (net sales, operating result, profit for the period and their proportions of net sales, as well as earnings per share). (Earnings per share = Profit for the period attributable to owners of the parent company / Average number of shares during the period, adjusted for share issues).
In addition to its IFRS-based consolidated financial statements, Olvi plc presents Alternative Performance Measures that describe the financial performance of its business operations and provide a comparable overview of the company's profitability, solvency and liquidity.
The Group has applied the European Securities and Markets Authority's (ESMA) guidelines (effective since 3 July 2016) on Alternative Performance Measures and has determined such measures as follows:
The Group presents sales volume data in millions of litres as an Alternative Performance Measure that supports net sales. Sales volume is an important and widely used indicator in the industry that describes the scope of operations. To improve comparability between reporting periods, the Group also presents the adjusted operating result and the adjusted profit for the period as Alternative Performance Measures if required. The adjusted operating result is calculated by deducting significant items affecting comparability from operating result. The corresponding items have been deducted from the profit for the period when calculating the adjusted profit for the period.
Investments consist of increases in fixed assets, excluding increases under IFRS 16.
Equity per share = Equity attributable to owners of the parent company / Number of shares at the end of the period, adjusted for share issues.
Equity ratio, % = 100 * (Equity attributable to owners of the parent company + non-controlling interests) / (Balance sheet total).
Gearing, % = 100 * (Interest-bearing liabilities - cash in hand and at bank) / (Equity attributable to owners of the parent company + non-controlling interests).
Return on capital employed, % (ROCE) = 100 * (12-month rolling operating result) / (Equity attributable to owners of the parent company + non-controlling interests + interest-bearing liabilities).
