
BlackRock World Mining Trust Plc - Half-year Financial Report
PR Newswire
LONDON, United Kingdom, September 07
BlackRock World Mining Trust plc
LEI: LNFFPBEUZJBOSR6PW155
Condensed Half Yearly Financial Report for the six months ended 30 June 2026
Performance record
As at 2026 | As at | Change | ||
Net assets (£'000) 1 | 1,696,479 | 1,598,428 | +6.1 | |
Net asset value per ordinary share (NAV) (pence) | 910.23 | 856.23 | +6.3 | |
Ordinary share price (pence) - ex 1st interim dividend | 901.00 | 804.00 | +12.1 | |
Ordinary share price (pence) - cum 1st interim dividend 2 | 906.50 | 804.00 | +12.7 | |
Reference index 3 - net total return | 9,303.57 | 8,885.32 | +4.7 | |
Discount to net asset value 4 | 0.4% | 6.1% | ||
========== | ========== | ========== | ||
Performance (with dividends reinvested) | For the ended 30 June 2026 | For the year ended 31 December 2025 | Since inception to 30 June 2026 | Since inception to 31 December 2025 |
Net asset value per share 5 | +7.2% | +74.2% | +2,267.0% | +2,107.8% |
Ordinary share price 4,5 | +13.7% | +74.1% | +2,435.6% | +2,129.4% |
Reference index 3 | +4.7% | +64.2% | +1,613.0% | +1,536.0% |
========== | ========== | ========== | ========== |
For the | For the | Change | |
Revenue | |||
Net revenue profit after taxation (£'000) | 22,837 | 21,325 | +7.1 |
Revenue return per ordinary share (pence) 6 | 12.24 | 11.26 | +8.7 |
Dividends per ordinary share (pence) | |||
- 1st interim | 5.50 | 5.50 | - |
- 2nd interim | 5.50 | 5.50 | - |
----------------- | ----------------- | ----------------- | |
Total dividends paid and payable | 11.00 | 11.00 | - |
| ========== | ========== | ========== |
1 The change in net assets reflects portfolio movements, dividends paid and the repurchase of ordinary shares into treasury during the period.
2 The share price went ex-dividend for the first quarter interim dividend of 5.50p per share on 18 June 2026; however, this interim dividend is not accounted for in the NAV at 30 June 2026 as a liability in accordance with IFRS until paid.
3 MSCI ACWI Metals & Mining 30% Buffer 10/40 Index (net total return). With effect from 31 December 2019, the reference index changed to the MSCI ACWI Metals & Mining 30% Buffer 10/40 Index (net total return). Prior to 31 December 2019, the reference index was the EMIX Global Mining Index (net total return). The performance returns of the reference index since inception have been blended to reflect this change.
4 Based on cum dividend ordinary share price.
5 Alternative Performance Measures, see Glossary contained within the Half Yearly Financial Report.
6 Further details are given in the Glossary contained within the Half Yearly Financial Report.
Chairman's Statement
Dear Shareholder
Market overview
The first six months of 2026 were dominated by a series of geopolitical events which created significant volatility across global financial markets and commodity sectors. Most notably, the escalation of conflict in the Middle East and the resulting disruption to trade routes through the Strait of Hormuz led to sharp moves in energy prices and heightened uncertainty across equity and commodity markets. These developments had far-reaching implications for inflation expectations, interest rate forecasts, supply chain reliability and investor sentiment.
In this context, mining and commodity markets proved resilient. Industrial commodities generally remained well-supported, driven by continued investment in power infrastructure, electrification, artificial intelligence-related data centre development and broader technology-linked capital expenditure. Commodity producers also benefited from pricing that, on average, remained considerably higher than levels seen during the corresponding period in 2025, supporting profitability and cash generation across much of the sector.
Performance across commodities was mixed. Base metals, particularly copper, continued to benefit from strong structural demand drivers and ongoing supply constraints. Aluminium also experienced a significant supply shock following disruption to Middle Eastern production facilities. In contrast, precious metals gave back some of the exceptional gains achieved during 2025 as investor positioning adjusted to higher inflation expectations and changing interest rate expectations, although recently these have started to regain some of the lost ground.
Against this challenging backdrop, the mining sector continued to demonstrate the importance of mined materials in supporting long-term global economic development.
Performance
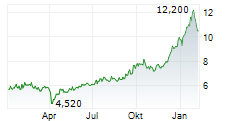
For the six month period ending 30 June 2026, the Company's net asset value per share (NAV) returned +7.2% and the share price returned +13.7%. The Company's reference index, the MSCI ACWI Metals & Mining 30% Buffer 10/40 Index, returned +4.7% (all percentages calculated in Sterling terms with dividends reinvested). The Board is pleased that the Company has continued to generate attractive returns for shareholders despite heightened geopolitical uncertainty and volatile market conditions.
Since the period end and up to the close of business on 3 September 2026, the Company's NAV has increased by 17.6% compared to a rise of 18.3% (on a net return basis) for the reference index (in Sterling terms with dividends reinvested). Further information on the Company's performance and the factors that contributed to, or detracted from, performance during the six months is set out in the Investment Manager's Report.
Revenue return and dividends
Over the six months to 30 June 2026, the Company's revenue return amounted to 12.24p per share, compared with 11.26p per share for the corresponding period in 2025, representing an increase of 8.7%. The higher revenue return reflects the benefit of increased income generated across the portfolio, supported by generally favourable commodity prices and continued diversification of the Company's income streams.
The first quarterly dividend of 5.50p per share was paid on 27 June 2026. Today, the Board is pleased to declare a second quarterly dividend of 5.50p per share, payable on 9 October 2026 to shareholders on the register on 18 September 2026, with the ex-dividend date being 17 September 2026. The Board remains committed to its policy of distributing substantially all of the Company's available income to shareholders.
Looking ahead, while income from individual portfolio holdings may fluctuate with commodity prices and company-specific factors, recent trading updates from many mining companies have demonstrated continued financial discipline and healthy cash generation. The Board therefore remains confident in the Company's ability to continue delivering an attractive level of income to shareholders over time. This confidence is supported by the Company's diversified exposure across commodities, geographies and sources of income, including option-writing activity and royalty interests.
Management of share rating
For the period under review, the Company's ordinary shares traded at an average discount to NAV of 0.9% and were trading at a discount of 2.4% on a cum income basis as at 3 September 2026, the latest practicable date prior to the issue of this report. Over the period ended 30 June 2026, the Company repurchased 304,000 ordinary shares at an average discount of 8.4% for a total consideration of £2,794,000. All shares were bought back at a discount to the prevailing NAV and the buy backs were therefore accretive to existing shareholders. The shares bought back have been placed in treasury for future reissue. During the six month period ended 30 June 2026, no shares were reissued.
Since the period end and up to the date of this report, 530,000 ordinary shares have been reissued at a premium of 1.0% for a total consideration of £4,651,000.
The Directors recognise the importance to investors that the Company's share price does not trade at a significant premium or discount to NAV. Accordingly, the Directors monitor the share price closely and, in the context of wider market conditions, will consider the issuance of shares at a premium or the repurchase at a discount to help balance demand and supply in the market.
Gearing
One of the advantages of the investment trust structure is that the Company can use gearing with the objective of increasing portfolio returns over the longer term. The Company operates a flexible gearing policy which depends on prevailing market conditions. It is not intended that gearing will exceed 25% of the net assets of the Company and its subsidiary. Gearing at 30 June 2026 was 7.6% compared with 4.7% at the beginning of the year. While the Managers remained mindful of the heightened geopolitical uncertainty and volatility arising from the conflict in the Middle East, they continued to identify attractive investment opportunities across the mining sector, particularly where long-term structural demand fundamentals remain compelling. The maximum gearing during the period was 7.6%.
Board composition
As announced on 22 May 2026, Guy Elliott was appointed as a non-executive Director of the Company. Guy brings a wealth of expertise and experience from his career in the global mining industry. He will serve as a member of the Company's Audit and Risk Committee and Management Engagement Committee. We welcome Guy to the Board and further information on his background and experience can be found within the Half Yearly Financial Report.
As previously advised in last year's Annual Report, Judith Mosely, having completed twelve years' service on the Board, retired following the 2026 Annual General Meeting. On behalf of the Board, we thank Judith for her invaluable contribution to the success of the Company during her tenure. We wish her well for the future.
Market outlook
While geopolitical uncertainty remains elevated, the Board believes that the long-term outlook for the mining sector continues to be compelling. Recent events have reinforced the strategic importance of secure commodity supply chains, energy security and domestic resource development, all of which support long-term investment in mining projects and critical minerals.
Demand growth for many commodities continues to be supported by structural themes that remain largely independent of short-term market fluctuations. Investment associated with the digitalisation of the global economy, the build-out of artificial intelligence infrastructure, expansion of electricity networks, renewable energy deployment and increased defence spending is expected to require substantial volumes of metals and minerals over many years. Copper, in particular, remains central to these themes and continues to benefit from favourable supply and demand fundamentals.
At the same time, companies across the sector continue to demonstrate capital discipline and strong cash generation. Although commodity prices are likely to remain sensitive to developments in global growth, monetary policy and geopolitical events, the Board is encouraged by the resilience shown by the sector during the first half of the year.
The Company remains well-positioned to benefit from these long-term themes through its diversified portfolio. The manager continues to identify attractive opportunities across the mining and metals sector and to deliver superior returns to shareholders over the long term.
Charles Goodyear
Chairman
7 September 2026
Investment Manager's Report
The first six months of 2026 (1H26) were marked by major events, some of which had not been seen for many years. The most significant was the sudden and somewhat unexpected outbreak of the war in the Middle East, following President Trump's decision to launch a campaign against Iran. The immediate outcome was massive disruption to global oil and gas markets, as distribution routes via the Strait of Hormuz were closed to seaborne traffic, leaving many countries at risk of an immediate loss of supply. Petroleum product prices soared across gas, fuels and petrochemicals, as well as associated products such as sulphuric acid and fertilisers. In addition, bombing caused disruption to the production and supply of other commodities, including aluminium, with 9% of the global supply sourced from the Persian Gulf.
The impact of these events was quickly priced into other areas, such as foreign exchange, inflation and interest rates, which in turn affected equity pricing. Volatility spiked across many parts of the market and investor uncertainty led to de-risking across the world.
Despite these events, industrial commodity prices remained strong during the period, although they moved down from near-term highs. This appears to have allowed producer companies to enjoy strong margins during the first half and build on the cash generation seen in the prior year. Precious metal companies, however, were not so fortunate, as rising inflation expectations led investors to de-risk gold positions and prices fell from the peaks seen in February 2026.
It is clear that technology-linked capital expenditure plans continue to remain robust, and the long-term theme of this feeding into higher-than-historical commodity demand growth remains a core fundamental for the sector. In addition, other spending plans linked to power supply, storage and generation, as well as a major increase in defence spending, will further add to commodity demand. Companies also remain disciplined on growth-related plans, which should further enhance price outcomes for existing producers.
Over the period the Company's NAV total return was 7.2% and share price total return was 13.7%. This compares to the returns on FTSE 100 Index of 7.6%, UK CPI of 2.6%, US CPI up 2.1% and the reference index (MSCI Metals and Mining Index 30% Buffer Net total return) of 4.7% (all numbers in Sterling terms with dividends reinvested).
Geopolitical rollercoaster
Sadly, the ongoing geopolitical instability from last year continued in 2026, but this time the focus switched from tariffs to conflicts. The USA and Israel launched offensives against Iran, resulting in unprecedented disruption to essential supply routes via the Strait of Hormuz. With approximately 20% of the world's oil needs passing through this narrow channel, the impact on the global economy has been significant.
The USA also made moves in other areas of the world. In Venezuela, an elite group of troops seized President Maduro and his family in a night raid in the country's capital city. The president was immediately moved to the USA, where he awaits prosecution. In addition, the USA has moved to cut off supplies to Cuba, leading to shortages of a number of essential items, such as fuel and energy, and leaving the country in near blackout for much of the time. Lastly, President Trump made a number of claims and comments related to the USA taking control of Greenland from Denmark. This represented an extraordinary sequence of events for just the first six months of 2026.
This uncertainty has not been helpful to financial markets, leading to shifts in pricing for inflation, interest rates, equity multiples, capital spending plans and many other factors. There has been a leadership transition in the UK, with the ousting of Prime Minister Starmer after only two years - the seventh change in the last ten years - as well as new leaders in Colombia and Peru. Elections in Brazil are scheduled for later this year.
Different paths
The first six months saw wide dispersion in commodity price performance, but most commodities had higher average prices in 1H26 compared to 1H25. The big split this year has been between precious and industrial metals, with the latter likely benefiting from ongoing strong demand from companies deploying capital linked to the electrification of the global economy.
In contrast, fears around inflation, its recovery and the impact on rates have seen gold lose momentum, despite hitting new all-time highs in February. The sudden fall in the spot price will likely prove to be short term, as the longer-term issues around the loss of value in paper currencies and ongoing strong demand from central banks create a floor for the price. These longer-term issues have been extremely supportive for the gold prices for over a decade and show no signs of letting up.
Commodity price table
Commodity | 30 June 2026 | % Change | % Change average price |
Gold US$/ounce (oz) | 4,036.1 | -6.7% | 52.6% |
Silver US$/oz | 58.8 | -18.3% | 140.2% |
Platinum US$/oz | 1,567.0 | -22.7% | 102.0% |
Palladium US$/oz | 1,220.0 | -22.1% | 60.0% |
Copper US$/tonne (t) | 13,351.2 | 7.2% | 38.7% |
Nickel US$/t | 16,091.2 | -2.5% | 15.1% |
Aluminium US$/t | 3,070.4 | 3.4% | 33.2% |
Zinc US$/t | 3,574.5 | 16.0% | 22.2% |
Lead US$/t | 1,837.7 | -6.6% | -0.7% |
Tin US$/pound (lb) | 51,180.8 | 25.9% | 56.0% |
Uranium US$/lb | 84.8 | 4.1% | 24.5% |
Iron Ore (China 62% fines) US$/t | 99.0 | -6.3% | 5.5% |
Thermal Coal (Newcastle) US$/t | 129.6 | 21.7% | 23.6% |
Coking Coal US$/t | 243.5 | 11.7% | 27.9% |
Lithium carbonate US$/kilogram | 10.2 | 36.0% | 144.1% |
WTI 1 (Cushing) US$/barrel | 70.6 | 23.2% | 22.7% |
========== | ========== | ========== |
1 West Texas Intermediate.
Source: LSEG Datastream and Bloomberg, June 2026.
Reviewing the table above, it is clear that, with average prices so far above the period from a year ago, companies should be able to capture this and convert it into significant improvements in profitability. However, with spot prices now generally lower than where they started the year, it will take a recovery during the second half to keep this trend intact into the year end.
Another feature in the table above is the jump in oil prices. These have moved around considerably during the period as sentiment on the duration of the Iran War has waxed and waned. Should the current conflict continue deep into the second half this will lead to higher operating costs for many producers and negatively impact margins.
Base metals
While the performance of the base metals was largely driven by macro factors at the end of 2025, we have seen greater dispersion among the base metals during the first half, with idiosyncratic factors driving performance. The copper price reached a new all-time high in May of US$14,109/t, with demand benefiting from the artificial intelligence (AI) data-centre build-out and ongoing supply-side issues. The aluminium market saw its first major supply shock, with the Middle East representing approximately 9% of global supply and a number of assets impacted and damaged. As we approached the end of the first half of the year, we saw base metal prices retreat as the market reassessed the Federal Reserve (Fed) rate path and began to factor in a rate hike, versus previous expectations of a rate cut, this year.
Our favoured base metal, copper, has continued to perform well in 2026, with the market beginning to recognise the broadening structural demand growth story for copper, supported by the energy transition, AI data-centre build-out, grid investment, defence and reshoring demand. Roughly two-thirds of copper demand is linked to the distribution of electricity and thus remains key to rising power demand needs and electrification. A near-term focus for the copper market is the US decision around copper tariffs, which the Government is still considering. This has continued to support imports of "pre-tariffed" copper into the US, with the US Commodity Exchange copper price trading at a premium to the price on the London Metal Exchange.
Last year saw significant impact to copper supply, driven by three key assets. During the first half of 2026, the Grasberg mine downgraded its ramp-up expectations related to the recovery of an incident at the Grasberg Mine, the Kamoa-Kakula mine also reduced expectations around its production recovery, and First Quantum made progress on the restart of its Cobre Panama mine. Supply-side issues continue to plague the copper industry, given the ageing production base and challenges of developing new projects.
The Company's holding in Lundin Mining (1.9% of the portfolio) gained 15%, as it has continued to deliver strong operational performance and, importantly, secured Argentina's Large Investment Incentives Regime (RIGI) approval, which provides fiscal stability for its world-class Vicuna mine project. The team visited the project in February. We also successfully generated performance through a range of smaller, developing copper companies where we see material re-rating and growth opportunities. These include Develop Global (1.6% of the portfolio), which was up +44% following the successful commissioning of its Woodlawn mine and the sanctioning of two new projects during the first half. Recent copper development investments for the Company have delivered strong performance, including Cobre (0.5% of the portfolio) up +195% during 1H26, Gladiator Metals (0.5% of the portfolio) up +39.5% and Osisko Metals (0.8% of the portfolio) up +30.0%.
The aluminium market faced its first major supply shock, with the market tightening sharply after disruption to Middle East supply. The Middle East represents around 9% of global supply and the conflict caused prices to rise above US$3,700/t, with the average aluminium price 33% higher in 1H26 versus 1H25. Against this, we have begun to see new aluminium capacity being added in China and Indonesia, given the improved economics for producers. A key question is how quickly the Middle East supply recovers, with early indications suggesting a faster-than-expected recovery. Signs of resolution in the Middle East, along with new capacity announcements, saw the aluminium price pull back by close to 20% during June. The Company has exposure to Alcoa (1.8% of the portfolio), which finished the first half up +3.6% and in early July announced a major acquisition to acquire South32's aluminium business for up to US$5.6bn, which should unlock synergies via a combination of their West Australian bauxite and alumina operations. During the period, the Company reduced its exposure to Hydro (0.3% of the portfolio) in response to strong performance from elevated aluminium prices.
Nickel was broadly resilient but volatile during 1H26. By 30 June 2026, the price was US$16,091/t, down 2.5% year to date, although the average 1H26 price was still 15.1% higher than 1H25. Indonesian policy regarding nickel output quotas remains the key driver of the price. Indonesia, which controls around 55% of global nickel production, sharply cut export quotas in 2026, supporting prices. We continue to be cautious on the nickel market given the outsized impact that Indonesia can have on prices. The Company's nickel exposure is just 0.4% of the portfolio.
Bulks & steel
It was a mixed period for the bulk commodities, with the iron ore price declining 6% as China's steel production declined and anti-dumping measures pressured China's steel exports. Anti-dumping measures and tariffs have supported steel prices in Europe and the US, respectively, where the Company has increased exposure to key steel producers. After a period of depressed prices, we saw a rebound in both thermal and coking coal prices, with average prices meaningfully higher in 1H26 versus 1H25.
European steel prices were a bright spot during the first half, with policy incrementally constraining imports. The new quota and tariff mechanism implemented on 1 July 2026 has halved the amount of tariff-free imports and applies a 25 to 50% tariff on imports above this level. This has pushed steel prices higher and also supports domestic volume growth, benefiting domestic steel producer margins. ArcelorMittal (2.2% of the portfolio) has been a key beneficiary of this policy, with approximately 40% European revenue exposure, where we see a pathway for margins to materially improve over the next one to two years.
Iron ore has been a key area of strength in recent years, supporting free cash flow and dividends for the large producers. While the average price in 1H26 was 5.5% higher versus a year ago, we have begun to see the iron ore price moderate as China's steel outlook has weakened and supply has continued to grow. The newest major supply block entering the market is the Simandou Project in Guinea, which is expected to ramp up to 120 million tonnes per annum over the next three years. Production from Simandou mine is still minimal while it continues to ramp up, but we will see a more meaningful contribution from the asset in 2027 and 2028.
While the iron ore price held up reasonably well during 1H26, producer margins have been under greater pressure from elevated freight costs associated with the Middle East conflict, along with higher diesel costs and, for the Australian producers, a stronger Australian Dollar. While we continue to see strong cost-curve support for the iron ore price around US$90/t, with growing supply from existing producers and a moderating Chinese steel outlook, we expect the iron ore price to remain relatively range-bound over the near term. This year has been a particularly difficult trade negotiation with China Mineral Resources Group, China's iron ore buying consortium, and is indicative of the steel mills placing more pressure on the iron ore producers going forward.
The Company's exposure to iron ore is primarily via the diversified majors - BHP, Vale and Rio Tinto. These companies generate strong margins and free cash flows from their iron ore businesses, with that cash flow being returned to shareholders or reinvested into future-facing commodities such as copper. It has been interesting to see each of these companies look at infrastructure financing opportunities to recycle capital embedded within their iron ore businesses into other areas of their businesses.
Coking coal prices rebounded during the 1H26 with the price up +12% and the average price up +28% in 1H26 vs 1H25. This has been primarily driven by a major supply cut in China with 130 million tonnes per annum of production suspended following a deadly mine accident in Shanxi, with China increasing its imports of seaborne coking coal which has supported the price.
Thermal coal prices also strengthened, rising 22% during 1H26 as tightness in energy markets increased thermal coal demand and lower production quotas in Indonesia tightened supply. With the conflict in the Middle East occurring during the spring season with lower demand for thermal coal, we expect coal demand to strengthen as we move into an El Niño Northern Hemisphere summer. The Company's main thermal and coking coal exposure is via Glencore (7.0% of the portfolio), which performed strongly during the first half as it benefited from higher coal pricing, higher marketing earnings due to significant disruption to commodity markets, and an announcement that it was in discussions with Rio Tinto about a potential merger.
Precious metals
After a record-breaking year in 2025, we have seen a moderation in precious metal prices during the 1H26. While the gold price finished the period down 6.7% to US$4,036/oz, it is important to recognise that the average price for 1H26 was approximately 50% higher than the average price a year ago, supporting stronger earnings and distributions from the gold producers.
The beginning of the year saw new all-time highs for gold and silver. However, we saw significant liquidation of gold and silver ETF holdings as the conflict in the Middle East started in March, which saw prices pull back sharply as investors looked to de-risk and hold cash during this risk-off period.
A more hawkish tone from the Fed led to a repricing of US interest rates, with market expectations moving from an interest rate cut at the beginning of the year to a rate hike as inflation pressures grew, particularly from higher energy prices associated with the Middle East conflict. Higher rate expectations, combined with a stronger US Dollar, have acted as a headwind to gold and silver, given the exceptionally strong performance over the last year, it is not surprising to see some short-term profit taking. We continue to remain positive on the medium-term outlook for gold. As the conflict in the Middle East eases and short-term headwinds abate, we expect the market to refocus on growing government debt balances, necessitating a low real-rate environment, and the devaluation of paper currencies, supporting the case for holding gold as a true store of value over time.
The Company reduced its precious metals exposure during the first half and was able to generate positive alpha, relative to the benchmark, from positive stock selection. This was driven by some of the Company's smaller holdings, including Minerals 260 (0.8% of the portfolio), which was up +81% during 1H26 as it announced a financing deal with Franco Nevada and delivered a better-than-expected resource update. Our exposure to silver explorer, Hycroft Mining (0.6% of the portfolio) had an explosive start to the year, up over 100%, as the silver price rallied in February and the company delivered promising high-grade exploration results at its Vortex deposit in Nevada. With the shares up substantially since we initiated the position, we have prudently managed the position size and locked in profits along the way.
Platinum Group Metals
Platinum Group Metals (PGM) prices also declined during the first half alongside the move lower in gold and silver prices. While the platinum and palladium prices fell by 23.0% and 22.0% respectively, it is important to recognise that the average prices are up +102% and +60% than at the same time last year, which has supported strong dividends from the PGM producers. We have seen a moderation in automobile sales forecasts since the Iran conflict, along with higher electric vehicle penetration, which may reduce PGM demand expectations over the next couple of years. Given the lack of investment in new supplies across the PGM industry, we continue to see longer-term deficits in the markets, which is supportive for prices.
The Company reduced its PGM exposure during the period, given the strong performance of the equities and the underlying pricing basket. We remain positive on the cash return potential from the PGM producers, where the Company has exposure to Valterra Platinum (1.4% of the portfolio), Northam Platinum (0.2% of the portfolio), as well as Bravo Mining (0.6% of the portfolio), which is advancing its Luanga mine project in Brazil.
Energy transition metals
Lithium prices were volatile during the first half. Macquarie forecasts primary lithium demand growth of 17% in 2026 and a 15.5% compound annual growth rate from 2025 to 2030. However, mine supply is also expected to expand rapidly. At 30 June 2026, CATL's Jianxiawo lepidolite mine secured its final safety permit and restarted after being suspended since August 2025. The operation previously represented around 8 to 10% of Chinese lithium carbonate production. Against this backdrop, we remain selective on direct lithium exposure and expect continued price volatility.
Rare earths remain strategically important because China dominates processing and magnet supply. The Company has exposure through Lynas Rare Earths (Lynas) (1.0% of the portfolio), a key producer of rare earth materials outside China, with operations in Australia and Malaysia. Subsequent to the period end, Lynas announced a long-term partnership with South Korean magnet producer JS Link to develop a 3,000 tonnes per annum neodymium-iron-boron (NdFeB) magnet plant in Malaysia. During the half, the Company initiated a new position in Neo Performance Materials (0.9% of the portfolio), which has benefited from rising rare earth metal prices via its recycling business and is also expanding its permanent magnet business as a key supplier to Western customers.
Nuclear energy continued to gain policy support as governments sought reliable, low-carbon power and greater energy security. The average uranium price in the first half was up 24.5% than in the comparable period of 2025, while the spot price ended 30 June 2026 at US$84.80/lb. In June, the US Department of Energy announced a conditional US$17.5 billion loan commitment to support procurement of long-lead items for up to ten Westinghouse AP1000 nuclear reactors. This is strategically relevant to the Company's holding in Cameco (1.0% of the portfolio) who has a 49% interest in Westinghouse and its integrated exposure across uranium mining, conversion, fuel services and reactor technology.
Royalty and unquoted investments
At 30 June 2026, the unquoted investments were 3.7% of the portfolio and consisted of the Vale Debentures, Jetti Resources, MCC Mining and Varvara Development Group. As a reminder, the BHP Brazil Royalty contract was sold to Gold Royalty Corp at the end of 2025, with the Company earning an additional US$0.9 million in royalty income during first quarter of 2026 for royalty income that was earned in the fourth quarter of 2025 but not received until the first quarter of 2026. This brought the total proceeds, including royalty income and sale proceeds, to US$113 million versus the US$12 million investment that the Company made to acquire the royalty in 2014. This represents a 40% pre-tax initial rate of return, with a cumulative return of 842%.
These unquoted investments, and any future investments, will be managed in line with the guidelines set by the Board as outlined to shareholders in the Strategic Report included in the Annual Report for the year ended 31 December 2025.
Vale Debentures (2.4% of the portfolio)
At the beginning of 2019, the Company increased its holding in Vale Debentures, which consist of a 1.8% net revenue royalty over Vale's Northern System and Southeastern System iron ore assets in Brazil, as well as a 1.25% royalty over the Sossego copper mine.
Since we acquired the debentures at R$23 per debenture, we have received R$32.1 per debenture in shareholder payments, resulting in a 6 year payback on the initial investment. The Southeastern System assets started making payments under the debentures in the first half of 2025, which has increased the debenture payments that we received. With the debentures representing relatively expensive financing to Vale, in October 2025, Vale made an offer to holders to acquire the debentures for R$42/debenture. The Company chose not to sell given the attractive yield the debentures trade at and successfully acquired a further 1 million debentures during the first half of 2026.
Whilst the Vale Debentures are a royalty, they are also a listed security on the Brazilian National Debentures System. Historically there has been a low level of liquidity in these debentures and price volatility is to be expected.
Jetti Resources (0.1% of the portfolio)
In 2022, the Company made an investment in a mining technology company, Jetti Resources (Jetti), which has developed a new catalyst that improves copper recovery from primary copper sulphides, specifically copper contained in chalcopyrite, which is often uneconomic under conventional leach conditions. The technology is being used at Capstone's Pinto Valley copper mine and being evaluated by others, including Escondida, the world's largest copper mine.
During the year, the Company reduced the fair value of Jetti again to reflect further delays to the contract negotiation process. Jetti is targeting approval of its leaching technology at Escondida by year end, but this will not see meaningful revenue generated from the contract until 2030. As a result of the delays, revenue forecasts have been pushed out and this was a key driver of the valuation downgrade. Whilst we see potential for longer-term earnings growth, we want to see further progress on existing opportunities before embedding this into our valuation. This resulted in a 0.7% impact on the Company's NAV performance during the period. Jetti is now valued lower than the initial investment cost, which was made in 2022. Refer to Note 12 below.
MCC Mining (1.1% of the portfolio)
MCC Mining (MCC) is a private company exploring copper in Colombia. It is undertaking early-stage greenfield exploration and has strong geological potential to host multiple world class porphyry deposits. Shareholders include other mid to large-cap copper miners, which is an indication of the strategic value of the company.
MCC continues to deliver encouraging exploration results as it advances its Pantanos and Comita mine projects. The company raised US$75 million during 2025 to fund exploration in 2026. During 1H26, drilling was focused on the Pantanos' Pegadorcito deposit, with a resource estimate to be updated in 2026. Rio Tinto will assume operatorship of the Comita project from July 2026, with MCC retaining a 30% interest in the deposit. In addition, MCC commenced drilling on its La Rica deposit at the beginning of 2026. The Colombian elections concluded at the end of June, with the election of a new President, Abelardo de la Espriella. The new President's vision is centred around growth, attracting investment and restoring order in the country. The investment is currently held at a valuation based on the last funding round completed in June 2025, and it is hoped that future capital raises might be done via a liquidity event such as an initial public offering.
Varvara Development Group (0.1% of the portfolio)
During 1H26, the Company initiated a new position in a private mining company advancing the restart of the Certej gold project in Romania. Certej is a development project with an existing measured and indicated resource base of approximately 4.8 million oz of gold equivalent. The team is led by Dan Myerson and supported by G Mining Services, an experienced mine development group. The current focus for the project is permitting and project optimisation, with a simplified project design, removal of cyanide leaching and the use of dry-stack tailings. The Company participated in the founder financing round at a US$32m valuation for approximately 10% ownership of the Varvara Development Group. While there is significant uncertainty related to the investment, we see material valuation upside upon permitting success, successful development and ultimately moving into production. These risks were taken into account when making the smaller-than-normal investment for an unquoted position.
Derivatives activity
The Company from time to time enters into derivatives contracts, mostly involving the writing of "puts" and "calls". These are undertaken to generate revenue and are subject to strict Board guidelines, which limit their magnitude to an aggregate of 10% of the portfolio. In 1H26, income generated from options was £4.7 million. Given the elevated levels of volatility caused by the outbreak of conflict in the Middle East, the Company was able to take advantage of this. Income related to derivative activity has exceeded the level seen at this time last year and, given the increased size of the Company's assets, it is hoped that this continues to be the case for the remainder of the year.
At the end of the period, the Company had 0.04% of the net assets exposed to derivatives and the average exposure to derivatives during the period was once again less than 5%.
Gearing
At 30 June 2026, the Company had £151.1 million of net debt, with a gearing level of 7.6%. The debt is held principally in US Dollar rolling short-term loans and managed against the value of the portfolio as a whole. Gearing levels are continually reviewed and assessed against the opportunity set and the prevailing risks at the time. Despite seeing attractive investments within the sector, the near-term uncertainty related to the Middle East conflict has meant making less use of gearing during the period. This was a deliberate decision and cuts to gearing were funded from profits taken in a range of holdings across the portfolio. However, we remain ready to deploy gearing back to more normal amounts, which are well above current levels, should the near-term risks look set to reduce on a more than temporary basis.
Outlook
Despite the geopolitical challenges seen during the first half, the sector has been able to hold on to much of the gains made during the early months of the year. This has largely been in the industrial metals sector, with offsetting losses coming from the precious metal companies.
Looking into the remainder of the year, the recent results period has shown reassuring levels of cash generation and ongoing discipline from companies. In addition, the capital expenditure plans related to the ever-growing digitisation of the global economy look set to support demand growth for years to come. This is a strong foundation upon which to build the portfolio and, when the time is right, deploy further gearing to maximise the return potential of the Company.
As highlighted in the annual report, it had been hoped that the gold companies would increase dividend payments to reflect the improved profitability of the sector. However, given short term weakness in the gold price, this looks less likely to take place. Offsetting this are the better-than-expected prices in base metals and bulk commodities, which have exceeded expectations. Should the current situation remain for the remainder of the year this should provide a tailwind to income in 2026. Our objective is to deliver a superior total return through the cycle and income is an important contributor to this goal.
Evy Hambro and Olivia Markham
BlackRock Investment Management (UK) Limited
7 September 2026
Ten largest investments
Together, the Company's ten largest investments represented 51.1% of the Company's portfolio as at 30 June 2026 (31 December 2025: 49.4%).
1+Rio Tinto(2025: 4th)
Diversified mining group
Market value: £137,886,000
Share of investments: 7.6% (2025: 5.4%)
One of the world's leading mining groups. The British-Australian group's primary product is iron ore, but it also produces aluminium, copper, diamonds and industrial minerals.
2+Glencore (2025: 11th)
Diversified mining group
Market value: £127,746,000
Share of investments: 7.0% (2025: 3.4%)
One of the world's largest globally diversified natural resources groups. The group produces copper, nickel, alumina/aluminium, zinc and thermal and metallurgical coal and also has a commodity marketing/distribution business.
3-Vale1,2(2025: 1st)
Diversified mining group
Market value: £108,670,000
Share of investments: 6.0% comprising equity of 3.6% and debentures of 2.4% (2025: 7.1%)
Vale is the world's largest producer of iron ore, iron ore pellets and nickel. The group also produces copper and cobalt as part of its base metals division.
4+BHP(2025: 10th)
Diversified mining group
Market value: £105,145,000
Share of investments: 5.8% (2025: 3.6%)
The world's largest diversified mining group by market capitalisation. The group is an important global player in a number of commodities including iron ore, copper, metallurgical coal and potash.
5-Agnico Eagle Mines (2025: 3rd)
Gold producer
Market value: £82,232,000
Share of investments: 4.5% (2025: 5.6%)
A senior gold producer and one of the largest in the world by market capitalisation. The company has operations and projects in North America, Australia, Finland and Mexico.
6+Freeport-McMoRan (2025: 12th)
Copper producer
Market value: £78,296,000
Share of investments: 4.3% (2025: 2.1%)
A global mining group producing copper, gold and molybdenum. The company has operations in Indonesia, North America and South America.
7=Anglo American (2025: 7th)
Diversified mining group
Market value: £77,680,000
Share of investments: 4.2% (2025: 4.1%)
A globally diversified group with exposure to copper, premium iron ore, crop nutrients and other commodities. The company is currently undertaking a restructuring to simplify the business.
8-Barrick Mining (2025: 2nd)
Gold producer
Market value: £74,013,000
Share of investments: 4.1% (2025: 6.1%)
A senior gold producer and the third-largest in the world by market capitalisation. The company has operations and projects in North America, South America and Africa.
9-Newmont Corporation (2025: 5th)
Gold producer
Market value: £72,667,000
Share of investments: 4.0% (2025: 5.2%)
The world's largest gold producer by market capitalisation. The group has gold and copper operations on five continents, with active gold mines in Nevada, Australia, Ghana, Peru and Suriname.
10+Nucor (2025: 15th)
Steel producer
Market value: £65,629,000
Share of investments: 3.6%(2025: 1.9%)
A leading North American producer of steel and steel products, with operations spanning steel mills, downstream products and raw materials. The company primarily uses electric arc furnaces to recycle scrap into steel for construction, automotive, energy and industrial markets.
1 Includes investments held at Directors' valuation.
2 Includes fixed income securities.
All percentages reflect the value of the holding as a percentage of total investments. For this purpose, where more than one class of securities is held, these have been aggregated.
Symbols indicate the change in relative ranking of the position in the portfolio compared to its ranking as at 31 December 2025.
Percentages in brackets represent the value of the holding as at 31 December 2025.
Investments as at 30 June 2026
Main geographical exposure | Market value £'000 | % of investments | ||
Gold | ||||
Agnico Eagle Mines | Canada | 82,232 | 4.5 | |
Barrick Mining | Global | 74,013 | 4.1 | |
Newmont Corporation | Global | 72,667 | 4.0 | |
Wheaton Precious Metals | Global | 65,472 | 3.6 | |
AngloGold Ashanti | South Africa | 55,946 | } | 3.1 |
AngloGold Ashanti Call Option 17/07/2026 US$ 90.00 | South Africa | (305) | ||
Franco-Nevada | Global | 45,635 | 2.5 | |
Eldorado Gold | Global | 39,737 | 2.2 | |
Zijin Mining Group | China | 25,674 | 1.4 | |
Capricorn Metals | Australasia | 16,817 | 0.9 | |
Minerals 260 | Australasia | 15,200 | 0.8 | |
Kinross Gold | Global | 15,150 | 0.8 | |
Northern Star Resources | Australasia | 13,717 | 0.8 | |
Endeavour Mining | Other Africa | 13,113 | 0.7 | |
Hycroft Mining | United States | 11,001 | 0.6 | |
Gold Royalty | Global | 10,053 | 0.5 | |
Rio2 | Latin America | 8,247 | 0.5 | |
Firefly Metals | Canada | 6,950 | 0.4 | |
Bellevue Gold | Australasia | 4,917 | 0.3 | |
Challenger Gold | Latin America | 4,531 | 0.2 | |
Varvara Development Group 1 | Romania | 2,788 | 0.1 | |
Polyus 2 | Russia | - | - | |
-------------- | -------------- | |||
583,555 | 32.0 | |||
======== | ======== | |||
Diversified | ||||
Rio Tinto | Global | 137,886 | 7.6 | |
Glencore | Global | 127,746 | 7.0 | |
Vale | Global | 65,520 | } | 6.0 |
Vale Debentures 1,3 | Global | 43,150 | ||
BHP | Global | 105,145 | 5.8 | |
Anglo American | Global | 77,680 | 4.2 | |
Vox Royalty | Canada | 10,453 | 0.6 | |
-------------- | -------------- | |||
567,580 | 31.2 | |||
======== | ======== | |||
Copper | ||||
Freeport-McMoran | Global | 78,296 | 4.3 | |
Lundin Mining | Global | 34,311 | 1.9 | |
Sociedad Minera Cerro Verde | Latin America | 31,437 | 1.7 | |
Develop Global | Australasia | 28,596 | 1.6 | |
First Quantum Minerals | Global | 24,898 | 1.3 | |
Southern Copper Corporation | Latin America | 23,118 | 1.3 | |
MCC Mining 1 | Latin America | 20,628 | 1.1 | |
NGEx Minerals | Latin America | 17,775 | 1.0 | |
Ivanhoe Mines | Other Africa | 13,266 | 0.7 | |
Ivanhoe Electric | United States | 11,201 | 0.6 | |
Cobre | Australasia | 9,670 | 0.5 | |
Gladiator Metals | Canada | 8,444 | 0.5 | |
Solaris Resources | Latin America | 8,317 | 0.5 | |
LunR Royalties | Latin America | 4,458 | 0.2 | |
Jetti Resources 1 | Global | 2,777 | 0.1 | |
-------------- | -------------- | |||
317,192 | 17.3 | |||
======== | ======== | |||
Steel | ||||
Nucor | United States | 65,629 | 3.6 | |
Steel Dynamics | United States | 41,384 | 2.2 | |
ArcelorMittal | Global | 40,184 | 2.2 | |
-------------- | -------------- | |||
147,197 | 8.0 | |||
======== | ======== | |||
Industrial Minerals | ||||
Lynas Rare Earths | Australasia | 18,209 | 1.0 | |
Neo Performance Materials | Global | 16,027 | 0.9 | |
Albemarle | Global | 10,829 | 0.6 | |
Iluka Resources | Australasia | 6,437 | 0.3 | |
Chalice Mining | Australasia | 1,156 | 0.1 | |
Australian Carbon | Australasia | - | - | |
Victorian Hydrogen & Ammonia Industry | Australasia | - | - | |
-------------- | -------------- | |||
52,658 | 2.9 | |||
======== | ======== | |||
Platinum Group Metals | ||||
Valterra Platinum | South Africa | 25,428 | 1.4 | |
Bravo Mining | Latin America | 10,571 | 0.6 | |
Northam Platinum | Global | 4,379 | 0.2 | |
Impala Platinum | South Africa | 3,139 | 0.2 | |
-------------- | -------------- | |||
43,517 | 2.4 | |||
======== | ======== | |||
Aluminium | ||||
Alcoa | Global | 32,341 | } | 1.8 |
Alcoa Call Option 17/07/2026 US$55.00 | Global | (441) | ||
Hydro | Global | 5,927 | 0.3 | |
-------------- | -------------- | |||
37,827 | 2.1 | |||
======== | ======== | |||
Zinc | ||||
Osisko Metals | Canada | 14,806 | 0.8 | |
Titan Mining | United States | 4,680 | 0.2 | |
-------------- | -------------- | |||
19,486 | 1.0 | |||
======== | ======== | |||
Mining | ||||
BlueScope Steel | Global | 18,897 | 1.0 | |
-------------- | -------------- | |||
18,897 | 1.0 | |||
======== | ======== | |||
Uranium | ||||
Cameco | Canada | 17,359 | 1.0 | |
-------------- | -------------- | |||
17,359 | 1.0 | |||
======== | ======== | |||
Silver | ||||
Discovery Silver | Latin America | 12,495 | 0.7 | |
-------------- | -------------- | |||
12,495 | 0.7 | |||
======== | ======== | |||
Nickel | ||||
Nickel Industries | Indonesia | 7,301 | 0.4 | |
Bindura Nickel | Global | - | - | |
-------------- | -------------- | |||
7,301 | 0.4 | |||
======== | ======== | |||
Iron Ore | ||||
Equatorial Resources | Other Africa | 227 | - | |
-------------- | -------------- | |||
227 | - | |||
======== | ======== | |||
Energy Minerals | ||||
Gippsland Energy | Australasia | - | - | |
Latrobe Fertilisers | Australasia | - | - | |
-------------- | -------------- | |||
- | - | |||
======== | ======== | |||
Portfolio | 1,825,291 | 100.0 | ||
| ======== | ======== | ||
Comprising: | ||||
- Investments | 1,826,037 | 100.0 | ||
- Options | (746) | - | ||
-------------- | -------------- | |||
1,825,291 | 100.0 | |||
======== | ======== |
1 Includes investments held at Directors' valuation.
2 This position is fair valued to nil due to sanctions on Russia. The underlying local value of the position on the Moscow Stock Exchange at 30 June 2026 was £21.2 million.
3 The investment in the Vale debentures is illiquid and has been valued using secondary market pricing information provided by the Brazilian Financial and Capital Markets Association (ANBIMA).
All investments are in equity shares unless otherwise stated.
The total number of investments as at 30 June 2026 (including options classified as liabilities on the balance sheet) was 71 (31 December 2025: 70).
As at 30 June 2026 the Company held equity interests in four companies comprising more than 3% of a company's share capital as follows: Cobre (5.9%), Gladiator Metals (5.7%), Bravo Mining (5.1%) and Vox Royalty (4.3%).
Commodity Exposure1
30 June 2026 | 31 December 2025 | 30 June 2026 ? | |
Gold | 32.0% | 39.6% | 31.6% |
Diversified | 31.2% | 24.7% | 28.6% |
Copper | 17.3% | 17.1% | 12.2% |
Steel | 8.0% | 5.5% | 12.6% |
Industrial Minerals | 2.9% | 2.7% | 2.4% |
Platinum Group Metals | 2.4% | 4.3% | 2.3% |
Aluminium | 2.1% | 2.1% | 3.3 |
Zinc | 1.0% | 0.4% | 0.9% |
Mining | 1.0% | 0.0% | 0.0% |
Uranium | 1.0% | 1.0% | 0.0% |
Silver | 0.7% | 0.8% | 3.0% |
Nickel | 0.4% | 0.6% | 0.0% |
Iron Ore | 0.0% | 1.2% | 1.5% |
Other 3 | 0.0% | 0.0% | 1.6% |
1 Based on index classifications.
2 MSCI ACWI Metals & Mining 30% Buffer 10/40 Index (net total return).
3 Represents a very small exposure.
Geographic Exposure1
| 2026 |
|
| 2025 |
Global | 62.9% | Global | 57.2% | |
Other 2 | 9.1% | Canada | 10.2% | |
Latin America | 7.8% | Latin America | 8.7% | |
Canada | 7.8% | Other 3 | 8.6% | |
Australasia | 6.3% | South Africa | 6.6% | |
South Africa | 4.7% | Australasia | 5.8% | |
Other Africa (ex South Africa) | 1.4% | Other Africa (ex South Africa) | 2.9% |
1 Based on the principal commodity exposure and place of operation of each investment.
2 Consists of China, Indonesia, Romania and United States.
3 Consists of Indonesia and United States.
Interim Management Report and Responsibility Statement
The Chairman's Statement and the Investment Manager's Report give details of the important events which have occurred during the period and their impact on the financial statements.
Principal risks and uncertainties
The principal risks faced by the Group can be divided into various areas as follows:
- Market;
- Investment performance;
- Operational;
- Legal and regulatory compliance; and
- Financial.
The Board reported on the principal risks and uncertainties faced by the Group in the Annual Report and Financial Statements for the year ended 31 December 2025. A detailed explanation can be found in the Strategic Report on pages 42 to 46 and note 17 on pages 114 to 130 of the Annual Report and Financial Statements which is available on the website maintained by BlackRock at www.blackrock.com/uk/brwm.
In the view of the Board, there have not been any changes to the fundamental nature of the principal risks and uncertainties since the previous report and these are equally applicable to the remaining six months of the financial year as they were to the six months under review.
Going concern
The Directors, having considered the nature and liquidity of the portfolio, the Group's investment objective and the Group's projected income and expenditure, are satisfied that the Group has adequate resources to continue in operational existence for the foreseeable future and is financially sound. The Board remains mindful of heightened geopolitical and political uncertainty arising from ongoing international conflicts, increasing global trade, economic tensions and evolving political dynamics in key markets. The Board believes that the Group and its key third-party service providers have in place appropriate business continuity plans and these services have continued to be supplied without interruption.
The Group has a portfolio of investments which are predominantly readily realisable and is able to meet all of its liabilities from its assets and income generated from these assets. Accounting revenue and expense forecasts are maintained and reported to the Board regularly and it is expected that the Group will be able to meet all its obligations. Borrowings under the revolving credit facility shall at no time exceed £350 million or 25% of the Group's net asset value (whichever is the lower) and this covenant was complied with during the period.
Ongoing charges for the year ended 31 December 2025 were approximately 1.05% of average daily net assets and this is unlikely to change significantly going forward. Based on the above, the Board is satisfied that it is appropriate to continue to adopt the going concern basis in preparing the financial statements.
Related party disclosure and transactions with the Manager
BlackRock Fund Managers Limited (BFM) was appointed as the Company's Alternative Investment Fund Manager (AIFM) with effect from 2 July 2014. BFM has (with the Company's consent) delegated certain portfolio and risk management services, and other ancillary services, to BlackRock Investment Management (UK) Limited (BIM (UK)). Both BFM and BIM (UK) are regarded as related parties under the Listing Rules. Details of the management and marketing fees payable are set out in notes 4, 5 and 13 within the Half Yearly Financial Report.
The related party transactions with the Directors are set out in note 14 within the Half Yearly Financial Report.
Directors' responsibility statement
The Disclosure Guidance and Transparency Rules (DTR) of the UK Listing Authority require the Directors to confirm their responsibilities in relation to the preparation and publication of the Interim Management Report and Financial Statements.
The Directors confirm to the best of their knowledge that:
- the condensed set of financial statements contained within the Condensed Half Yearly Financial Report has been prepared in accordance with UK-adopted International Accounting Standard 34 Interim Financial Reporting; and
- the Interim Management Report, together with the Chairman's Statement and Investment Manager's Report, include a fair review of the information required by 4.2.7R and 4.2.8R of the Financial Conduct Authority Disclosure Guidance and Transparency Rules.
The Condensed Half Yearly Financial Report was approved by the Board on 7 September 2026 and the above responsibility statement was signed on its behalf by the Chairman.
Charles Goodyear
For and on behalf of the Board
7 September 2026
Consolidated Statement of Comprehensive Incomefor the six months ended 30 June 2026
Six months ended | Six months ended | Year ended | ||||||||
Revenue | Capital | Total | Revenue | Capital | Total | Revenue | Capital | Total | ||
Notes | £'000 | £'000 | £'000 | £'000 | £'000 | £'000 | £'000 | £'000 | £'000 | |
Income from investments held at fair value through profit or loss | 3 | 24,246 | - | 24,246 | 22,353 | - | 22,353 | 48,248 | - | 48,248 |
Other income | 3 | 5,042 | - | 5,042 | 4,530 | - | 4,530 | 9,121 | - | 9,121 |
------------ | ------------ | ------------ | ------------ | ------------ | ------------ | ------------ | ------------ | ------------ | ||
Total revenue | 29,288 | - | 29,288 | 26,883 | - | 26,883 | 57,369 | - | 57,369 | |
| ======= | ======= | ======= | ======= | ======= | ======= | ======= | ======= | ======= | |
Net profit on investments and options held at fair value through profit or loss | - | 99,466 | 99,466 | - | 47,965 | 47,965 | - | 639,784 | 639,784 | |
Net (losses)/gains on foreign exchange | - | (2,240) | (2,240) | - | 12,952 | 12,952 | - | 13,299 | 13,299 | |
------------ | ------------ | ------------ | ------------ | ------------ | ------------ | ------------ | ------------ | ------------ | ||
Total | 29,288 | 97,226 | 126,514 | 26,883 | 60,917 | 87,800 | 57,369 | 653,083 | 710,452 | |
| ======= | ======= | ======= | ======= | ======= | ======= | ======= | ======= | ======= | |
Expenses | ||||||||||
Investment management fee | 4 | (1,743) | (5,334) | (7,077) | (1,054) | (3,263) | (4,317) | (2,590) | (7,963) | (10,553) |
Other operating expenses | 5 | (786) | (10) | (796) | (627) | (2) | (629) | (1,401) | (8) | (1,409) |
------------ | ------------ | ------------ | ------------ | ------------ | ------------ | ------------ | ------------ | ------------ | ||
Total operating expenses | (2,529) | (5,344) | (7,873) | (1,681) | (3,265) | (4,946) | (3,991) | (7,971) | (11,962) | |
| ======= | ======= | ======= | ======= | ======= | ======= | ======= | ======= | ======= | |
Net profit before finance costs and taxation | 26,759 | 91,882 | 118,641 | 25,202 | 57,652 | 82,854 | 53,378 | 645,112 | 698,490 | |
Finance costs | 6 | (815) | (2,442) | (3,257) | (789) | (2,447) | (3,236) | (1,525) | (4,573) | (6,098) |
| ------------ | ------------ | ------------ | ------------ | ------------ | ------------ | ------------ | ------------ | ------------ | |
Net profit before taxation | 25,944 | 89,440 | 115,384 | 24,413 | 55,205 | 79,618 | 51,853 | 640,539 | 692,392 | |
| ======= | ======= | ======= | ======= | ======= | ======= | ======= | ======= | ======= | |
Taxation (charge)/credit | (3,107) | 2,557 | (550) | (3,088) | 1,157 | (1,931) | (5,986) | 2,184 | (3,802) | |
------------ | ------------ | ------------ | ------------ | ------------ | ------------ | ------------ | ------------ | ------------ | ||
Net profit after taxation | 22,837 | 91,997 | 114,834 | 21,325 | 56,362 | 77,687 | 45,867 | 642,723 | 688,590 | |
| ======= | ======= | ======= | ======= | ======= | ======= | ======= | ======= | ======= | |
Earnings per ordinary share (pence) - basic and diluted | 8 | 12.24 | 49.32 | 61.56 | 11.26 | 29.77 | 41.03 | 24.37 | 341.49 | 365.86 |
|
| ======= | ======= | ======= | ======= | ======= | ======= | ======= | ======= | ======= |
The total columns of this statement represent the Group's Statement of Comprehensive Income, prepared in accordance with UK-adopted International Accounting Standards (IASs). The supplementary revenue and capital accounts are both prepared under guidance published by the Association of Investment Companies (AIC). All items in the above statement derive from continuing operations. No operations were acquired or discontinued during the period. All income is attributable to the equity holders of the Group.
The Group does not have any other comprehensive income/(loss) (six months ended 30 June 2025: £nil; year ended 31 December 2025: £nil). The net profit/(loss) for the period disclosed above represents the Group's total comprehensive income/(loss).
Consolidated Statement of Changes in Equityfor the six months ended 30 June 2026
Called up share capital | Share premium account | Capital redemption reserve | Special reserve | Capital reserves | Revenue reserve | Total | ||
Notes | £'000 | £'000 | £'000 | £'000 | £'000 | £'000 | £'000 | |
For the six months ended 30 June 2026 (unaudited) | ||||||||
At 31 December 2025 | 9,651 | 151,493 | 22,779 | 170,033 | 1,203,816 | 40,656 | 1,598,428 | |
Total comprehensive income: | ||||||||
Net profit after taxation | - | - | - | - | 91,997 | 22,837 | 114,834 | |
Transaction with owners, recorded directly to equity: | ||||||||
Ordinary shares repurchased into treasury | 9 | - | - | - | (2,774) | - | - | (2,774) |
Share repurchase costs | 9 | - | - | - | (20) | - | - | (20) |
Dividends paid 1 | 7 | - | - | - | - | - | (13,989) | (13,989) |
| ----------- | ----------- | ----------- | ----------- | ----------- | ----------- | ----------- | |
At 30 June 2026 | 9,651 | 151,493 | 22,779 | 167,239 | 1,295,813 | 49,504 | 1,696,479 | |
| ======= | ======= | ======= | ======= | ======= | ======= | ======= | |
For the six months ended 30 June 2025 (unaudited) | ||||||||
At 31 December 2024 | 9,651 | 151,493 | 22,779 | 192,134 | 561,093 | 38,049 | 975,199 | |
Total comprehensive income: | ||||||||
Net profit after taxation | - | - | - | - | 56,362 | 21,325 | 77,687 | |
Transaction with owners, recorded directly to equity: | ||||||||
Ordinary shares repurchased into treasury | 9 | - | - | - | (17,301) | - | - | (17,301) |
Share repurchase costs | 9 | - | - | - | (121) | - | - | (121) |
Dividends paid 2 | 7 | - | - | - | - | - | (22,687) | (22,687) |
| ----------- | ----------- | ----------- | ----------- | ----------- | ----------- | ----------- | |
At 30 June 2025 | 9,651 | 151,493 | 22,779 | 174,712 | 617,455 | 36,687 | 1,012,777 | |
| ======= | ======= | ======= | ======= | ======= | ======= | ======= | |
For the year ended 31 December 2025 (audited) | ||||||||
At 31 December 2024 | 9,651 | 151,493 | 22,779 | 192,134 | 561,093 | 38,049 | 975,199 | |
Total comprehensive income: | ||||||||
Net profit after taxation | - | - | - | - | 642,723 | 45,867 | 688,590 | |
Transactions with owners, recorded directly to equity: | ||||||||
Ordinary shares repurchased into treasury | 9 | - | - | - | (21,947) | - | - | (21,947) |
Share repurchase costs | 9 | - | - | - | (154) | - | - | (154) |
Dividends paid 3 | 7 | - | - | - | - | - | (43,260) | (43,260) |
----------- | ----------- | ----------- | ----------- | ----------- | ----------- | ----------- | ||
At 31 December 2025 | 9,651 | 151,493 | 22,779 | 170,033 | 1,203,816 | 40,656 | 1,598,428 | |
| ======= | ======= | ======= | ======= | ======= | ======= | ======= |
1 The final dividend for the year ended 31 December 2025 of 7.50p per share, declared on 17 March 2026 and paid on 29 May 2026.
2 The final dividend for the year ended 31 December 2024 of 6.50p per share, declared on 4 March 2025 and paid on 27 May 2025, and 1st quarterly interim dividend for the year ended 31 December 2025 of 5.50p per share, declared on 21 May 2025 and paid on 27 June 2025.
3 The final dividend for the year ended 31 December 2024 of 6.50p per share, declared on 4 March 2025 and paid on 27 May 2025; 1st interim dividend of 5.50p per share for the year ended 31 December 2025, declared on 21 May 2025 and paid on 27 June 2025; 2nd interim dividend of 5.50p per share for the year ended 31 December 2025, declared on 3 September 2025 and paid on 26 September 2025 and 3rd interim dividend of 5.50p per share for the year ended 31 December 2025, declared on 19 November 2025 and paid on 19 December 2025.
For information on the Company's distributable reserves, please refer to note 11 within the Half Yearly Financial Report.
Consolidated Statement of Financial Position as at 30 June 2026
As at 30 June | As at 30 June | As at 31 December 2025 | ||
Notes | £'000 | £'000 | £'000 | |
Non current assets | ||||
Investments held at fair value through profit or loss | 12 | 1,826,037 | 1,083,726 | 1,675,057 |
Current assets | ||||
Current taxation asset | 1,874 | 2,084 | 2,418 | |
Other receivables | 6,422 | 8,699 | 9,092 | |
Cash collateral held with brokers | 2,603 | 4,366 | 4,415 | |
Cash and cash equivalents - cash at bank | 31,181 | 21,378 | 13,800 | |
| -------------- | -------------- | -------------- | |
Total current assets | 42,080 | 36,527 | 29,725 | |
| ======== | ======== | ======== | |
Total assets | 1,868,117 | 1,120,253 | 1,704,782 | |
| ======== | ======== | ======== | |
Current liabilities | ||||
Current taxation liability | (15) | (360) | (399) | |
Other payables | (19,476) | (12,240) | (7,531) | |
Derivative financial liabilities held at fair value through profit or loss | 12 | (746) | (932) | (359) |
Bank loans | 10 | (150,688) | (91,218) | (96,651) |
Cash and cash equivalents - bank overdraft | 10 | (404) | (1,706) | (57) |
-------------- | -------------- | -------------- | ||
Total current liabilities | (171,329) | (106,456) | (104,997) | |
| ======== | ======== | ======== | |
Total assets less current liabilities | 1,696,788 | 1,013,797 | 1,599,785 | |
| ======== | ======== | ======== | |
Non current liabilities | ||||
Deferred taxation liability | (309) | (1,020) | (1,357) | |
-------------- | -------------- | -------------- | ||
Net assets | 1,696,479 | 1,012,777 | 1,598,428 | |
| ======== | ======== | ======== | |
Equity attributable to equity holders | ||||
Called up share capital | 9 | 9,651 | 9,651 | 9,651 |
Share premium account | 11 | 151,493 | 151,493 | 151,493 |
Capital redemption reserve | 11 | 22,779 | 22,779 | 22,779 |
Special reserve | 11 | 167,239 | 174,712 | 170,033 |
Capital reserves | 11 | 1,295,813 | 617,455 | 1,203,816 |
Revenue reserve | 11 | 49,504 | 36,687 | 40,656 |
-------------- | -------------- | -------------- | ||
Total equity | 1,696,479 | 1,012,777 | 1,598,428 | |
| ======== | ======== | ======== | |
Net asset value per ordinary share (pence) | 8 | 910.23 | 540.48 | 856.23 |
|
| ======== | ======== | ======== |
Consolidated Cash Flow Statementfor the six months ended 30 June 2026
Six months ended | Six months ended | Year ended | |
£'000 | £'000 | £'000 | |
Operating activities | |||
Net profit before taxation | 115,384 | 79,618 | 692,392 |
Changes in working capital items: | |||
Decrease/(increase) in other receivables |
6,066 | (809) | (6,052) |
Increase/(decrease) in other payables | 3,457 | (2,880) | (2,241) |
Increase in amounts due from brokers | (3,396) | (5,029) | (179) |
Increase in amounts due to brokers | 8,377 | 5,004 | 67 |
Net movement in cash collateral held with brokers | 1,812 | 516 | 467 |
Other adjustments: | |||
Finance costs | 3,257 | 3,236 | 6,098 |
Net profit on investments and options held at fair value through profit or loss | (99,466) | (47,965) | (639,784) |
Net losses/(gains) on foreign exchange | 2,240 | (12,952) | (13,299) |
Sale of investments held at fair value through profit or loss | 432,957 | 335,563 | 773,242 |
Purchase of investments held at fair value through profit or loss | (484,171) | (278,098) | (716,063) |
Contractual rights - return of capital | 87 | 283 | 483 |
-------------- | -------------- | -------------- | |
Net cash (outflow)/inflow from operating activities before taxation | (13,396) | 76,487 | 95,131 |
| ======== | ======== | ======== |
Taxation paid | (32) | (1,990) | (3,226) |
Withholding taxes on investment income | (1,390) | (1,225) | (2,155) |
-------------- | -------------- | -------------- | |
Net cash (outflow)/inflow from operating activities | (14,818) | 73,272 | 89,750 |
| ======== | ======== | ======== |
Financing activities | |||
Repayment of loan | - | (31,283) | (25,362) |
Drawdown of loan | 52,085 | - | - |
Interest paid | (3,162) | (3,314) | (6,249) |
Ordinary shares repurchased into treasury | (2,794) | (17,422) | (22,101) |
Dividends paid | (13,989) | (22,687) | (43,260) |
-------------- | -------------- | -------------- | |
Net cash inflow/(outflow) from financing activities | 32,140 | (74,706) | (96,972) |
| ======== | ======== | ======== |
Increase/(decrease) in cash and cash equivalents | 17,322 | (1,434) | (7,222) |
Effect of foreign exchange rate changes | (288) | (286) | (427) |
Increase/(decrease) in cash and cash equivalents | 17,034 | (1,720) | (7,649) |
Cash and cash equivalents at start of period/year | 13,743 | 21,392 | 21,392 |
-------------- | -------------- | -------------- | |
Cash and cash equivalents at end of period/year | 30,777 | 19,672 | 13,743 |
| ======== | ======== | ======== |
Comprised of: | |||
Cash at bank | 31,181 | 21,378 | 13,800 |
Bank overdraft | (404) | (1,706) | (57) |
======== | ======== | ======== | |
30,777 | 19,672 | 13,743 | |
======== | ======== | ======== |
Notes to the financial statementsfor the six months ended 30 June 2026
1. Principal activity
The principal activity of the Company is that of an investment trust company within the meaning of Section 1158 of the Corporation Tax Act 2010.
The principal activity of the subsidiary, BlackRock World Mining Investment Company Limited, is investment dealing.
2. Basis of preparation
The half yearly financial statements for the period ended 30 June 2026 have been prepared in accordance with the Disclosure Guidance and Transparency Rules sourcebook of the Financial Conduct Authority and with the UK-adopted International Accounting Standard 34 (IAS 34), Interim Financial Reporting. The half yearly financial statements should be read in conjunction with the Group's Annual Report and Financial Statements for the year ended 31 December 2025, which have been prepared in accordance with UK-adopted International Accounting Standards (IASs).
Insofar as the Statement of Recommended Practice (SORP) for investment trust companies and venture capital trusts, issued by the Association of Investment Companies (AIC) in December 2025, is compatible with UK-adopted IASs, the financial statements have been prepared in accordance with guidance set out in the SORP.
Adoption of new and amended International Accounting Standards and interpretations:
IFRS 9 - Classification and measurement of financial instruments(effective 1 January 2026). The IASB issued amendments to IFRS 9 Financial Instruments to clarify that a financial liability is derecognised on the settlement date and introduce an accounting policy choice to derecognise financial liabilities settled using an electronic payment system before the settlement date. The amendments also clarify the classification of financial assets with ESG linked features with additional guidance on the assessment of contingent features.
IFRS 7 - Financial assets and liabilities with contingent events(effective 1 January 2026). The IASB issued amendments to IFRS 7 Financial Instruments: Disclosures to require additional disclosures for financial assets and liabilities with contractual terms that reference a contingent event including those that are ESG linked, and equity instruments classified at fair value through other comprehensive income.
IFRS 9 - Measurement of trade receivables(effective 1 January 2026). The IASB has issued amendments to IFRS 9 Financial Instruments to remove conflict between IFRS 9 and IFRS 15 Revenue from Contracts with Customers over the initial measurement of trade receivables. The amendments require companies to initially measure a trade receivable without a significant financing component at the amount determined by applying IFRS 15.
The amendment of these standards did not have any significant impact on the Company.
Relevant International Accounting Standards that have yet to be adopted:
IFRS 18 - Presentation and disclosure in financial statements(effective 1 January 2027). The IASB issued IFRS 18, which replaces IAS 1 Presentation of Financial Statements. IFRS 18 introduces new requirements for presentation within the statement of profit or loss, including specified totals and subtotals. Furthermore, entities are required to classify all income and expenses within the statement of profit or loss into one of five categories: operating, investing, financing, income taxes and discontinued operations, whereof the first three are new. It also requires disclosure of newly defined management defined performance measures, subtotals of income and expenses, and includes new requirements for aggregation and disaggregation of financial information based on the identified 'roles' of the primary financial statements and the notes.
None of the standards that have been issued, but are not yet effective, are expected to have a material impact on the Company.
3. Income
Six months ended | Six months ended | Year ended | |
£'000 | £'000 | £'000 | |
Investment income: | |||
UK dividends | 6,816 | 4,797 | 9,007 |
Overseas dividends | 12,832 | 9,738 | 26,506 |
Overseas special dividends | 583 | 1,221 | 765 |
Overseas stock dividends | 414 | 230 | 680 |
Income from contractual rights (BHP Brazil Royalty) | 674 | 3,752 | 7,366 |
Income from Vale debentures | 2,880 | 2,291 | 3,272 |
Income from fixed income investments | 47 | 324 | 652 |
------------ | ------------ | ------------ | |
Total investment income | 24,246 | 22,353 | 48,248 |
| ======= | ======= | ======= |
Other income: | |||
Option premium income | 4,715 | 3,857 | 8,317 |
Deposit interest | 225 | 542 | 563 |
Interest received on cash collateral with brokers | 38 | 64 | 140 |
Stock lending income | 64 | 67 | 101 |
------------ | ------------ | ------------ | |
Total other income | 5,042 | 4,530 | 9,121 |
| ======= | ======= | ======= |
Total | 29,288 | 26,883 | 57,369 |
| ======= | ======= | ======= |
During the period, the Group received option premium income in cash totalling £4,713,000 (six months ended 30 June 2025: £3,834,000; year ended 31 December 2025: £8,310,000) for writing put and covered call options for the purposes of revenue generation.
Option premium income is amortised evenly over the life of the option contract and, accordingly, during the period, option premiums of £4,715,000 (six months ended 30 June 2025: £3,857,000; year ended 31 December 2025: £8,317,000) were amortised to revenue.
At 30 June 2026, there were two open positions (30 June 2025: three; 31 December 2025: two) with an associated liability of £746,000 (30 June 2025: £932,000; 31 December 2025: £359,000).
Dividends and interest received in cash in the six months ended 30 June 2026 amounted to £22,745,000 and £2,215,000 (six months ended 30 June 2025: £14,897,000 and £2,342,000; year ended 31 December 2025: £30,122,000 and £3,898,000).
No special dividends have been recognised in capital during the six months ended 30 June 2026 (six months ended 30 June 2025: none; year ended 31 December 2025: none).
4. Investment management fee
Six months ended | Six months ended | Year ended | |||||||
Revenue | Capital | Total | Revenue | Capital | Total | Revenue | Capital | Total | |
£'000 | £'000 | £'000 | £'000 | £'000 | £'000 | £'000 | £'000 | £'000 | |
Investment management fee | 1,743 | 5,334 | 7,077 | 1,054 | 3,263 | 4,317 | 2,590 | 7,963 | 10,553 |
---------- | ---------- | ---------- | ---------- | ---------- | ---------- | ---------- | ---------- | ---------- | |
Total | 1,743 | 5,334 | 7,077 | 1,054 | 3,263 | 4,317 | 2,590 | 7,963 | 10,553 |
| ====== | ====== | ====== | ====== | ====== | ====== | ====== | ====== | ====== |
The investment management fee (which includes all services provided by BlackRock) is 0.80% of the Company's gross assets (subject to certain adjustments). During the period, £6,846,000 (six months ended 30 June 2025: £3,961,000; year ended 31 December 2025: £9,800,000) of the investment management fee was generated from net assets and £231,000 (six months ended 30 June 2025: £356,000; year ended 31 December 2025: £753,000) from the gearing effect on gross assets due to the quarter-on-quarter increase in the NAV per share for the period as set out below:
Quarter end | Cum income NAV per share (pence) | Quarterly increase/ (decrease) % | Gearing effect on management fees (£'000) |
31 December 2024 | 510.53 | - | - |
31 March 2025 | 524.77 | +2.8 | 235 |
30 June 2025 | 540.48 | +3.0 | 121 |
30 September 2025 | 700.52 | +29.6 | 186 |
31 December 2025 | 856.23 | +22.2 | 211 |
31 March 2026 | 951.96 | +11.2 | 231 |
30 June 2026 | 910.23 | -4.4 | - |
====== | ====== | ====== |
The daily average of the net assets under management during the period ended 30 June 2026 was £1,851,047,000 (six months ended 30 June 2025: £1,006,704,000; year ended 31 December 2025: £1,142,715,000).
The fee is allocated 25% to the revenue account and 75% to the capital account of the Consolidated Statement of Comprehensive Income.
There is no additional fee for company secretarial and administration services.
5. Other operating expenses
Six months ended | Six months ended | Year ended | |
£'000 | £'000 | £'000 | |
Allocated to revenue: | |||
Custody fee | 83 | 46 | 108 |
Auditors' remuneration - audit services 1 | 35 | 33 | 56 |
Registrar's fee | 54 | 43 | 89 |
Directors' emoluments | 73 | 84 | 161 |
AIC fees | 11 | 11 | 29 |
Broker fees | 17 | 17 | 35 |
Depositary fees | 86 | 47 | 96 |
FCA fee | 26 | 25 | 53 |
Directors' insurance | 10 | 10 | 19 |
Marketing fees | 90 | 61 | 161 |
Marketing fees - under accrual for prior periods | 31 | - | - |
Stock exchange listing fees | 26 | 33 | 59 |
Legal and professional fees | 128 | 39 | 76 |
Bank facility fees 2 | 46 | 46 | 92 |
Printing and postage fees | 27 | 24 | 65 |
Directors' search fees | 5 | 14 | 27 |
Write back of prior year expenses 3 | (52) | (5) | - |
Other administrative costs | 90 | 99 | 275 |
---------- | ---------- | ---------- | |
Total revenue expenses | 786 | 627 | 1,401 |
| ====== | ====== | ====== |
Allocated to capital: | |||
Transaction charges 4 | 10 | 2 | 8 |
---------- | ---------- | ---------- | |
Total capital expenses | 10 | 2 | 8 |
| ====== | ====== | ====== |
Total | 796 | 629 | 1,409 |
| ====== | ====== | ====== |
1 No non-audit services were provided by the auditors for the six months ended 30 June 2026 (six months ended 30 June 2025: none; year ended 31 December 2025: none).
2 There is a 4 basis point facility fee chargeable on the full loan facility whether drawn or undrawn.
3 Relates to stock exchange fees written back during the six months ended 30 June 2026 (six months ended 30 June 2025: legal and professional fees and other administrative costs; year ended 31 December 2025: none)
4 For the six months ended 30 June 2026, expenses of £10,000 (six months ended 30 June 2025: £2,000; year ended 31 December 2025: £8,000) were charged to the capital account of the Statement of Comprehensive Income. These relate to transaction costs charged by the custodian on sale and purchase trades.
The transaction costs incurred on the acquisition of investments amounted to £698,000 for the six months ended 30 June 2026 (six months ended 30 June 2025: £339,000; year ended 31 December 2025: £1,142,000). Costs relating to the disposal of investments amounted to £218,000 for the six months ended 30 June 2026 (six months ended 30 June 2025: £165,000; year ended 31 December 2025: £415,000). All transaction costs have been included within the capital reserves.
6. Finance costs
Six months ended | Six months ended | Year ended | |||||||
Revenue | Capital | Total | Revenue | Capital | Total | Revenue | Capital | Total | |
£'000 | £'000 | £'000 | £'000 | £'000 | £'000 | £'000 | £'000 | £'000 | |
Interest paid on bank loans | 805 | 2,414 | 3,219 | 788 | 2,444 | 3,232 | 1,477 | 4,430 | 5,907 |
Interest paid on bank overdraft | 10 | 28 | 38 | 1 | 3 | 4 | 48 | 143 | 191 |
---------- | ---------- | ---------- | ---------- | ---------- | ---------- | ---------- | ---------- | ---------- | |
Total | 815 | 2,442 | 3,257 | 789 | 2,447 | 3,236 | 1,525 | 4,573 | 6,098 |
| ====== | ====== | ====== | ====== | ====== | ====== | ====== | ====== | ====== |
Finance costs are charged 25% to the revenue account and 75% to the capital account of the Consolidated Statement of Comprehensive Income.
7. Dividends
The final dividend of 7.50p per share for the year ended 31 December 2025 was paid on 29 May 2026.
The Board has declared a first quarterly interim dividend of 5.50p per share for the quarter ended 31 March 2026, paid on 17 July 2026 to shareholders on the register on 19 June 2026. The Board has also declared a second quarterly interim dividend of 5.50p per share for the quarter ended 30 June 2026 which will be paid on 9 October 2026 to shareholders on the register on 18 September 2026.
These two interim dividends have not been accrued in the financial statements for the six months ended 30 June 2026 as, under IASs, interim dividends are not recognised until paid. Dividends are debited directly to reserves.
Six months | Six months ended | Year ended | |
Dividends paid on equity shares during the period: | £'000 | £'000 | £'000 |
Year ended 31 December 2024 | |||
Final dividend of 6.50p paid on 27 May 2025 | - | 12,381 | 12,381 |
Year ended 31 December 2025 | |||
First interim dividend of 5.50p paid on 27 June 2025 | - | 10,306 | 10,306 |
Second interim dividend of 5.50p paid on 26 September 2025 | - | - | 10,305 |
Third interim dividend of 5.50p paid on 19 December 2025 | - | - | 10,268 |
Final dividend of 7.50p paid on 29 May 2026 | 13,989 | - | - |
---------- | ---------- | ---------- | |
Accounted for in the financial statements | 13,989 | 22,687 | 43,260 |
| ====== | ====== | ====== |
Year ended 31 December 2026 | |||
First interim dividend of 5.50p paid on 17 July 2026 | 10,251 | - | - |
Second interim dividend of 5.50 p payable on 9 October 2026 1 | 10,280 | - | - |
---------- | ---------- | ---------- | |
Total | 20,531 | 22,687 | 43,260 |
| ====== | ====== | ====== |
1 Based on the number of ordinary shares in issue being 186,909,036 at 3 September 2026 being the the latest practicable date prior to the issue of this report.
The dividends referenced on page 1 in the Financial Highlights contained within the Half Yearly Financial Report. comprises the first and second interim dividends declared during the period of 5.50p and 5.50p together totalling 11.00p. The yield figure disclosed on the same page is explained in the Glossary contained within the Half Yearly Financial Report. It is based on the first and second interim dividends declared for 2026 and third interim and final dividend declared for 2025.
8. Consolidated earnings and net asset value per ordinary share
Total revenue, capital earnings and net asset value per ordinary share are shown below and have been calculated using the following:
Six months ended | Six months ended | Year ended | |
Net revenue profit attributable to ordinary shareholders (£'000) | 22,837 | 21,325 | 45,867 |
Net capital profit attributable to ordinary shareholders (£'000) | 91,997 | 56,362 | 642,723 |
---------------- | ---------------- | ---------------- | |
Total profit attributable to ordinary shareholders (£'000) | 114,834 | 77,687 | 688,590 |
| ========= | ========= | ========= |
Equity shareholders' funds (£'000) | 1,696,479 | 1,012,777 | 1,598,428 |
| ========= | ========= | ========= |
The weighted average number of ordinary shares in issue during the period on which the earnings per ordinary share was calculated was: | 186,533,919 | 189,331,680 | 188,213,496 |
The actual number of ordinary shares in issue at the end of the period on which the net asset value per ordinary share was calculated was: | 186,379,036 | 187,383,036 | 186,683,036 |
Earnings per ordinary share | |||
Revenue earnings per share (pence) - basic and diluted | 12.24 | 11.26 | 24.37 |
Capital earnings per share (pence) - basic and diluted | 49.32 | 29.77 | 341.49 |
---------------- | ---------------- | ---------------- | |
Total earnings per share (pence) - basic and diluted | 61.56 | 41.03 | 365.86 |
| ========= | ========= | ========= |
As at | As at | As at 2025 | |
Net asset value per ordinary share (pence) | 910.23 | 540.48 | 856.23 |
Ordinary share price (pence) - ex 1st interim dividend | 901.00 | 528.00 | 804.00 |
Ordinary share price (pence) - cum 1st interim dividend 1 | 906.50 | 528.00 | 804.00 |
========= | ========= | ========= |
As at | |
Dealing NAV as at 30 June 2026 | 904.73 |
Add: first quarter interim dividend per share (ex-dividend date 18 June 2026) 1 | 5.50 |
---------------- | |
Net asset value per share per Consolidated Statement of Financial Position | 910.23 |
| ========= |
As at | |
Ordinary share price as at 30 June 2026 | 901.00 |
Add: first quarter interim dividend per share (ex-dividend date 18 June 2026) 1 | 5.50 |
---------------- | |
Ordinary share price - cum first interim dividend | 906.50 |
| ========= |
1 The share price went ex-dividend for the first quarter interim dividend of 5.50p per share on 18 June 2026; however, this interim dividend is not accounted for in the NAV at 30 June 2026 as a liability in accordance with IFRS until paid. As a result, we have presented the ordinary share price on a cum first interim dividend basis for comparability with the cum income net asset value per share.
There were no dilutive securities at the period end (30 June 2025: none; 31 December 2025: none).
9. Share capital
Ordinary in issue | Treasury | Total | Nominal | |
Allotted, called up and fully paid share capital comprised: | ||||
Ordinary shares of 5 pence each: | ||||
At 31 December 2024 (audited) | 191,018,036 | 1,993,806 | 193,011,842 | 9,651 |
Ordinary shares repurchased into treasury | (3,635,000) | 3,635,000 | - | - |
At 30 June 2025 (unaudited) | 187,383,036 | 5,628,806 | 193,011,842 | 9,651 |
Ordinary shares repurchased into treasury | (700,000) | 700,000 | - | - |
At 31 December 2025 (audited) | 186,683,036 | 6,328,806 | 193,011,842 | 9,651 |
Ordinary shares repurchased into treasury | (304,000) | 304,000 | - | - |
---------------- | ---------------- | ---------------- | ---------------- | |
At 30 June 2026 (unaudited) | 186,379,036 | 6,632,806 | 193,011,842 | 9,651 |
| ========= | ========= | ========= | ========= |
During the six months ended 30 June 2026, the Company repurchased 304,000 shares into treasury (six months ended 30 June 2025: 3,635,000; year ended 31 December 2025: 4,335,000) for a total consideration including costs of £2,794,000 (six months ended 30 June 2025: £17,422,000; year ended 31 December 2025: £22,101,000).
Since the period end and up to 3 September 2026, the Company has not repurchased shares any shares. Since the period end and up to 3 September 2026, the Company has also issued 530,000 shares from treasury for a total consideration of £4,651,000.
10. Reconciliation of liabilities arising from financing activities
Six months ended | Six months ended | Year ended | |
£'000 | £'000 | £'000 | |
Debt arising from financing activities at beginning of period/year | |||
Bank loan | 96,651 | 135,739 | 135,739 |
Bank loan interest payable 1 | 282 | 433 | 433 |
Cash at bank - bank overdraft | 57 | 4 | 4 |
---------------- | ---------------- | ---------------- | |
Total | 96,990 | 136,176 | 136,176 |
| ========= | ========= | ========= |
Cash flows: | |||
Net repayment of loan | - | (31,283) | (25,362) |
Net drawdown of loan | 52,085 | - | - |
Bank loan interest paid 1 | (3,124) | (3,417) | (6,058) |
Bank overdraft interest paid 1 | (38) | (4) | (191) |
Movement in bank overdraft | 347 | 1,702 | 53 |
Non cash flows: | |||
Effects of foreign exchange losses/(gains) | 1,952 | (13,238) | (13,726) |
Finance costs expense 1 | 3,257 | 3,236 | 6,098 |
Debt arising from financing activities at end of period/year | |||
Bank loan | 150,688 | 91,218 | 96,651 |
Bank loan interest payable 1 | 377 | 248 | 282 |
Cash at bank - bank overdraft | 404 | 1,706 | 57 |
---------------- | ---------------- | ---------------- | |
Total | 151,469 | 93,172 | 96,990 |
| ========= | ========= | ========= |
1 Movement on interest and finance costs expense and payments on borrowings have now been included in the reconciliation above to reflect movements in financing activities.
For details of the overdraft and multi-currency loan facility, see the Liquidity Risk section in note 12 below.
11. Reserves
Pursuant to a resolution of the Company passed at an Extraordinary General Meeting on 13 January 1998 and following the Company's application to the Court for cancellation of its share premium account, Court approval was received on 27 January 1999 and £157,633,000 was transferred from the share premium account to a special reserve which is a distributable reserve.
The share premium account and capital redemption reserve of £151,493,000 and £22,779,000 respectively (30 June 2025: £151,493,000 and £22,779,000; 31 December 2025: £151,493,000 and £22,779,000) are not distributable reserves under the Companies Act 2006. In accordance with ICAEW Technical Release 02/17BL on Guidance on Realised and Distributable Profits under the Companies Act 2006, the special reserve of £167,239,000 (30 June 2025: £174,712,000; 31 December 2025: £170,033,000) and capital reserve of £1,301,993,000 (30 June 2025; £623,590,000; 31 December 2025: £1,209,936,000) of the Parent Company may be used as distributable reserves for all purposes and, in particular, the repurchase by the Parent Company of its ordinary shares and for payments such as dividends. In accordance with the Company's Articles of Association, the special reserve, capital reserve and revenue reserve may be distributed by way of dividend. The Parent Company's capital gains of £1,301,993,000 (30 June 2025: £623,590,000; 31 December 2025: £1,209,936,000) comprise a gain on the capital reserve arising on investments sold of £716,181,000 (30 June 2025: £519,349,000; 31 December 2025: £572,772,000), a gain on the capital reserve arising on revaluation of listed investments of £584,729,000 (30 June 2025: £91,786,000; 31 December 2025: £632,821,000), revaluation losses on unquoted investments of £6,598,000 (30 June 2025: £4,819,000; 31 December 2025: losses of £3,278,000) and a revaluation gain on the investment in the subsidiary of £7,681,000 (30 June 2025: £7,636,000; 31 December 2025: £7,621,000). The capital reserve arising on the revaluation of listed investments of £584,729,000 (30 June 2025: £91,786,000; 31 December 2025: £632,821,000) is subject to fair value movements and may not be readily realisable at short notice; as such it may not be entirely distributable. The reserves of the subsidiary company are not distributable until distributed as a dividend to the Parent Company. The investments are subject to financial risks; as such capital reserves (arising on investments sold) and the revenue reserve may not be entirely distributable if a loss occurred during the realisation of these investments.
As at 30 June 2026 the Parent Company's distributable reserves (excluding capital reserves on the revaluation of investments) amounted to £926,744,000 (30 June 2025: £724,613,000; 31 December 2025: £777,341,000).
12. Financial risks and valuation of financial instruments
The Company's investment activities expose it to the various types of risk which are associated with the financial instruments and markets in which it invests. The risks are substantially consistent with those disclosed in the previous annual financial statements with the exception of those outlined below.
Market risk arising from price risk
Price risk is the risk that the fair value or future cash flows of a financial instrument will fluctuate because of changes in market prices (other than those arising from interest rate risk or currency risk), whether those changes are caused by factors specific to the individual financial instrument or its issuer, or factors affecting similar financial instruments traded in the market. Local, regional or global events such as war, acts of terrorism, the spread of infectious illness or other public health issues, recessions, climate change or other events could have a significant impact on the Group and the market price of its investments and could result in increased premiums or discounts to the Company's net asset value.
Liquidity risk
The Group has a multi-currency loan facility of £350 million (30 June 2025: £200 million; 31 December 2025: £200 million) which is updated and renewed on a biennial basis. Under the loan facility, the individual loan drawdowns are taken with a three month maturity period. At 30 June 2026, the Group does not have an overdraft facility in place (30 June 2025: overdraft facility of £30 million; 31 December 2025: overdraft facility of £30 million).
At 30 June 2026, the Group had a US Dollar loan outstanding of US$200,000,000 which matures on 10 September 2026 (30 June 2025: US Dollar loan of US$125,000,000 which matured on 11 September 2025; 31 December 2025: US Dollar loan of US$130,000,000 which matured on 11 June 2026).
As per the borrowing agreements, borrowings under the overdraft and loan facilities shall at no time exceed £350 million or 25% of the Group's net asset value (whichever is the lower) (30 June 2025 and 31 December 2025: £230 million or 25% of the Group's net asset value (whichever is the lower)) and this covenant was complied with during the respective periods.
Valuation of financial instruments
Financial assets and financial liabilities are either carried in the Consolidated Statement of Financial Position at their fair value (investments and derivatives) or at an amount which is considered to be the fair value (due from brokers, dividends and interest receivable, due to brokers, accruals, cash at bank and bank overdrafts). IFRS 13 requires the Group to classify fair value measurements using a fair value hierarchy that reflects the significance of inputs used in making the measurements. The valuation techniques used by the Group are explained in the accounting policies note 2(h), as set out in the Group's Annual Report and Financial Statements for the year ended 31 December 2025. All investments are held at fair value through profit or loss. The amortised cost amounts of due from brokers, dividends and interest receivable, due to brokers, accruals, cash at bank, bank loans and bank overdrafts approximate their fair value.
Categorisation within the hierarchy has been determined on the basis of the lowest level input that is significant to the fair value measurement of the relevant asset.
The fair value hierarchy has the following levels:
Level 1 - Quoted market price for identical instruments in active markets
A financial instrument is regarded as quoted in an active market if quoted prices are readily available from an exchange, industry group, pricing service or regulatory agency and those prices represent actual and regularly occurring market transactions on an arm's length basis. The Group does not adjust the quoted price for these instruments.
Level 2 - Valuation techniques using observable inputs
This category includes instruments valued using quoted prices for similar instruments in markets that are considered less active, or other valuation techniques where all significant inputs are directly or indirectly observable from market data.
Valuation techniques used for non-standardised financial instruments such as options, currency swaps and other over-the-counter derivatives include the use of comparable recent arm's length transactions, reference to other instruments that are substantially the same, discounted cash flow analysis, option pricing models and other valuation techniques commonly used by market participants making the maximum use of market inputs and relying as little as possible on entity specific inputs.
Over-the-counter derivative option contracts have been classified as Level 2 investments as their valuation has been based on market observable inputs represented by the underlying quoted securities to which these contracts expose the Group.
Level 3 - Valuation techniques using significant unobservable inputs
This category includes all instruments where the valuation technique includes inputs not based on market data and these inputs could have a significant impact on the instrument's valuation.
This category includes instruments that are valued based on quoted prices for similar instruments where significant entity determined adjustments or assumptions are required to reflect differences between the instruments and instruments for which there is no active market. The Investment Manager considers observable data to be that market data that is readily available, regularly distributed or updated, reliable and verifiable, not proprietary, and provided by independent sources that are actively involved in the relevant market.
The level in the fair value hierarchy within which the fair value measurement is categorised in its entirety is determined on the basis of the lowest level input that is significant to the fair value measurement.
Assessing the significance of a particular input to the fair value measurement in its entirety requires judgement, considering factors specific to the asset or liability including an assessment of the relevant risks including but not limited to credit risk, market risk, liquidity risk, business risk and sustainability risk. The determination of what constitutes 'observable' inputs requires significant judgement by the Investment Manager and these risks are adequately captured in the assumptions and inputs used in measurement of Level 3 assets or liabilities.
Valuation process and techniques for Level 3 valuations
Jetti Resources, MCC Mining and Varvara Development Group
The fair value of the investment equity shares of Jetti Resources, MCC Mining and Varvara Development Group were assessed by an independent valuer with a recognised and relevant professional qualification. The valuation is carried out based on market approach using the earnings multiple and price of recent transactions. Changes in assumptions about these factors could affect the reported fair value of financial instruments in the Consolidated Statement of Financial Position and the level where the instruments are disclosed in the fair value hierarchy. To assess the significance of a particular input to the entire measurement, the external valuer performs a sensitivity analysis.
Fair values of financial assets and financial liabilities
The table below sets out fair value measurements using the IFRS 13 fair value hierarchy.
Financial assets/(liabilities) at fair value through profit or loss | Level 1 | Level 2 | Level 3 | Total |
Assets: | ||||
Equity investments | 1,756,693 | - | 26,194 | 1,782,887 |
Fixed income securities | - | 43,150 | - | 43,150 |
---------------- | ---------------- | ---------------- | ---------------- | |
Total assets | 1,756,693 | 43,150 | 26,194 | 1,826,037 |
| ========= | ========= | ========= | ========= |
Liabilities: | ||||
Derivative financial instruments - written options | (746) | - | - | (746) |
---------------- | ---------------- | ---------------- | ---------------- | |
Total | 1,755,947 | 43,150 | 26,194 | 1,825,291 |
| ========= | ========= | ========= | ========= |
Financial assets/(liabilities) at fair value through profit or loss | Level 1 | Level 2 | Level 3 | Total |
Assets: | ||||
Equity investments | 992,287 | 2,870 | 32,210 | 1,027,367 |
Fixed income securities | - | 37,021 | - | 37,021 |
Investment in contractual rights | - | - | 19,338 | 19,338 |
---------------- | ---------------- | ---------------- | ---------------- | |
Total assets | 992,287 | 39,891 | 51,548 | 1,083,726 |
| ========= | ========= | ========= | ========= |
Liabilities: | ||||
Derivative financial instruments - written options | - | (932) | - | (932) |
---------------- | ---------------- | ---------------- | ---------------- | |
Total | 992,287 | 38,959 | 51,548 | 1,082,794 |
| ========= | ========= | ========= | ========= |
Financial assets/(liabilities) at fair value through profit or loss | Level 1 | Level 2 | Level 3 | Total |
Assets: | ||||
Equity investments | 1,595,718 | - | 32,792 | 1,628,510 |
Fixed income investments | - | 46,547 | - | 46,547 |
---------------- | ---------------- | ---------------- | ---------------- | |
Total assets | 1,595,718 | 46,547 | 32,792 | 1,675,057 |
| ========= | ========= | ========= | ========= |
Liabilities: | ||||
Derivative financial instruments - written options | (349) | (10) | - | (359) |
---------------- | ---------------- | ---------------- | ---------------- | |
Total | 1,595,369 | 46,537 | 32,792 | 1,674,698 |
| ========= | ========= | ========= | ========= |
A reconciliation of fair value measurement in Level 3 is set out below.
Six months ended | Six months ended | Year ended | |
Level 3 Financial assets at fair value through profit or loss | £'000 | £'000 | £'000 |
Opening fair value | 32,792 | 58,267 | 58,267 |
Return of capital - royalty | (87) | (283) | (483) |
Additions at cost | 2,836 | 2,847 | 2,847 |
Sale of investments | - | - | (52,582) |
Total profit or loss included in net profit/(loss) on investments in the Consolidated Statement of Comprehensive Income | - | - | - |
- realised gain on investments sold | - | - | 30,868 |
- unrealised losses on assets held at the end of the period/year | (9,347) | (9,283) | (6,125) |
---------------- | ---------------- | ---------------- | |
Closing balance | 26,194 | 51,548 | 32,792 |
| ========= | ========= | ========= |
The BHP Brazil Royalty was sold on 8 December 2025 for US$70.0 million at a premium of 105% to the fair value of US$34.1 million as of 8 December 2025.
The Level 3 valuation process and techniques used are explained in the accounting policies in note 2(h) on page 100 and note 2(q) on page 101 of the Group's Annual Report and Financial Statements for the year ended 31 December 2025. A more detailed description of the techniques is found under 'Valuation process and techniques' for Level 3 valuations within the Half Yearly Financial Report.
The Level 3 investments as at 30 June 2026 in the table that follows relate to the equity shares of Jetti Resources, MCC Mining and Varvara Development Group. In accordance with IFRS 13 these investments were categorised as Level 3.
In arriving at the fair value of Jetti Resources, MCC Mining and Varvara Development Group, the key inputs are shown below.
Quantitative information of significant unobservable inputs - Level 3 - Group
The significant unobservable inputs used in the fair value measurement categorised within Level 3 of the fair value hierarchy, together with an estimated quantitative sensitivity analysis, as at 30 June 2026, 30 June 2025 and 31 December 2025 are as shown below.
Description | As at | Valuation technique | Unobservable input | Range of weighted average inputs | Reasonable possible shift1 +/ - | Impact on fair value |
£'000 | ||||||
MCC Mining | 20,629 | Market approach | Price of recent transaction | 10.0% | £2.0m | |
Varvara Development Group | 2,788 | Market approach | Price of recent transaction | 10.0% | £0.3m | |
Jetti Resources | 2,777 | Market approach | Earnings multiple | 16.0x | 10.0% | £0.3m |
---------------- | ||||||
Total | 26,194 | |||||
| ========= |
|
Description | As at | Valuation technique | Unobservable input | Range of weighted average inputs | Reasonable possible shift1 +/ - | Impact on fair value |
£'000 | ||||||
MCC Mining | 19,980 | Market approach | Price of recent transaction | 10.0% | £2.0m | |
BHP Brazil Royalty | 19,338 | Discounted
| Discount rate - weighted average cost of capital | 8.0% - 10.0% | 1.0% | £1.0m |
Average
| US$2,075 - US$3,333
| 10.0% | £2.0m | |||
Average
| US$8,500 - US$10,000
| 10.0% | £1.0m | |||
Jetti Resources | 12,230 | Market
| Earnings multiple | 17.5x | 10.0% | £1.0m |
---------------- | ||||||
Total | 51,548 | |||||
| ========= |
Description | As at 31 December 2025 £'000 | Valuation technique | Unobservable input | Range of weighted average inputs | Reasonable possible shift¹ +/- | Impact on fair value |
MCC Mining | 20,356 | Market
| Price of recent transaction | 10.0% | £2.0m | |
Jetti Resources | 12,436 | Market
| Earnings multiple | 17.5x | 10.0% | £1.2m |
---------------- | ||||||
Total | 32,792 | |||||
| ========= |
1 The sensitivity analysis refers to a percentage amount added or deducted from the input and the effect this has on the fair value.
The sensitivity impact on fair value is calculated based on the sensitivity estimates set out by the independent valuer in its report on the valuation of contractual rights. Significant increases/(decreases) in estimated commodity prices and discount rates in isolation would result in a significantly higher/(lower) fair value measurement. Generally, a change in the assumption made for the estimated value is accompanied by a directionally similar change in the commodity prices and discount rates.
For exchange listed equity investments, the quoted price is the bid price. Substantially, all investments are valued based on unadjusted quoted market prices. Where such quoted prices are readily available in an active market, such prices are not required to be assessed or adjusted for any price related risks, including climate risk, in accordance with the fair value related requirements of the Company's financial reporting framework.
13. Transactions with the Investment Manager and AIFM
BlackRock Fund Managers Limited (BFM) provides management and administration services to the Group under a contract which is terminable on six months' notice. BFM has (with the Company's consent) delegated certain portfolio and risk management services, and other ancillary services, to BlackRock Investment Management (UK) Limited (BIM (UK)). Further details of the investment management contract are disclosed in the Directors' Report on page 55 of the Annual Report and Financial Statements for the year ended 31 December 2025.
The investment management fee due for the six months ended 30 June 2026 amounted to £7,077,000 (six months ended 30 June 2025: £4,351,000; year ended 31 December 2025: £10,553,000). At the period end, £9,645,000 was outstanding in respect of the management fee (30 June 2025: £6,314,000; 31 December 2025: £6,266,000).
In addition to the above services, BIM (UK) has provided the Group with marketing services. The total fees paid or payable for these services for the period ended 30 June 2026 amounted to £90,000 excluding VAT (six months ended 30 June 2025: £61,000; year ended 31 December 2025: £161,000). Marketing fees of £80,000 were outstanding as at 30 June 2026 (30 June 2025: £64,000; 31 December 2025: £216,000).
The ultimate holding company of the Manager and the Investment Manager is BlackRock, Inc., a company incorporated in Delaware, USA.
14. Related party disclosure
During the period ended 30 June 2026, there have been no transactions with related parties which have materially affected the financial position or the performance of the Group.
Directors' emoluments
The Board consists of five non-executive Directors, all of whom are considered to be independent of the Manager by the Board. None of the Directors has a service contract with the Company. With effect from 1 January 2026, the Chairman's annual fee is £56,100 although this fee is waived and not paid. The Audit and Risk Committee Chairman receives an annual fee of £46,750, the Senior Independent Director receives an annual fee of £40,900 and each of the other Directors receives an annual fee of £37,400.
As at 30 June 2026, an amount of £18,000 was outstanding in respect of Directors' fees (30 June 2025: £15,000; 31 December 2025: £18,000).
Directors' shareholdings
At the period end members of the Board held ordinary shares in the Company as set out below:
Directors |
| 30 June | 31 December |
Charles Goodyear (Chairman) | 60,000 | 60,000 | 60,000 |
Srinivasan Venkatakrishnan | 4,000 | 2,000 | 4,000 |
Marion Sears | 10,000 | 7,000 | 7,000 |
Elisabeth Scott | 2,200 | 2,200 | 2,200 |
Guy Elliott 1 | Nil | N/a | N/a |
Judith Mosely 2 | N/a | 7,400 | 7,400 |
========= | ========= | ========= |
1 Guy Elliott was appointed as a Director on 22 May 2026.
2 Judith Mosely retired as a Director on 22 May 2026.
Since the period end and up to the date of this report there have been no other changes in Directors' holdings.
Significant Holdings
The following investors are:
a. funds managed by the BlackRock Group or are affiliates of BlackRock, Inc. (Related BlackRock Funds); or
b. investors (other than those listed in (a) above) who held more than 20% of the voting shares in issue in the Company and are, as a result, considered to be related parties to the Company (Significant Investors).
Total % of shares held by | Total % of shares held by Significant Investors who are not affiliates of BlackRock Group or BlackRock, Inc. | Number of Significant Investors who are not affiliates of BlackRock Group or BlackRock, Inc. | |
As at 30 June 2026 | 1.15 | n/a | n/a |
As at 30 June 2025 | 1.26 | n/a | n/a |
As at 31 December 2025 | 1.18 | n/a | n/a |
========= | ========= | ========= |
15. Capital commitments and contingent liabilities
There was no capital commitment as at 30 June 2026 (30 June 2025: none; 31 December 2025: none).
There were no contingent liabilities as at 30 June 2026 (30 June 2025: none; 31 December 2025: none).
16. Publication of non-statutory accounts
The financial information contained in this Half Yearly Financial Report does not constitute statutory accounts as defined in Section 435 of the Companies Act 2006. The financial information for the six months ended 30 June 2026 and 30 June 2025 has not been audited or reviewed by the Company's auditors.
The information for the year ended 31 December 2025 has been extracted from the latest published audited financial statements, which have been filed with the Registrar of Companies, unless otherwise stated. The report of the auditors on those accounts contained no qualification or statement under Sections 498(2) or (3) of the Companies Act 2006.
17. Annual results
The Board expects to announce the annual results for the year ending 31 December 2026 in March 2027.
Copies of the results announcement can be obtained from the Secretary on 020 7743 3000 or at cosec@blackrock.com. The Annual Report should be available by the beginning of March 2027, with the Annual General Meeting being held in April 2027.
ENDS
The Condensed Half Yearly Financial Report will also be available on the BlackRock website at www.blackrock.com/uk/brwm. Neither the contents of the Manager's website nor the contents of any website accessible from hyperlinks on the Manager's website (or any other website) is incorporated into, or forms part of, this announcement.
For further information, please contact:
Charles Kilner, Director - Closed End Funds, BlackRock Investment Management (UK) Limited -
Tel: 020 7743 1869
Evy Hambro, Fund Manager, BlackRock Investment Management (UK) Limited -
Tel: 020 7743 3000
Emma Phillips, Media & Communications, BlackRock Investment Management (UK) Limited -
Tel: 020 7743 2922
Press enquires:
Ed Hooper, Lansons Communications
Tel: 020 7294 3620
E-mail: BlackRockInvestmentTrusts@lansons.com or EdH@lansons.com
12 Throgmorton Avenue
London EC2N 2DL
7 September 2026

