
THE INFORMATION CONTAINED HEREIN IS NOT FOR RELEASE, PUBLICATION OR DISTRIBUTION IN OR INTO AUSTRALIA, CANADA, ITALY, DENMARK, JAPAN, THE UNITED STATES, OR TO ANY NATIONAL OF SUCH JURISDICTIONS
Neuberger Private Equity Partners Announces Results for the Six Months to 30 June 2026
St Peter Port, Guernsey 23 September 2026
Neuberger Private Equity Partners (NBPE), the $1.1bn1 listed private equity investment company managed by Neuberger, today announces its results for the six months to 30 June 2026, alongside its August monthly NAV update (available here).
Highlights
- Net Assets of $1,152 million - NAV per share of $28.00 (£21.10), a return of 1.9% in the six months
- Performance driven by 2.7% increase in private company valuations (ex-FX), alongside positive contributions from share buybacks, partially offset by the negative impact of foreign exchange and quoted holdings
- Strong portfolio company operating performance - Last twelve month (LTM) revenue and EBITDA growth of 11.1% and 12.1%2, respectively, with a number of companies seeing an acceleration of growth relative to the end of last year
- Robust exit activity - $150 million of realisations announced in the six months, with visibility of a further $68 million of proceeds from transactions yet to be announced
- Strong progress refreshing the portfolio - $104 million committed to six new investments in the six months; since June a further $60 million committed to three new investments and an additional amount in an existing 2026 investment
- A further $120 million allocated to share buybacks, bringing total allocation to share buybacks to $240 million since the start of 2025
- $62 million returned to shareholders via dividends and buybacks in the six months; a further $82 million returned to shareholders since June, taking year-to-date returns to $144 million, more than double the amount from the same period in 2025
- Well positioned to take advantage of investment opportunities with total available liquidity, including cash and borrowing capacity, of $206 million as at 30 June 2026
- David MacLellan appointed as independent Non-Executive Director and Chairman Designate, bringing 35+ years of private equity and fund management experience; will succeed the current Chairman, William Maltby, who will retire in December after approximately eight years on the Board
Peter von Lehe, Managing Director and Head of Investment Solutions and Strategy at Neuberger commented:
"NBPE delivered a NAV total return of 1.9% in the period, with meaningful gains across a number of private investments.
We have made strong progress in refreshing the portfolio and recent investments are performing well. Realisation activity has been strong year-to-date, and we continue to have good visibility on further exits, with a number of companies well positioned to capitalise on current market conditions."
Paul Daggett, Managing Director at Neuberger, continued:
"Revenue and earnings growth, both organic and through M&A, continue to be robust with the portfolio delivering LTM revenue growth of 11.1% and LTM EBITDA growth of 12.1%2, with particularly strong performance from NBPE's 10 largest investments and the 2024-2025 investment cohort.
We are encouraged by the positive momentum we are seeing in the portfolio, as well as overall private equity markets, and believe the portfolio is well-positioned to navigate the economic environment and capitalise on attractive new investment opportunities."
For further information, please contact:
NBPE Investor Relations +44 (0) 20 3214 9002
Luke Mason NBPrivateMarketsIR@nb.com
Teneo +44 (0) 20 7260 2700
Tom Murray NBPE@teneo.com
Rob Yates
Jessica Pine
Chairman's statement for the six months to 30 June 2026
NBPE's NAV per share total return for the six months ended 30 June 2026 was 1.9% (3.4% in GBP). This was predominantly driven by private portfolio companies (94% of the portfolio), which generated a return of 2.7% on a constant currency basis, with meaningful gains across a number of private investments. Portfolio returns were further enhanced by share buybacks. Against this, performance of the quoted holdings and negative foreign exchange adjustments detracted from returns marginally in the six months. The quoted portfolio has since recovered strongly, and NBPE's NAV total return for the eight months to 31 August 2026 was 4.2% (3.5% in GBP).
Portfolio performing well with robust operating performance
NBPE's portfolio of private companies is performing well with valuation gains driven by strong operating performance. Over the last twelve months (LTM), NBPE's private companies have generated weighted average LTM revenue and LTM EBITDA growth of 11.1% and 12.1% respectively2. The top 10 holdings (42% of value), continue to drive meaningful value for the portfolio with strong operating performance. More broadly, momentum has extended across the wider portfolio with robust operating performance and several of these companies delivered double-digit revenue and EBITDA growth. Overall performance was driven by underlying operating performance and positive contributions from exits, partially tempered by certain more mature companies.
Encouragingly, the more recent 2024 investment cohort continues to perform well. The first sale from this group of investments, FDH Aero, a global supply chain solutions partner for aerospace and defence companies, was announced in the period, generating a highly attractive multiple of cost and a material uplift to carrying value. This is a good example of the strong returns from shorter term holding periods that can be achievable via the mid-life investment approach.
Significant increase in liquidity with potential for additional exits
2026 is developing into a strong year for realisations. During the first half of the year $150 million of realisations were announced, which compares to $86 million for the same period in 2025. Neuberger has visibility on a further $68 million of proceeds from portfolio realisations yet to be announced and which are expected to close in the coming months. Taken together this is anticipated to take proceeds to $218 million for 2026 (year-to-date), a material increase on 2025 ($180 million). Over the last three years, proceeds received from the portfolio as a percentage of opening value have averaged 13.5%. Proceeds in 2026 are anticipated to reach at least 18%, materially higher than this average. NBPE continues to have a number of 'exit ready' companies in the portfolio, supporting the prospect of additional realisations in the next 6-12 months.
Strong progress in refreshing the portfolio with $164 million committed to nine new investments year-to-date
NBPE committed $104 million to six new investments in the first half of the year. Three of the new commitments were to growth equity investments to take advantage of the strong opportunities in AI-related investment themes. In keeping with Neuberger's disciplined approach to risk, these positions were deliberately sized to take a measured approach to the opportunity. While early, we are pleased with the performance of the new 2026 investments to date.
Since June 2026, a further $60 million has been committed to three new investments which are expected to close in the fourth quarter and an additional amount invested in an existing 2026 portfolio company, which would take the total capital committed to investments made from the beginning of 2024 to 27% of the portfolio.
$62 million returned to shareholders in the first six months, with a further $120 million committed to share buybacks
We have complemented the portfolio refresh with capital returns to shareholders through dividends and accretive share repurchases, which have continued at a robust pace.
NBPE returned $62 million to shareholders via dividends and share buybacks in the first six months of 2026. Since June, we have maintained an increased level of buybacks and paid a further $20 million dividend, taking the year-to-date capital returned to $144 million3 (11.9% of opening NAV) which compares to $62 million for the same period in 2025.
In June we allocated a further $120 million to share buybacks, bringing our total allocation to share buybacks to $240 million since the beginning of 2025. Of this, $164 million3 has been deployed, repurchasing a total of 8.3 million shares at a weighted average discount of 28%, adding $1.55 per share to NAV, or 5.6%. We believe the share price continues to undervalue the portfolio and its prospects.
Balance sheet remains strong while continuing to deploy capital
Of the $150 million of announced realisations, approximately $87 million of proceeds were received during the first half. At 30 June 2026, NBPE's total available liquidity was $206 million ($31 million of cash and $175 million of available borrowing capacity), an investment level of 109%. While the investment level is expected to fluctuate depending on the timing of realisations, the Board currently expects it to be between 110% - 120% in the short to medium term, as the Company takes advantage of an attractive pipeline of co-investment opportunities and accretive share buybacks. The Board expects the investment level to return to the long-term average of about 110% as distributions from the portfolio accelerate.
The Board remains focused on maintaining balance sheet strength and the pace of new investments will continue to be balanced with distributions from the portfolio and returns of capital to shareholders.
Sentiment remains subdued in the listed private equity sector
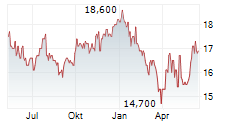
On a total return basis, the share price declined by 6.1% year-to-date3, partially recovering from the broad sell-off in the first quarter which was driven by concerns over AI's potential near-term impact on software businesses and geopolitical uncertainty. Nevertheless, the shares continue to trade at a significant discount to NAV, which the Board believes is unjustified.
The sector has faced persistent headwinds over the last few years: NAV performance has been subdued, exit activity has not sustained a meaningful recovery and discounts across the sector have remained wide. NBPE has not been immune to this, and the Board recognises that the Company's overall NAV and share price performance remain below long-term averages and investor expectations. Delivering stronger NAV growth remains central to improving the Company's rating and narrowing the discount.
Board succession
As part of our Board succession planning, David MacLellan joins the Board with effect from 23 September 2026 as an independent Non-Executive Director and Chairman Designate. He will succeed me as Chairman on 11 December 2026. David brings more than 35 years of experience in private equity and fund management, and a wealth of investment trust experience, to the Board. I look forward to working closely with him ahead of my retirement after almost eight years on the Board and more than seven years as Chairman.
Outlook
We continue to explore opportunities to drive performance and deliver shareholder value and remain focused on generating returns that will underpin an improvement in NBPE's rating and deliver sustainable share price growth over time.
Realisation activity has been strong and we continue to have good visibility on further realisations. Despite continued macroeconomic and geopolitical uncertainty, we are optimistic about the portfolio's prospects for the second half of the year.
We have a strong balance sheet, a differentiated investment model that provides NBPE with the flexibility to balance investment and capital returns to shareholders, and a high-quality portfolio that is performing well. As announced at NBPE's 2025 Capital Markets Day and reaffirmed in June, we have made strong progress in refreshing the portfolio, with investments made since 2024 now representing 27% of the portfolio (including pending investments). We expect these investments to be a key driver of medium- to long-term NAV growth.
In closing, I would like to express my thanks to shareholders for their ongoing support over the years. It has been a privilege to serve as Chairman, and I look forward to following the Company's success in the years ahead.
William Maltby
Chairman
22 September 2026
Manager's Commentary
Overview
Overall, NBPE's second quarter private valuations reflected a more positive environment, particularly relative to the more difficult start to the year driven by geopolitical uncertainty and AI software concerns. While a sustained recovery has been elusive over the last several quarters, we are seeing optimistic signs and our outlook for the second half of the year has improved over the last several months. Of course, the environment is not without its challenges, and we continue to monitor portfolio company developments closely. We believe the portfolio continues to perform well on an operating basis, and several meaningful exit events closed or were announced in the first half of the year. We believe there is the potential for further exits from the portfolio in the short to medium term based on both a bottom-up portfolio analysis and top-down macro perspective.
Operating performance remains strong across the portfolio driving broad based valuation increases
The portfolio's largest companies continue to drive meaningful value, with the top 10 largest investments appreciating in value by 8.3% ($43 million). This was further supported by value increases across the remaining portfolio, with the next 20 largest companies increasing in value by 2.9% ($14 million) in aggregate; this group of companies includes several recent investments which remain at cost. Together the top 30 companies represent 80% of the portfolio. After several quarters with uneven value increases, in the second quarter there was a broadening of valuation increases across numerous investments in the portfolio, including several of NBPE's longer held assets. We are also seeing encouraging performance from NBPE's 2026 investments, which are valued at 1.1x cost in aggregate. We believe these relatively broad-based value increases are an encouraging sign for the portfolio and reflect a sustained level of operating performance at many of the underlying companies. Partially offsetting this performance were aggregate net value declines of $25 million. Of the companies marked down in the first half of 2026, five accounted for approximately 70% of the aggregate decline in value. The drivers behind these markdowns varied including slower growth and softer earnings, delays in realising cost savings, lower trading comparables, multiple contraction and one company which underwent a financial restructuring.
On an LTM basis, weighted average revenue and EBITDA growth across the portfolio were approximately 11.1% and 12.1%2, respectively, with a number of companies seeing an acceleration of growth relative to last year. NBPE's top 10 companies - representing 42% of fair value - were a significant contributor to overall performance, with weighted average LTM revenue and LTM EBITDA growth of 15.7% and 15.5%4, respectively. Within this sub-set, there was strong performance from several positions including Action, Solenis, FDH Aero, Monroe Engineering and True Potential as a result of organic growth and M&A, benefits from previous business investments aimed at driving growth, and operating leverage. Similarly, NBPE's 2024 investment cohort also continues this trend, generating weighted average LTM revenue and LTM EBITDA growth of 14.5% and 15.7%5, respectively.
Encouragingly, several of our 2026 investments are already delivering positive momentum from operating performance, notwithstanding the early stage of the value creation initiatives and we are encouraged by their prospects. These investments have been held for less than one year and are therefore not yet included in the portfolio growth rate metrics.
Stable valuation and leverage multiples
As of 30 June 2026, the weighted average EV/EBITDA multiple was 15.3x6, which was in line with December 2025. The portfolio continues to be within a range of 15x - 16x generally, which we have seen over a number of quarters now. Leverage multiples remain reasonable at 5.1x6, on a weighted average basis. This leverage multiple has declined since December 2025, despite several companies increasing leverage on an absolute basis to fund M&A and other growth initiatives. We are beginning to see signs of these initiatives flowing through in terms of EBITDA growth, and as a result, have not seen a meaningful increase in leverage multiples, as EBITDA growth has offset the higher levels of debt.
Robust realisation activity driven by multiple exit routes
Following an uncertain first quarter driven by geopolitical events and AI-related concerns around software investments, we saw momentum in realisations building in the second quarter, with a total of $150 million of realisations (12% of opening value) announced.
A number of transaction types have driven realisations this year, including full exits, sales to continuation vehicles, partial sales, and recapitalisations. Meaningful drivers of liquidity this year include the full sale of FDH Aero, partial realisation of Osaic and full exit of Solace, both through continuation vehicle transactions, as well as the full exit from one undisclosed healthcare company. There have also been a number of smaller partial exits throughout the year.
Taken together, the full and partial exits, including sales to continuation vehicles (which often occur at discounts to recent carrying value), have generated a 3.1x multiple of invested capital (inclusive of unrealised value) and an uplift of 6% to the value three quarters prior to an announced transaction.
We have visibility on a further $68 million of proceeds from portfolio realisations yet to be announced, expected to close in the coming months. This would take proceeds to $218 million for 2026 (year-to-date). NBPE continues to hold a number of "exit ready" companies in the portfolio and we believe additional sales remain possible in the second half.
Strong progress on portfolio refresh
We remain highly focused on refreshing the portfolio, which we expect to be the key driver of medium to long-term NAV growth.
During the first half, NBPE committed $104 million to six new investments. Three of these ($50 million invested in total) are AI-theme related growth equity investments, in fast-growing, highly attractive, companies. We believe AI represents a compelling secular growth driver, and these investments offer targeted exposure to that theme. Each company has a strong financial profile, but given their earlier stage, individual investments have been sized between 0.8% - 2.0% of fair value, reflecting a measured approach to risk.
In addition to these three investments, we have made a further three investments in Conservice ($9 million), Ryan ($35 million) and Vinted ($11 million). Conservice, alongside TPG, is the #1 utility management and billing platform for U.S. property managers, offering highly recurring, mission-critical revenue underpinned by growing demand for utility transparency and payment automation; Ryan, alongside Onex and Ares is a market-leading global tax services provider, benefitting from strong client retention, significant margin expansion and M&A upside across its scaled international footprint. Finally, Vinted, alongside EQT is a market leading European online second-hand consumer marketplace.
We believe each of these investments were attractive opportunities to invest in leading businesses with strong market positions, supported by resilient demand drivers and tailwinds. In each case, we partnered with leading private equity sponsors and management teams that we believe have developed strong value creation plans.
Since June, we have committed $49 million to three more new investments and invested an additional amount in one 2026 transaction, taking total new commitments year-to-date to $164 million. We are continuing to evaluate several other attractive opportunities in the pipeline and believe we have good visibility on additional commitments before year end. With the possibility of additional investments in the fourth quarter, we are on track for 2026 investments to constitute a mid-teens percentage of the total portfolio by year end.
Importantly, this pace of new deployment is being balanced against continued realisation activity and visibility of exits. One of the key benefits of NBPE's model is the flexibility it allows to build the portfolio from the bottom up, recycling proceeds to fund attractive new opportunities while maintaining portfolio discipline as well as returns of capital to shareholders.
Outlook
NBPE has a high-quality investment portfolio supported by strong operating performance. Encouragingly, for the first time in several quarters, we saw a broadening of valuation increases across the portfolio, with a number of older investments delivering write-ups and contributing meaningfully to overall NAV growth. Our recent investments in 2024 and 2025 are performing well, with 25% gross IRRs in aggregate, underpinned by strong operating momentum across the cohort. The announced sale of FDH Aero, a 2024 vintage investment, is a great example from this cohort and more broadly of the quality of assets we are underwriting today.
Despite the continued uncertainty in the macro-economic and geopolitical environment, we enter the second half with optimism. We are encouraged by the positive momentum we are seeing in the portfolio, as well as overall private equity markets, and believe the portfolio is well-positioned to navigate the environment and to capitalise on new investment opportunities.
Neuberger
22 September 2026
Statement of principal risks and uncertainties
The principal risks and uncertainties of the Company include external risks, investment and strategic risks, financial risks and operational risks. These risks, and the way in which they are managed, are described in more detail under the heading 'Risk Management and Principal Risks' in the Company's annual report for the year ended 31 December 2025. The Company's principal risks and uncertainties have not changed overall since the date of that report; however, the Board has identified heightened risk related to the Company's share price discount to NAV, the overall economic and investment environment as well as sovereign and geo-political factors, which could impact investment valuations in future periods. The Board continues to discuss and evaluate efforts taken over time to address the discount including buybacks, the investor relations programme, shareholder engagement and communication, and capital allocation. The Board monitors the Company's discount in conjunction with these efforts.
Statement of directors' responsibilities
The directors confirm that to the best of our knowledge:
- the unaudited interim consolidated financial statements have been prepared in conformity with U.S. generally accepted accounting principles, as required by DTR 4.2.4R of the Disclosure Guidance and Transparency rules;
- the Interim Financial Report and Consolidated Financial Statements meets the requirements of an interim financial report, together with the statement of principal risks and uncertainties above, includes a fair review of the information required by DTR 4.2.7R and DTR 4.2.8R of the Disclosure Guidance and Transparency Rules and includes:
(a) an indication of important events that have occurred during the first six months of the financial year and their impact on the financial statements; and a description of the principal risks and uncertainties for the remaining six months of the year; and
(b) a description of related party transactions that have taken place in the first six months of the current financial year and that have materially affected the financial position or performance of the Company during that period; and any changes in the related party transactions described in the last annual report that could do so. Please refer to Note 8 of the unaudited interim consolidated financial statements.
The directors are responsible for the maintenance and integrity of the corporate and financial information included on the Company's website, and for the preparation and dissemination of financial statements. Legislation in Guernsey governing the preparation and dissemination of financial statements may differ from legislation in other jurisdictions.
By order of the Board
William Maltby
Chairman
Pawan Dhir
Director
Date: 22 September 2026
Independent Review Report to Neuberger Private Equity Partners Limited
Conclusion
We have been engaged by Neuberger Private Equity Partners Limited (the "Company") to review the consolidated financial statements in the half-yearly financial report for the six months ended 30 June 2026 of the Company and its subsidiaries (together, the "Group"), which comprises the consolidated balance sheet, consolidated condensed schedule of investments, consolidated statement of operations and changes in net assets, consolidated statement of cash flows and the related explanatory notes.
Based on our review, nothing has come to our attention that causes us to believe that the consolidated financial statements in the half-yearly financial report for the period ended 30 June 2026 do not give a true and fair view of the financial position of the Group as at 30 June 2026 and of its financial performance and its cash flows for the six month period then ended, in accordance with U.S. generally accepted accounting principles and the Disclosure Guidance and Transparency Rules ("the DTR") of the UK's Financial Conduct Authority ("the UK FCA").
Scope of review
We conducted our review in accordance with International Standard on Review Engagements (UK) 2410 Review of Interim Financial Information Performed by the Independent Auditor of the Entity ("ISRE (UK) 2410") issued by the Financial Reporting Council for use in the UK. A review of interim financial information consists of making enquiries, primarily of persons responsible for financial and accounting matters, and applying analytical and other review procedures. We read the other information contained in the half-yearly financial report and consider whether it contains any apparent misstatements or material inconsistencies with the information in the consolidated financial statements.
A review is substantially less in scope than an audit conducted in accordance with International Standards on Auditing (UK) and consequently does not enable us to obtain assurance that we would become aware of all significant matters that might be identified in an audit. Accordingly, we do not express an audit opinion.
- Conclusions relating to going concern
Based on our review procedures, which are less extensive than those performed in an audit as described in the Scope of review section of this report, nothing has come to our attention to suggest that the directors have inappropriately adopted the going concern basis of accounting or that the directors have identified material uncertainties relating to going concern that are not appropriately disclosed.
This conclusion is based on the review procedures performed in accordance with ISRE (UK) 2410. However future events or conditions may cause the Group and the Company to cease to continue as a going concern, and the above conclusions are not a guarantee that the Group and the Company will continue in operation.
Directors' responsibilities
The half-yearly financial report is the responsibility of, and has been approved by, the directors. The directors are responsible for preparing the interim financial report in accordance with the DTR of the UK FCA.
The consolidated financial statements included in this interim report have been prepared in accordance with U.S. generally accepted accounting principles.
In preparing the half-yearly financial report, the directors are responsible for assessing the Group and the Company's ability to continue as a going concern, disclosing, as applicable, matters related to going concern and using the going concern basis of accounting unless liquidation is imminent.
Our responsibility
Our responsibility is to express to the Company a conclusion on the consolidated financial statements in the half-yearly financial report based on our review. Our conclusion, including our conclusions relating to going concern, are based on procedures that are less extensive than audit procedures, as described in the scope of review paragraph of this report.
The purpose of our review work and to whom we owe our responsibilities
This report is made solely to the Company in accordance with the terms of our engagement letter to assist the Company in meeting the requirements of the DTR of the UK FCA. Our review has been undertaken so that we might state to the Company those matters we are required to state to it in this report and for no other purpose. To the fullest extent permitted by law, we do not accept or assume responsibility to anyone other than the Company for our review work, for this report, or for the conclusions we have reached.
Rachid Frihmat
For and on behalf of KPMG Audit Limited
Chartered Accountants
Guernsey
22 September 2026
| Assets | 2026 | 2025 | ||||||
| Investments at fair value: | ||||||||
| Private equity investments | ||||||||
| Cost of $743,341,581 at 30 June 2026 and $666,290,248 at 31 December 2025 | $ 1,253,924,919 | $ 1,212,056,079 | ||||||
| Government obligations | ||||||||
| Cost of $0 at 30 June 2026 and $18,892,411 at 31 December 2025 | - | 18,899,541 | ||||||
| Cash and cash equivalents | 31,405,740 | 72,660,533 | ||||||
| Other assets | 1,668,031 | 1,604,340 | ||||||
| Distributions and sales proceeds receivable from investments | - | 2,939,142 | ||||||
| Total assets | $ 1,286,998,690 | $ 1,308,159,635 | ||||||
| Liabilities and share capital | ||||||||
| Liabilities: | ||||||||
| Credit facility loan | $ 125,000,000 | $ 90,000,000 | ||||||
| Payables to Investment Manager and affiliates | 4,602,523 | 4,436,892 | ||||||
| Accrued expenses and other liabilities | 3,294,455 | 2,188,216 | ||||||
| Net deferred tax liability | 40,412 | 40,412 | ||||||
| Total liabilities | $ 132,937,390 | $ 96,665,520 | ||||||
| Share capital: | ||||||||
| Class A Shares, $0.01 par value, 500,000,000 shares authorised, | ||||||||
| 44,282,396 shares issued and 41,131,988 shares outstanding at 30 June 2026 | $ 442,824 | $ 464,309 | ||||||
| 46,430,904 shares issued and 43,280,496 shares outstanding at 31 December 2025 | ||||||||
| Class B Shares, $0.01 par value, 100,000 shares authorised, | ||||||||
| 10,000 shares issued and outstanding | 100 | 100 | ||||||
| Additional paid-in capital | 384,475,235 | 426,490,152 | ||||||
| Retained earnings | 776,272,556 | 791,683,552 | ||||||
| Less cost of treasury stock purchased (3,150,408 shares) | (9,248,460) | (9,248,460) | ||||||
| Total net assets of the controlling interest | $ 1,151,942,255 | $ 1,209,389,653 | ||||||
| Net assets of the non-controlling interest | $ 2,119,045 | $ 2,104,462 | ||||||
| Total net assets | $ 1,154,061,300 | $ 1,211,494,115 | ||||||
| Total liabilities and net assets | $ 1,286,998,690 | $ 1,308,159,635 | ||||||
| Net asset value per share for Class A Shares and Class B Shares | $ 28.00 | $ 27.94 | ||||||
| Net asset value per share for Class A Shares and Class B Shares (GBP) | £ 21.10 | £ 20.77 | ||||||
The accompanying notes are an integral part of the consolidated financial statements.
| Unfunded | Private Equity (1) | |||||||||||||||||||||||
| Private equity investments | Cost | Fair Value | Commitment | Exposure | ||||||||||||||||||||
| 2026 | ||||||||||||||||||||||||
| Direct equity investments | ||||||||||||||||||||||||
| NB Alternatives Direct Co-investment Programme A | $ 15,269,554 | $ 3,902,698 | $ 16,970,864 | $ 20,873,562 | ||||||||||||||||||||
| NB Alternatives Direct Co-investment Programme B | 53,027,600 | 117,650,409 | 14,429,744 | 132,080,153 | ||||||||||||||||||||
| Renaissance Programmes | 13,427,926 | 26,585,525 | 4,905,179 | 31,490,704 | ||||||||||||||||||||
| Marquee Brands | 26,426,845 | 35,495,227 | 3,410,816 | 38,906,043 | ||||||||||||||||||||
| Direct equity investments(2)(3) | 621,535,016 | 1,051,593,821 | 9,650,868 | 1,061,244,689 | ||||||||||||||||||||
| Total direct equity investments | $ 729,686,941 | $ 1,235,227,680 | $ 49,367,471 | $ 1,284,595,151 | ||||||||||||||||||||
| Income Investments | ||||||||||||||||||||||||
| NB Credit Opportunities Programme | $ 9,298,817 | $ 14,659,305 | $ 738,452 | $ 15,397,757 | ||||||||||||||||||||
| Total income investments | $ 9,298,817 | $ 14,659,305 | $ 738,452 | $ 15,397,757 | ||||||||||||||||||||
| Fund investments | $ 4,355,823 | $ 4,037,934 | $ 889,779 | $ 4,927,713 | ||||||||||||||||||||
| Total investments | $ 743,341,581 | $ 1,253,924,919 | $ 50,995,702 | $ 1,304,920,621 | ||||||||||||||||||||
| 2025 | ||||||||||||||||||||||||
| Direct equity investments | ||||||||||||||||||||||||
| NB Alternatives Direct Co-investment Programme A | $ 18,247,777 | $ 7,920,024 | $ 16,970,864 | $ 24,890,888 | ||||||||||||||||||||
| NB Alternatives Direct Co-investment Programme B(3) | 57,270,843 | 125,432,001 | 15,569,677 | 141,001,678 | ||||||||||||||||||||
| Renaissance Programmes | 12,033,032 | 27,160,881 | 8,045,740 | 35,206,621 | ||||||||||||||||||||
| Marquee Brands | 26,467,701 | 32,911,873 | 3,410,816 | 36,322,689 | ||||||||||||||||||||
| Direct equity investments(2)(3) | 538,284,359 | 1,000,182,501 | 13,785,702 | 1,013,968,203 | ||||||||||||||||||||
| Total direct equity investments | $ 652,303,712 | $ 1,193,607,280 | $ 57,782,799 | $ 1,251,390,079 | ||||||||||||||||||||
| Income Investments | ||||||||||||||||||||||||
| NB Credit Opportunities Programme | $ 9,298,817 | $ 14,630,426 | $ 738,464 | $ 15,368,890 | ||||||||||||||||||||
| Total income investments | $ 9,298,817 | $ 14,630,426 | $ 738,464 | $ 15,368,890 | ||||||||||||||||||||
| Fund investments | $ 4,687,719 | $ 3,818,373 | $ 893,473 | $ 4,711,846 | ||||||||||||||||||||
| Total investments | $ 666,290,248 | $ 1,212,056,079 | $ 59,414,736 | $ 1,271,470,815 | ||||||||||||||||||||
| (1): Private equity exposure is the sum of fair value and unfunded commitment. | ||||||||||||||||||||||||
| (2): Includes direct equity investments into companies and co-investment vehicles. | ||||||||||||||||||||||||
| (3):This includes investment(s) above 5% of net asset value (see Note 3). | ||||||||||||||||||||||||
The accompanying notes are an integral part of the consolidated financial statements.
| Investment Description | Geography | Industry | Cost | Fair Value | |||
2026
As of 30 June 2026, the Group did not hold any securities classified as government obligations.
| 2025 | |||||||||
| Government obligations | |||||||||
| Treasury Bill 0% 2/24/2026 | USA | Sovereign | $ 18,892,411 | $ 18,899,541 | |||||
| Total government obligations | $ 18,892,411 | $ 18,899,541 | |||||||
The accompanying notes are an integral part of the consolidated financial statements.
| Fair Value | Fair Value | |||||||
| Geographic diversity of private equity investments (1) | 2026 | 2025 | ||||||
| North America | $ 958,571,329 | $ 926,863,593 | ||||||
| Europe | 291,569,129 | 281,538,359 | ||||||
| Asia / rest of world | 3,784,461 | 3,654,127 | ||||||
| $ 1,253,924,919 | $ 1,212,056,079 | |||||||
| Industry diversity of private equity investments (2) | 2026 | 2025 | ||||||
| Industrials | 22.4% | 21.9% | ||||||
| Technology / IT | 17.5% | 16.4% | ||||||
| Business services | 16.8% | 13.6% | ||||||
| Consumer | 16.2% | 16.6% | ||||||
| Financial services | 13.5% | 15.8% | ||||||
| Healthcare | 8.3% | 9.1% | ||||||
| Communications / media | 2.0% | 3.2% | ||||||
| Transportation | 1.3% | 1.4% | ||||||
| Diversified / undisclosed / other | 1.3% | 1.4% | ||||||
| Energy | 0.7% | 0.6% | ||||||
| 100.0% | 100.0% | |||||||
| Asset class diversification of private equity investments (3) | 2026 | 2025 | ||||||
| Direct Equity Investments | ||||||||
| Mid-cap buyout | 47.0% | 51.8% | ||||||
| Large-cap buyout | 34.8% | 32.7% | ||||||
| Special situation | 11.6% | 11.3% | ||||||
| Growth equity | 5.4% | 2.9% | ||||||
| Income investments | 1.2% | 1.2% | ||||||
| Growth / venture funds | 0.0% | 0.1% | ||||||
| 100.0% | 100.0% | |||||||
| (1): | Geography is determined by location of the headquarters of the underlying portfolio companies in funds and direct co-investments. | |||||||
| A portion of our fund investments may relate to cash or other assets or liabilities that they hold and for which we do not have adequate | ||||||||
| information to assign a geographic location. | ||||||||
| (2): | Industry diversity is based on underlying portfolio companies and direct co-investments which may be held through either | |||||||
| co-investments or Neuberger-managed vehicles. Percentages are calculated based on the total portfolio value. | ||||||||
| (3): | Asset class diversification is based on the net asset value of underlying fund investments and co-investments. Percentages are | |||||||
| calculated based on the total portfolio value. | ||||||||
The accompanying notes are an integral part of the consolidated financial statements.
| 2026 | 2025 | ||||
| Interest and dividend income (net of foreign withholding taxes of $0 for 2026 and $17,558 for 2025) | $ 158,895 | $ 913,335 | |||
| Expenses | |||||
| Investment management and services | $ 9,211,875 | $ 9,321,556 | |||
| Credit facility finance costs | 4,425,282 | 4,134,679 | |||
| Administration and professional fees | 2,721,673 | 2,694,299 | |||
| Total expenses | $ 16,358,830 | $ 16,150,534 | |||
| Management fee offset | (157,517) | - | |||
| Net expenses | $ 16,201,313 | $ 16,150,534 | |||
| Net investment loss | $ (16,042,418) | $ (15,237,199) | |||
| Tax expense (benefit) | (7,864) | 35,320 | |||
| Net investment loss after taxes | $ (16,034,554) | $ (15,272,519) | |||
| Realised and unrealised gains | |||||
| Net realised gain on investments | $ 56,102,673 | $ 27,680,513 | |||
| Net change in unrealised gain (loss) on investments, | |||||
| net of tax expense of $0 for 2026 and $0 for 2025 | (35,189,621) | 31,205,775 | |||
| Net realised and change in unrealised gain | $ 20,913,052 | $ 58,886,288 | |||
| Net increase in net assets resulting from operations | $ 4,878,498 | $ 43,613,769 | |||
| Less net increase in net assets resulting from operations | |||||
| attributable to the non-controlling interest | (14,583) | (53,585) | |||
| Net increase in net assets resulting from operations | |||||
| attributable to the controlling interest | $ 4,863,915 | $ 43,560,184 | |||
| Net assets at beginning of period attributable to the controlling interest | $1,209,389,653 | $1,273,298,248 | |||
| Less dividend payment | (20,274,911) | (21,732,383) | |||
| Less cost of stock repurchased and cancelled (2,148,508 shares for 2026 and 739,509 shares for 2025) | (42,036,402) | (14,499,143) | |||
| Net assets at end of period attributable to the controlling interest | $1,151,942,255 | $1,280,626,906 | |||
| Earnings per share for Class A Shares and Class B Shares of the controlling interest | $ 0.11 | $ 0.95 | |||
| Earnings per share for Class A Shares and Class B Shares of the controlling interest (GBP) | £ 0.08 | £ 0.73 | |||
The accompanying notes are an integral part of the consolidated financial statements.
| 2026 | 2025 | ||||||
| Cash flows from operating activities: | |||||||
| Net increase in net assets resulting from operations | |||||||
| attributable to the controlling interest | $ 4,863,915 | $ 43,560,184 | |||||
| Net increase in net assets resulting from operations | |||||||
| attributable to the non-controlling interest | 14,583 | 53,585 | |||||
| Adjustments to reconcile net increase in net assets resulting from operations | |||||||
| to net cash used in operating activities: | |||||||
| Net realised gain on investments | (56,102,673) | (27,680,513) | |||||
| Net change in unrealised (gain) loss on investments, net of tax expense | 35,189,621 | (31,205,775) | |||||
| Contributions to private equity investments | (4,589,766) | (2,148,907) | |||||
| Purchases of private equity investments | (103,783,624) | (5,915,852) | |||||
| Distributions from private equity investments | 33,501,898 | 19,281,800 | |||||
| Proceeds from sale of private equity investments | 56,861,987 | 41,147,378 | |||||
| Purchases of government obligations | (18,803,251) | (74,640,210) | |||||
| Proceeds from sale of government obligations | 37,822,574 | 17,916,020 | |||||
| In-kind payment of interest income and change in accrued interest | (126,923) | (485,548) | |||||
| Amortisation of finance costs | 131,196 | 131,196 | |||||
| Change in other assets | (194,887) | (127,501) | |||||
| Change in payables to Investment Manager and affiliates | 165,631 | 80,172 | |||||
| Change in current tax liability | - | (2,208) | |||||
| Change in accrued expenses and other liabilities | 1,106,239 | 269,737 | |||||
| Net cash used in operating activities | $ (13,943,480) | $ (19,766,442) | |||||
| Cash flows from financing activities: | |||||||
| Dividend payment | $ (20,274,911) | $ (21,732,383) | |||||
| Stock repurchased and cancelled | (42,036,402) | (14,499,143) | |||||
| Borrowings from credit facility | 35,000,000 | - | |||||
| Net cash used in financing activities | $ (27,311,313) | $ (36,231,526) | |||||
| Net decrease in cash and cash equivalents | $ (41,254,793) | $ (55,997,968) | |||||
| Cash and cash equivalents at beginning of period | 72,660,533 | 72,758,539 | |||||
| Cash and cash equivalents at end of period | $ 31,405,740 | $ 16,760,571 | |||||
| Supplemental cash flow information | |||||||
| Credit facility financing costs paid | $ 4,271,473 | $ 3,987,390 | |||||
| Taxes paid | $ 53,984 | $ 77,659 | |||||
| Taxes refunded | $ 61,848 | $ 40,130 | |||||
The accompanying notes are an integral part of the consolidated financial statements.
Note 1 - Description of the Group
Neuberger Private Equity Partners Limited (the "Company") is a closed-ended investment company registered in Guernsey. Effective 11 June 2026, the Company changed its legal name from NB Private Equity Partners Limited to Neuberger Private Equity Partners Limited. The registered office is Oak House, Hirzel Street, St. Peter Port, Guernsey, GY1 2NP. The principal activity of the Company and its subsidiaries, collectively (the "Group") is to invest in direct private equity investments by co-investing alongside leading private equity sponsors in their core areas of expertise. The Company's Class A Shares are listed and admitted to trading on the Main Market of the London Stock Exchange ("Main Market") under the symbols "NBPE" and "NBPU" corresponding to Sterling and U.S. dollar quotes, respectively.
The Group is managed by NB Alternatives Advisers LLC ("Investment Manager"), a subsidiary of Neuberger Berman Group LLC ("NBG"), pursuant to an Investment Management Agreement. The Investment Manager serves as the registered investment adviser under the Investment Advisers Act of 1940.
Note 2 - Summary of Significant Accounting Policies
Basis of Presentation
These consolidated financial statements of the financial position, profit or loss and cash flows and have been prepared in conformity with U.S. generally accepted accounting principles ("U.S. GAAP") and are in compliance with the Companies (Guernsey) Law, 2008 (as amended). All adjustments considered necessary for the fair presentation of the consolidated financial statements for the periods presented have been included. These consolidated financial statements are presented in U.S. dollars.
The Group is an investment company and follows the accounting and reporting guidance in the Financial Accounting Standards Board ("FASB") Accounting Standards Codification ("ASC") Topic 946, Financial Services - Investment Companies. Accordingly, the Group reflects its investments on the Consolidated Balance Sheets at their estimated fair values, with unrealised gains and losses resulting from changes in fair value reflected in Net change in unrealised gain (loss) on investments in the Consolidated Statements of Operations and Changes in Net Assets. The Group does not consolidate majority-owned or controlled portfolio companies. The Group does not provide any financial support to any of its investments beyond the investment amount to which it committed.
The Directors considered that it is appropriate to adopt a going concern basis of accounting in preparing the consolidated financial statements. In reaching this assessment, the Directors have considered a wide range of information relating to present and future conditions including the balance sheets, future projections, cash flows and the longer-term strategy of the business.
Note 2 - Summary of Significant Accounting Policies (Continued)
Principles of Consolidation
The consolidated financial statements include accounts of the Company consolidated with the accounts of all its subsidiaries in which it holds a controlling financial interest as of the financial statement date. All inter-group balances have been eliminated.
The Company's partially owned subsidiary, NB PEP Investments, LP (incorporated) is incorporated in Guernsey.
The Company's wholly-owned subsidiaries, NB PEP Holdings Limited, NB PEP Investments I, LP, NB PEP Investments LP Limited and NB PEP Investments Limited are incorporated in Guernsey.
The Company's wholly-owned subsidiary, NB PEP Investments DE, LP is incorporated in Delaware and operates in the United States.
Use of Estimates and Judgements
The preparation of the consolidated financial statements in conformity with U.S. GAAP requires the Directors to make estimates and judgements that affect the reported amounts of certain assets and liabilities and disclosure of contingent assets and liabilities at the date of the consolidated financial statements and the reported amounts of revenues and expenses during the reporting period. Actual results could differ from those estimates.
The following estimates and assumptions were used at 30 June 2026 and 31 December 2025 to estimate the fair value of each class of financial instruments:
- Cash and cash equivalents - The carrying value reasonably approximates fair value due to the short-term nature of these instruments.
- Government obligations - Further information on valuation is provided in the Fair Value Measurements section below.
- Other assets - The carrying value reasonably approximates fair value.
- Distributions and sales proceeds receivable from investments - The carrying value reasonably approximates fair value.
- Credit Facility Loan - The carrying value reasonably approximates fair value.
- Payables to Investment Manager and affiliates - The carrying value reasonably approximates fair value.
Note 2 - Summary of Significant Accounting Policies (Continued)
Use of Estimates and Judgements continued
- Accrued expenses and other liabilities - The carrying value reasonably approximates fair value.
- Private equity investments - Further information on valuation is provided in the Fair Value Measurements section below.
Fair Value Measurements
It is expected that most of the investments in which the Group invests will meet the criteria set forth under FASB ASC 820 Fair Value Measurement and Disclosures ("ASC 820") permitting the use of the practical expedient to determine the fair value of the investments. ASC 820 provides that, in valuing alternative investments that do not have quoted market prices but calculate net asset value ("NAV") per share or equivalent, an investor may determine fair value by using the NAV reported to the investor by the underlying investment. To the extent ASC 820 is applicable to an investment, the Investment Manager will value the Group's investment based primarily on the value reported to the Group by the investment or by the lead investor / sponsor of a direct co-investment as of each quarter-end, as determined by the investment in accordance with its own valuation policies.
ASC 820-10 Fair Value Measurements and Disclosures establishes a fair value hierarchy that prioritises the inputs to valuation techniques used to measure fair value. The hierarchy gives the highest priority to unadjusted quoted prices in active markets for identical assets or liabilities (Level 1 measurements) and the lowest priority to unobservable inputs (Level 3 measurements). ASC 820-10-35-39 to 55 provides three levels of the fair value hierarchy as follows:
Level 1: Quoted prices are available in active markets for identical investments as of the
reporting date.
Level 2: Pricing inputs are other than quoted prices in active markets, which are either directly or indirectly observable as of the reporting date.
Level 3: Pricing inputs are unobservable for the investment and include situations where there is little, if any, market activity for the investment. The inputs used in the determination of the fair value require significant management judgement or estimation.
Note 2 - Summary of Significant Accounting Policies (Continued)
Fair Value Measurements continued
Observable inputs refer broadly to the assumptions that market participants would use in pricing the asset or liability, including assumptions about risk, based on market data obtained from sources independent of the Group. Unobservable inputs reflect the Group's own assumptions about the assumptions market participants would use in pricing the asset or liability based on the information available. The inputs or methodology used for valuing assets or liabilities may not be an indication of the risks associated with investing in those assets or liabilities. The Group generally uses the NAV reported by the investments as a primary input in its valuation utilising the practical expedient method of determining fair value; however, adjustments to the reported NAV may be made based on various factors, including, but not limited to, the attributes of the interest held, including the rights and obligations, any restrictions or illiquidity on such interest, any potential clawbacks by the investments and the fair value of the investments' portfolio or other assets and liabilities. Investments that are measured at fair value using the NAV per share (or its equivalent) practical expedient are not categorised in the fair value hierarchy.
Government Obligations
The fair value of U.S. Treasury Bills is based on quoted prices. U.S. Treasury Bills in this portfolio are categorised as Level 1 of the fair value hierarchy.
Realised Gains and Losses on Investments
Purchases and sales of investments are recorded on a trade-date basis. Realised gains and losses from sales of investments are determined on a specific identification basis. For private equity investments, the Group records its share of realised gains and losses incurred when the Investment Manager knows that the private equity investment has realised its interest in a portfolio company and the Investment Manager has sufficient information to quantify the amount. For all other investments, realised gains and losses are recognised in the Consolidated Statements of Operations and Changes in Net Assets in the year in which they arise.
Net Change in Unrealised Gains and Losses on Investments
Gains and losses arising from changes in value are recorded as an increase or decrease in the unrealised gains or losses of investments based on the methodology described above.
Note 2 - Summary of Significant Accounting Policies (Continued)
Foreign Currency
Assets and liabilities denominated in foreign currencies are translated into U.S. dollar amounts at the reporting date. Transactions denominated in foreign currencies, including purchases and sales of investments, and income and expenses, are translated into U.S. dollar amounts on the date of such transactions. Adjustments arising from foreign currency transactions are reflected in the Net realised gain on investments and the Net change in unrealised gain (loss) on investments on the Consolidated Statements of Operations and Changes in Net Assets.
The Group's investments of which capital is denominated in foreign currency are translated into U.S. dollars based on rates of exchange at the reporting date. The cumulative effect of translation to U.S. dollars has decreased the fair value of the Group's foreign investments by $6,489,225 for the six month period ended 30 June 2026. The cumulative effect of translation to U.S. dollars increased the fair value of the Group's foreign investments by $35,332,396 for the six month period ended 30 June 2025.
The Group has unfunded commitments denominated in currencies other than U.S. dollars. At 30 June 2026, the unfunded commitments that are in Euros and Sterling amounted to €9,872,497 and £22,654, respectively (31 December 2025: €7,124,624 and £25,078). They have been included in the Consolidated Condensed Schedules of Investments at the U.S. dollar exchange rates in effect at 30 June 2026 and 31 December 2025. The effect on the unfunded commitment of the change in the exchange rates between Euros and U.S. dollars was a decrease in the U.S. dollar obligations of $74,078 for 30 June 2026 and an increase in the U.S. dollar obligations of $839,438 for 31 December 2025.
The effect on the unfunded commitment of the change in the exchange rates between Sterling and U.S. dollars was a decrease in the U.S. dollar obligations of $396 for 30 June 2026 and an increase in the U.S. dollar obligations of $2,354 for 31 December 2025.
Investment Transactions and Investment Income
Investment transactions are accounted for on a trade-date basis. Investments are recognised when the Group incurs an obligation to acquire a financial instrument and assumes the risk of any gain or loss or incurs an obligation to sell a financial instrument and forego the risk of any gain or loss. Investment transactions that have not yet settled are reported as receivable from investment or payable to investment.
Note 2 - Summary of Significant Accounting Policies (Continued)
Investment Transactions and Investment Income continued
The Group earns interest and dividends from direct investments and from cash and cash equivalents. The Group records dividends on the ex-dividend date, net of withholding tax, if any, and interest on an accrual basis when earned, provided the Investment Manager knows the information or is able to reliably estimate it. Otherwise, the Group records the investment income when it is reported by the private equity investments.
For the six month period ended 30 June 2026, total interest and dividend income was $158,895, of which NIL was dividends, and $158,895 was interest income. For the six month period ended 30 June 2025, total interest and dividend income was $913,335, of which $24,831 was dividends, and $888,504 was interest income.
Cash and Cash Equivalents
Cash and cash equivalents represent cash held in accounts at banks and liquid investments with original maturities of three months or less. Cash equivalents are carried at cost plus accrued interest, which approximates fair value. At 30 June 2026 and 31 December 2025, cash and cash equivalents consisted of $31,405,740 and $72,660,533, respectively, held in operating accounts with Bank of America Merrill Lynch and U.S. Bank.
Cash equivalents are held for the purpose of meeting short-term liquidity requirements, rather than for investment purposes. As of 30 June 2026 and 31 December 2025, the cash equivalents were NIL.
Cash and cash equivalents are subject to credit risk to the extent those balances exceed applicable Federal Deposit Insurance Corporation ("FDIC") or Securities Investor Protection Corporation ("SIPC") limitations.
Note 2 - Summary of Significant Accounting Policies (Continued)
Income Taxes
The Company is registered in Guernsey as an exempt company. The States of Guernsey Income Tax Authority has granted the Group an exemption from Guernsey income tax under the provision of the Income Tax (Exempt Bodies) (Guernsey) Ordinance 1989 and the Group has been charged an annual exemption fee of £1,600 (2025: £1,600). Generally, income that the Group derives from the investments may be subject to taxes imposed by the U.S. or other countries and will impact the Group's effective tax rate.
In accordance with FASB ASC 740-10, Income Taxes, the Group is required to determine whether its tax positions are more likely than not to be sustained upon examination by the applicable taxing authority based on the technical merits of the position. Tax positions not deemed to meet a more-likely-than-not threshold would be recorded as a tax expense in the current year.
The Group files tax returns as prescribed by the tax laws of the jurisdictions in which it operates. In the normal course of business, the Group is subject to examination by U.S. federal, state, local and foreign jurisdictions, where applicable. The Group's U.S. federal income tax returns are open under the normal three-year statute of limitations and therefore subject to examination. The Investment Manager does not expect that the total amount of unrecognised tax benefits will materially change over the next 12 months.
Investments made in entities that generate U.S. source investment income may subject the Group to certain U.S. federal and state income tax consequences. A U.S. withholding tax at the rate of 30% may be applied on the Group's distributive share of any U.S. sourced dividends and interest (subject to certain exemptions) and certain other income that the Group receives directly or through one or more entities treated as either partnerships or disregarded entities for U.S. federal income tax purposes.
Investments made in entities that generate business income that is effectively connected with a U.S. trade or business may subject the Group to certain U.S. federal and state income tax consequences. Generally, the U.S. imposes withholding tax on effectively connected income at the highest U.S. rate (generally 21%). In addition, the Group may also be subject to a branch profits tax which can be imposed at a rate of up to 23.7% of the after-tax profits treated as effectively connected income associated with a U.S. trade or business. As such, the aggregate U.S. tax liability on effectively connected income may approximate 44.7% given the two levels of tax.
The Group recognises a tax benefit in the consolidated financial statements only when it is more likely than not that the position will be sustained upon examination by the relevant taxing authority based on the technical merits of the position. To-date, the Group has not provided any reserves
Note 2 - Summary of Significant Accounting Policies (Continued)
Income Taxes continued
for taxes as all related tax benefits have been fully recognised. Although the Investment Manager believes uncertain tax positions have been adequately assessed, the Investment Manager acknowledges that these matters require significant judgement and no assurance can be given that the final tax outcome of these matters will not be different.
Deferred taxes are recorded to reflect the tax benefit and consequences of future years' differences between the tax basis of assets and liabilities and their financial reporting basis. The Group records a valuation allowance to reduce deferred tax assets if it is more likely than not that some portion or all of the deferred tax assets will not be realised. Management subsequently adjusts the valuation allowance as the expected realisability of the deferred tax assets changes such that the valuation allowance is sufficient to cover the portion of the asset that will not be realised. The Group records the tax associated with any transactions with U.S. or other tax consequences when the Group recognises the related income (see Note 5).
Shareholders in certain jurisdictions may have individual income tax consequences from ownership of the Group's shares. The Group has not accounted for any such tax consequences in these consolidated financial statements. For example, the Investment Manager expects the Group and certain of its non-U.S. corporate subsidiaries to be treated as passive foreign investment corporations ("PFICs") under U.S. tax rules. For this purpose, the PFIC regime should not give rise to additional tax at the level of the Group or its subsidiaries. Instead, certain U.S. investors in the Group may need to make tax elections and comply with certain U.S. reporting requirements related to their investments in the PFICs in order to potentially manage the adverse U.S. tax consequences associated with the regime.
Dividends to Shareholders
The Company pays dividends semi-annually to shareholders upon approval by the Board of Directors subject to the passing of the solvency test under Guernsey law. Liabilities for dividends to shareholders are recorded on the ex-dividend date.
The Company may declare dividend payments from time to time. Prior to each dividend announcement, the Board reviews the appropriateness of the dividend payment in light of macroeconomic activity, the financial position of the Company, and other factors. The Company targets an annualised dividend yield of 3.0% or greater on NAV and pays dividends semi-annually.
Note 2 - Summary of Significant Accounting Policies (Continued)
Operating Expenses
Operating expenses are recognised when incurred. Operating expenses include amounts directly incurred by the Group as part of its operations, and do not include amounts incurred from the operations of the Group's investments. These operating expenses are included in Administration and professional fees on the Consolidated Statements of Operations and Changes in Net Assets.
Carried Interest
Carried interest amounts due to the Special Limited Partner (an affiliate of the Investment Manager, see Note 8) are computed and accrued at each period end based on period-to-date results in accordance with the terms of the Third Amended and Restated Limited Partnership Agreement of NB PEP Investments LP (Incorporated). For the purposes of calculating the incentive allocation payable to the Special Limited Partner, the value of any fund investments made by the Group in other Neuberger funds in respect of which the Investment Manager or an affiliate receives a fee or other remuneration shall be excluded from the calculation.
Note 3 - Investments
The Group invests in a diversified portfolio of direct private equity companies (see Note 2). As required by ASC 820, financial assets and liabilities are classified in their entirety based on the lowest level of input that is significant to the fair value measurement. The Group has assessed these positions and concluded that all private equity companies not valued using the practical expedient, with the exception of marketable securities, are classified as either Level 2, due to indirect investment through a holding company, or Level 3, due to significant unobservable inputs. Marketable securities distributed from a private equity company are classified as Level 1. The Group values equity securities that are traded on a national securities exchange at their last reported sales price. As of 30 June 2026, there was one marketable security held by the Group. As of 31 December 2025, there was one marketable security held by the Group.
Note 3 - Investments (Continued)
The following table details the Group's financial assets and liabilities that were accounted for at fair value as of 30 June 2026 and 31 December 2025 by level and fair value hierarchy.
| Assets (Liabilities) Accounted for at Fair Value | |||||||||||
| Investments | |||||||||||
| measured at | |||||||||||
| As of 30 June 2026 | Level 1 | Level 2 | Level 3 | net asset value1 | Total | ||||||
| Common stock | $ 58,206 | $ 1,947,333 | $ - | $ - | $ 2,005,539 | ||||||
| Private equity companies | - | - | 154,290,192 | 1,097,629,188 | 1,251,919,380 | ||||||
| Totals | $ 58,206 | $ 1,947,333 | $ 154,290,192 | $ 1,097,629,188 | $ 1,253,924,919 | ||||||
| Investments | |||||||||||
| measured at | |||||||||||
| As of 31 December 2025 | Level 1 | Level 2 | Level 3 | net asset value1 | Total | ||||||
| Common stock | $ 41,664 | $ 3,236,829 | $ - | $ - | $ 3,278,493 | ||||||
| Government obligations | 18,899,541 | - | - | - | 18,899,541 | ||||||
| Private equity companies | - | - | 153,473,875 | 1,055,303,711 | 1,208,777,586 | ||||||
| Totals | $ 18,941,205 | $ 3,236,829 | $ 153,473,875 | $ 1,055,303,711 | $ 1,230,955,620 | ||||||
(1)Certain investments that are measured at fair value using the NAV per share (or its equivalent) practical expedient have not been categorised in the fair value hierarchy. The fair value amounts presented in this table are intended to permit reconciliation of the fair value hierarchy to the amounts presented in the Consolidated Condensed Schedules of Investments.
Note 3 - Investments (Continued)
Significant investments:
At 30 June 2026, the Group's share of the following underlying private equity companies exceeded 5% of net asset value.
| Fair Value as a | |||||
| Company | Fair Value | Percentage of | |||
| (Legal Entity Name) | Industry | Country | 2026 | net asset value | |
| Action | Consumer/Retail | Netherlands | $ 77,135,402 | 6.70% | |
| (3i 2020 Co-investment 1 SCSp) | |||||
| (LP Interest) | |||||
| Solenis LLC | Industrials | United States of America | 72,550,066 | 6.30% | |
| (Platinum Equity Diamond Co-Investors (Cayman), L.P.) | |||||
| (Platinum Equity Olympus Co-Investors (Cayman), L.P.) | |||||
| (LP Interest) | |||||
| OneMonroe | Industrials | United States of America | 66,075,350 | 5.74% | |
| (OMN Holdings LP) | |||||
| (LP Interest) |
At 31 December 2025, the Group's share of the following underlying private equity companies exceeded 5% of net asset value.
| Fair Value as a | ||||
| Company | Fair Value | Percentage of | ||
| (Legal Entity Name) | Industry | Country | 2025 | net asset value |
| Action | Consumer/Retail | Netherlands | $ 75,904,753 | 6.28% |
| (3i 2020 Co-investment 1 SCSp) | ||||
| (LP Interest) | ||||
| Osaic Holdings, Inc (1) | Financial Services | United States of America | 69,843,990 | 5.78% |
| (RCP Artemis Co-Invest, L.P.) | ||||
| (LP Interest) | ||||
| Solenis LLC | Industrials | United States of America | 65,271,868 | 5.40% |
| (Platinum Equity Diamond Co-Investors (Cayman), L.P.) | ||||
| (Platinum Equity Olympus Co-Investors (Cayman), L.P.) | ||||
| (LP Interest) | ||||
(1)
The company is held by NB Alternatives Direct Co-investment Programme B and through a direct equity co-investment vehicle.
Note 3 - Investments (Continued)
The following table summarises the changes in the fair value of the Group's Level 3 private equity investments for the six month period ended 30 June 2026.
| (dollars in thousands) | ||||||||
| For the Period Ended 30 June 2026 | ||||||||
| Total Private | ||||||||
| Large-cap | Mid-cap | Special | Growth/ | Income | Equity | |||
| Buyout | Buyout | Situations | Venture | Investments | Investments | |||
| Balance, 31 December 2025 | $ 47,856 | $ 105,618 | $ - | $ - | $ - | $ 153,474 | ||
| Purchases of investments and/or | ||||||||
| contributions to investments | - | - | - | - | - | - | ||
| Realised gain (loss) on investments | - | - | - | - | - | - | ||
| Changes in unrealised gain (loss) of | ||||||||
| investments still held at the reporting date | (7,381) | 8,197 | - | - | - | 816 | ||
| Changes in unrealised gain (loss) of | ||||||||
| investments sold during the period | - | - | - | - | - | - | ||
| Distributions from investments | - | - | - | - | - | - | ||
| Transfers into level 3 | - | - | - | - | - | - | ||
| Transfers out of level 3 | - | - | - | - | - | - | ||
| Balance, 30 June 2026 | $ 40,475 | $ 113,815 | $ - | $ - | $ - | $ 154,290 | ||
There were no transfers into or out of Level 3.
Note 3 - Investments (Continued)
The following table summarises changes in the fair value of the Group's Level 3 private equity
investments for the year ended 31 December 2025.
| (dollars in thousands) | |||||||||||
| For the Year Ended 31 December 2025 | |||||||||||
| Total Private | |||||||||||
| Large-cap | Mid-cap | Special | Growth/ | Income | Equity | ||||||
| Buyout | Buyout | Situations | Venture | Investments | Investments | ||||||
| Balance, 31 December 2024 | $ 49,118 | $ 93,289 | $ 2,277 | $ 8,671 | $ - | $ 153,355 | |||||
| Purchases of investments and/or | |||||||||||
| contributions to investments | - | - | - | - | - | - | |||||
| Realised gain (loss) on investments | (1) | 4,202 | (12,178) | 5,164 | - | (2,813) | |||||
| Changes in unrealised gain (loss) of | |||||||||||
| investments still held at the reporting date | (933) | 14,155 | - | - | - | 13,222 | |||||
| Changes in unrealised gain (loss) of | |||||||||||
| investments sold during the period | - | (176) | 9,901 | (4,731) | - | 4,994 | |||||
| Distributions from investments | (328) | (5,852) | - | (9,104) | - | (15,284) | |||||
| Transfers into level 3 | - | - | - | - | - | - | |||||
| Transfers out of Level 3 | - | - | - | - | - | - | |||||
| Balance, 31 December 2025 | $ 47,856 | $ 105,618 | $ - | $ - | $ - | $ 153,474 | |||||
There were no transfers into or out of Level 3.
Note 3 - Investments (Continued)
The following table summarises the valuation methodologies and inputs used for private equity
investments categorised in Level 3 as of 30 June 2026.
| (dollars in thousands) | |||||||
| Impact to | |||||||
| Fair Value | Valuation from an | ||||||
| Private Equity Investments | 30 June 2026 | Valuation Methodologies | Unobservable Inputs1 | Ranges (Weighted Average)2 | Increase in Input3 | ||
| Direct equity investments | |||||||
| Large-cap buyout | $ 31,431 | Market Comparable Companies | LTM EBITDA | 13.5x | Increase | ||
| 9,044 | Market Comparable Companies | NTM EBITDA | 13.0x | Increase | |||
| Mid-cap buyout | 113,815 | Market Comparable Companies | LTM EBITDA | 9.0x-17.5x (14.5x) | Increase | ||
| Total | $ 154,290 | ||||||
(1)LTM means Last Twelve Months, EBITDA means Earnings Before Interest Taxes Depreciation and Amortisation, NTM means Next Twelve Months.
(2)Inputs weighted based on fair value of investments in range.
(3)Unless otherwise noted, this column represents the directional change in the fair value of Level 3 investments that would result from an increase to the corresponding unobservable input. A decrease to the unobservable input would have the opposite effect. Significant increases and decreases in these inputs in isolation could result in significantly higher or lower fair value measurements.
Note 3 - Investments (Continued)
The following table summarises the valuation methodologies and inputs used for private equity investments categorised in Level 3 as of 31 December 2025.
| (dollars in thousands) | ||||||||
| Impact to | ||||||||
| Fair Value | Valuation from an | |||||||
| Private Equity Investments | 31 December 2025 | Valuation Methodologies | Unobservable Inputs1 | Ranges (Weighted Average)2 | Increase in Input3 | |||
| Direct equity investments | ||||||||
| Large-cap buyout | $ 31,619 | Market Comparable Companies | LTM EBITDA | 13.2x | Increase | |||
| 16,237 | Market Comparable Companies | NTM EBITDA | 19.0x | Increase | ||||
| Mid-cap buyout | 105,618 | Market Comparable Companies | LTM EBITDA | 9.0x-17.4x (14.5x) | Increase | |||
| Total | $ 153,474 | |||||||
(1)LTM means Last Twelve Months, EBITDA means Earnings Before Interest Taxes Depreciation and Amortisation, NTM means Next Twelve Months.
(2)Inputs weighted based on fair value of investments in range.
(3)Unless otherwise noted, this column represents the directional change in the fair value of Level 3 investments that would result from an increase to the corresponding unobservable input. A decrease to the unobservable input would have the opposite effect. Significant increases and decreases in these inputs in isolation could result in significantly higher or lower fair value measurements.
Since 31 December 2025, there have been no changes in valuation methodologies within Level 2 and Level 3 that have had a material impact on the valuation of private equity investments.
In the case of direct equity investments and income investments, the Investment Manager does not control the timing of exits, but at the time of investment, typically expects investment durations to be meaningfully shorter than fund investments. Therefore, although some fund and direct investments may take 10-15 years to reach final realisation, the Investment Manager expects the majority of the Group's invested capital in the current portfolio to be returned in much shorter timeframes. Generally, fund investments have a defined term and no right to withdraw. In the case of fund investments, fund lives are typically 10 years; however, a series of extensions often means the lives can extend significantly beyond this. It should be noted that the Group's fund and income investments are legacy assets, non-core to the current strategy and are in realisation mode.
Note 4 - Credit Facility
As of 30 June 2026, a subsidiary of the Company had a $300.0 million secured revolving credit facility (the "MassMutual Facility") with Massachusetts Mutual Life Insurance Company ("MassMutual"). The 10-year borrowing availability period of the MassMutual Facility expires on 23 December 2029, while the MassMutual Facility matures on 23 December 2031. As of 30 June 2026, the outstanding balance of the MassMutual Facility was $125,000,000, and for the six month period ended 30 June 2026, the borrowings made on the MassMutual Facility were $35,000,000 and the payments to the MassMutual Facility were NIL. As of 31 December 2025, the outstanding balance of the MassMutual Facility was $90,000,000, and for the year ended 31 December 2025, the borrowings made on the MassMutual Facility were NIL and the payments to the MassMutual Facility were NIL.
Under the MassMutual Facility, the Group is required to meet certain portfolio concentration tests and certain loan-to-value ratios not to exceed 45% through 23 December 2027 with stepdowns each year thereafter until reaching 0% on 23 December 2029 and through maturity. In addition, the MassMutual Facility limits the incurrence of loan-to-value ratios above 45%, additional indebtedness, asset sales, acquisitions, mergers, liens, portfolio asset assignments, or other matters customarily restricted in such agreements. The MassMutual Facility defines change in control as a change in the Company's ownership structure of certain of its subsidiaries or the event in which the Group is no longer managed by the Investment Manager or an affiliate. A change in control would trigger an event of default under the MassMutual Facility. At 30 June 2026, the Group met all requirements under the MassMutual Facility. The MassMutual Facility is secured by a security interest in the cash flows from the underlying investments of the Group. Under the MassMutual Facility, the interest rate is calculated as SOFR plus 2.875% per annum, subject to a credit spread adjustment. The amended credit facility agreement results in no material economic changes to the facility.
The Group is required to pay a commitment fee calculated as 0.55% per annum on the average daily balance of the unused facility amount. The Group is subject to a minimum utilisation of 30% of the facility size, or $90.0 million. If the minimum utilisation is not met, the Group is required to pay the amount of interest that would have been accrued on the minimum usage amount less any outstanding advances. As of 30 June 2026, the Group met the minimum utilisation requirement, and only the commitment fee applied.
Note 4 - Credit Facility (Continued)
The following table summarises the Group's finance costs incurred and expensed under the MassMutual Facility for the six month periods ended 30 June 2026 and 2025.
| 30 June 2026 | 30 June 2025 | |||
| Interest expense | $ 3,719,434 | $ 3,383,900 | ||
| Undrawn commitment fees | 531,284 | 580,708 | ||
| Servicing fees and breakage costs | 43,368 | 38,875 | ||
| Amortisation of capitalised debt issuance costs | 131,196 | 131,196 | ||
| Total Credit Facility Finance Costs | $ 4,425,282 | $ 4,134,679 |
As of 30 June 2026 and 31 December 2025, unamortised capitalised debt issuance costs (included in Other assets on the Consolidated Balance Sheets) were $1,451,149 and $1,582,345, respectively. Capitalised amounts are being amortised on a straight-line basis over the terms of the applicable credit facility.
Note 5 - Income Taxes
The Group is exempt from Guernsey tax on income derived from non-Guernsey sources. However, certain of its underlying investments generate income that is subject to tax in other jurisdictions, principally the U.S., the Group has recorded the following amounts related to such taxes:
| For the Six Month Period Ended | For the Six Month Period Ended | ||||
| 30 June 2026 | 30 June 2025 | ||||
| United States | $ (16,042,418) | $ (15,262,030) | |||
| Foreign | - | 24,831 | |||
| Net investment loss before income tax expense | $ (16,042,418) | $ (15,237,199) | |||
| Current tax expense (benefit) | $ (7,864) | $ 35,320 | |||
| Deferred tax expense | - | - | |||
| Total tax expense (benefit) | $ (7,864) | $ 35,320 | |||
| U.S. federal | $ - | $ - | |||
| U.S. state and local | (7,864) | 35,320 | |||
| Foreign | - | - | |||
| Total tax expense (benefit) | $ (7,864) | $ 35,320 |
Current tax expense is reflected in Net investment loss after taxes, and deferred tax expense is reflected in Net change in unrealised gain (loss) on investments on the Consolidated Statements of Operations and Changes in Net Assets. Net deferred tax liabilities are related to net unrealised gains, and gross deferred tax assets, offset by a valuation allowance, are related to unrealised losses on investments held in entities that file separate tax returns.
The Group has no gross unrecognised tax benefits. The Group is subject to examination by tax regulators under the three-year statute of limitations.
Note 5 - Income Taxes (Continued)
The following is a reconciliation of the statutory federal income tax rate to the Group's effective tax rate for the six month periods ended 30 June 2026 and 2025 are as follows:
| For the Six Month Period Ended | For the Six Month Period Ended | |||
| 30 June 2026 | 30 June 2025 | |||
| Guernsey statutory income tax rate | $ - 0.00% | $ - 0.00% | ||
| Income tax expenses at US federal statutory rate |
| - - | ||
| State and local taxes, net of federal benefit | (7,864) 0.05% | 35,320 (0.23%) | ||
| Effective tax rate | $ (7,864) 0.05% | $ 35,320 (0.23%) |
The table below summarises cash taxes paid (net of refunds received) for the six month periods ended 30 June 2026 and 2025. The jurisdictions included below represents cash taxes paid (net of refunds received) equal to or greater than 5% of total cash taxes paid.
| For the Six Month Period Ended | For the Six Month Period Ended | ||||
| 30 June 2026 | 30 June 2025 | ||||
| Cash taxes paid | |||||
| U.S. state and local | |||||
| New Mexico | $ 13,150 | $ - | |||
| Arkansas | 6,401 | (28) | |||
| Illinois | 3,909 | 1,183 | |||
| California | 3,200 | 385 | |||
| Alabama | 1,289 | (6,301) | |||
| Florida | (14,473) | 14,000 | |||
| New York | (27,007) | 441 | |||
| Other | 5,667 | 27,849 | |||
| Total U.S. state and local | $ (7,864) | $ 37,529 | |||
| U.S. withholding taxes | - | - | |||
| Foreign | - | - | |||
| Total cash taxes paid | $ (7,864) | $ 37,529 |
Note 6 - Earnings per Share
The computations for earnings per share for the six month periods ended 30 June 2026 and 2025 are as follows:
| 2026 | 2025 | |||
| Net increase in net assets resulting from operations | ||||
| attributable to the controlling interest | $ 4,863,915 | $ 43,560,184 | ||
| Divided by weighted average shares outstanding for | ||||
| Class A Shares and Class B Shares of the controlling interest | 42,357,407 | 45,836,563 | ||
| Earnings per share for Class A Shares and | ||||
| Class B Shares of the controlling interest | $ 0.11 | $ 0.95 | ||
Note 7 - Share Capital, Including Treasury Stock
Class A shareholders have the right to vote on all resolutions proposed at general meetings of the Company, including resolutions relating to the appointment, election, re-election and removal of Directors. The Company's Class B Shares, which were issued at the time of the initial public offering to a Guernsey charitable trust, whose trustee is Oak Trust (Guernsey) Limited ("Trustee"), usually carry no voting rights at general meetings of the Company. However, in the event the level of ownership of Class A Shares by U.S. residents (excluding any Class A Shares held in treasury) exceeds 35% on any date determined by the Directors (based on an analysis of share ownership information available to the Company), the Class B Shares will carry voting rights in relation to "Director Resolutions" (as such term is defined in the Company's articles of incorporation). In this event, Class B Shares will automatically carry such voting rights to dilute the voting power of the Class A shareholders with respect to Director Resolutions to the extent necessary to reduce the percentage of votes exercisable by U.S. residents in relation to the Director Resolutions to not more than 35%. Each Class A Share and Class B Share participates equally in profits and losses. There have been no changes to the legal form or nature of the Class A Shares nor to the reporting currency of the Company's consolidated financial statements (which will remain in U.S. dollars) as a result of the Main Market quote being in Sterling as well as U.S. dollars. Additional paid-in capital ("APIC") is the excess amount paid by shareholders over the par value of shares. The Company's APIC is included on the Consolidated Balance Sheets.
Note 7 - Share Capital, Including Treasury Stock (Continued)
The following table summarises the Company's shares at 30 June 2026 and 31 December 2025.
| 30 June 2026 | 31 December 2025 | |||
| Class A Shares outstanding | 41,131,988 | 43,280,496 | ||
| Class B Shares outstanding | 10,000 | 10,000 | ||
| 41,141,988 | 43,290,496 | |||
| Class A Shares held in treasury - number of shares | 3,150,408 | 3,150,408 | ||
| Class A Shares held in treasury - cost | $ 9,248,460 | $ 9,248,460 | ||
The Company currently has shareholder authority to repurchase shares in the market, the aggregate value of which may be up to 14.99% of the Class A Shares in issue (excluding Class A Shares held in treasury) at the time the authority is granted; such authority will expire on the date which is 15 months from the date of passing of this resolution or, if earlier, at the end of the Annual General Meeting ("AGM") of the Company held in June 2027. The maximum price which may be paid for a Class A Share is an amount equal to the higher of (i) the price of the last independent trade and (ii) the highest current independent bid, in each case, with respect to the Class A Shares on the relevant exchange (being the Main Market).
The Company entered into a share buyback agreement with Jefferies International Limited ("Jefferies") on 5 October 2022, subject to renewals.
For the six month period ended 30 June 2026, the Company purchased a total of 2,148,508 shares of its Class A stock (4.96% of the issued and outstanding shares as of 31 December 2025) pursuant to general authority granted by shareholders of the Company and the share buyback agreement with Jefferies International Limited. For the six month period ended 30 June 2026, the Company cancelled 2,070,642 shares of its Class A stock, 47,898 shares were cancelled on 1 July 2026, and 29,968 shares were cancelled on 3 July 2026. For the year ended 31 December 2025, the Company purchased a total of 2,957,223 shares of its Class A stock (6.39% of the issued and outstanding shares as of 31 December 2024). For the year ended 31 December 2025, the Company cancelled 2,927,223 shares of its Class A stock, and 30,000 shares were cancelled on 2 January 2026.
Note 8 - Management of the Group and Other Related Party Transactions
Management and Guernsey Administration
The Group is managed by the Investment Manager for a management fee calculated at the end of each calendar quarter equal to 37.5 basis points (150 basis points per annum) of the fair value of the private equity and opportunistic investments. For purposes of this computation, the fair value is reduced by the fair value of any investment for which the Investment Manager is separately compensated for investment management services. The Investment Manager is not entitled to a management fee on: (i) the value of any fund investments held by the Company in other Neuberger funds in respect of which the Investment Manager or an affiliate receives a fee or other remuneration; or (ii) the value of any holdings in cash and short-term investments (the definition of which shall be determined in good faith by the Investment Manager, and shall include holdings in money market funds (whether managed by the Investment Manager, an affiliate of the Investment Manager or a third-party manager)). For the six month periods ended 30 June 2026 and 2025, the net management fee expenses were $9,054,358 and $9,321,556, respectively, and are included in Investment management and services on the Consolidated Statements of Operations and Changes in Net Assets. As of 30 June 2026 and 2025, Investment Management fees payable to the Investment Manager and its affiliates were $4,602,523 and $4,744,907, respectively. If the Company terminates the Investment Management Agreement without cause, the Company shall pay a termination fee equal to: seven years of management fees, plus an amount equal to seven times the mean average incentive allocation of the three performance periods immediately preceding the termination, plus all underwriting, placement and other expenses borne by the Investment Manager or affiliates in connection with the Company's Initial Public Offering. Certain of the Group's investments pay the Investment Manager for transaction services at the time of close and ongoing monitoring services. This income to the Investment Manager is shared with the Group based on its ownership percentage through a fee offset which is presented on the Consolidated Statements of Operations and Changes in Net Assets. For the six month periods ended 30 June 2026 and 2025, the management fee offset was $157,517 and NIL, respectively.
Administration and professional fees include fees for Directors, independent third-party accounting and administrative services, audit, tax, and assurance services, trustee, legal, listing and other items. The Company has appointed a Guernsey administrator to provide company secretarial and certain administrative functions relating to Guernsey regulatory matters affecting the Group. These services were provided by Oak Fund Services (Guernsey) Limited ("Oak Fund Services"), an affiliate of the Trustee. The Group paid Oak Fund Services $188,029 and $144,648 for the six month periods ended 30 June 2026 and 2025, respectively. The Group also paid MUFG Capital Analytics LLC, an independent third-party fund administrator, $650,000 ($325,000 quarterly) for each of the six month periods ended 30 June 2026 and 2025. These fees are included in Administration and professional fees on the Consolidated Statements of Operations and Changes in Net Assets.
Note 8 - Management of the Group and Other Related Party Transactions (Continued)
Management and Guernsey Administration continued
Directors' fees are paid in Sterling and they are based on each Director's position on the Company's Board. Directors' fees are subject to an annual increase equivalent to the annual rise in the Guernsey retail price index, subject to a 1% per annum minimum, and is limited to an aggregate of £550,000 per annum. For the six month period ended 30 June 2026, Directors' fees were as follows: Chairman £99,324 annually (£24,831 quarterly), Chairman of the Audit Committee £75,224 annually (£18,806 quarterly), Senior Independent Director £68,424 annually (£17,106 quarterly), Chairman of the NRC and MEC £68,372 annually (£17,093 quarterly), and Non-Executive Directors £62,724 annually (£15,681 quarterly). For the six month period ended 30 June 2026, an additional fee was assessed in the amount of £18,093 annually and payable to three Directors (£6,031 each) for serving as directors of the Guernsey Subsidiaries of the Company. As of 30 June 2026, the beneficial interests of the Directors in the issued share capital of the Company were 139,331 Ordinary Shares.
For the six month periods ended 30 June 2026 and 2025, the Group paid the independent directors a total of $297,491 (of which $11,997 related to services provided to the Guernsey Subsidiaries of the Company) and $290,938 (of which $11,862 related to services provided to the Guernsey Subsidiaries of the Company), respectively.
Related Parties
In order to execute on its investing activities, the Investment Manager may create an intermediary entity for tax, legal, or other purposes. These intermediary entities do not charge management fees nor incentive allocations. Additionally, the Group may co-invest with other entities with the same Investment Manager as the Group.
Note 8 - Management of the Group and Other Related Party Transactions (Continued)
Special Limited Partner's Non-controlling Interest in Subsidiary
An affiliate of the Investment Manager is a Special Limited Partner in a consolidated partnership subsidiary. At 30 June 2026 and 31 December 2025, the non-controlling interest of $2,119,045 and $2,104,462, respectively, represented the Special Limited Partner's capital contribution to the partnership subsidiary and income allocation.
The following table reconciles the carrying amount of net assets, net assets attributable to the controlling interest, and net assets attributable to the non-controlling interest at 30 June 2026 and 31 December 2025.
| Controlling Interest | Non-controlling Interest | Total | ||||||
| Net assets balance, 31 December 2024 | $ 1,273,298,248 | $ 2,045,773 | $ 1,275,344,021 | |||||
| Net increase in net assets | ||||||||
| resulting from operations | 38,882,562 | 58,689 | 38,941,251 | |||||
| Dividend payment | (43,111,732) | - | (43,111,732) | |||||
| Cost of stock repurchased and cancelled (2,957,223 shares) | (59,679,425) | - | (59,679,425) | |||||
| Net assets balance, 31 December 2025 | $ 1,209,389,653 | $ 2,104,462 | $ 1,211,494,115 | |||||
| Net increase in net assets | ||||||||
| resulting from operations | 4,863,915 | 14,583 | 4,878,498 | |||||
| Dividend payment | (20,274,911) | - | (20,274,911) | |||||
| Cost of stock repurchased and cancelled (2,148,508 shares) | (42,036,402) | - | (42,036,402) | |||||
| Net assets balance, 30 June 2026 | $ 1,151,942,255 | $ 2,119,045 | $ 1,154,061,300 | |||||
Note 8 - Management of the Group and Other Related Party Transactions (Continued)
Carried Interest
The Special Limited Partner is entitled to a carried interest in an amount that is, in general, equal to 7.5% of the Group's consolidated net increase in net assets resulting from operations, adjusted by withdrawals, distributions and capital contributions, for a fiscal year in the event that the Group's Internal Rate of Return for such period, based on the NAV, exceeds 7.5%. For the purposes of this computation, the value of any private equity fund investment in other Neuberger funds in respect of which the Investment Manager or an affiliate receives a fee or other remuneration shall be excluded from the calculation of the incentive allocation payable to the Special Limited Partner. The determination of the Group's Internal Rate of Return hurdle is done on a year-by-year basis and is not cumulatively compounded. If losses are incurred for a period, no carried interest will be earned for any period until the subsequent net profits exceed the cumulative net losses. Carried interest is also accrued and paid on any economic gain that the Group realises on treasury stock transactions. Carried interest is accrued periodically and paid in the subsequent year. As of 30 June 2026 and 31 December 2025, carried interest of NIL was accrued.
Note 8 - Management of the Group and Other Related Party Transactions (Continued)
Private Equity Investments with NBG Affiliates
The Group holds limited partner interests in private equity fund investments and direct investment programmes that are managed by affiliates of NBG ("Neuberger-Affiliated Investments"). Neuberger-Affiliated Investments will not result in any duplicative management fees and carry charged to the Group. Below is a summary of the Group's positions in Neuberger-Affiliated Investments.
| Neuberger-Affiliated Investments (dollars in millions) | Fair Value (1) | Committed | Funded | Unfunded | |||||||||||||
| 2026 | |||||||||||||||||
| Neuberger-Affiliated Programmes | |||||||||||||||||
| NB Alternatives Direct Co-investment Programmes | $ 121.6 | $ 275.0 | $ 243.6 | $ 31.4 | |||||||||||||
| Renaissance Programmes | 26.6 | 41.2 | 36.3 | 4.9 | |||||||||||||
| Marquee Brands | 35.5 | 30.0 | 26.6 | 3.4 | |||||||||||||
| NB Credit Opportunities Programme | 14.7 | 50.0 | 49.3 | 0.7 | |||||||||||||
| Total Neuberger-Affiliated Investments | $ 198.4 | $ 396.2 | $ 355.8 | $ 40.4 | |||||||||||||
| 2025 | |||||||||||||||||
| Neuberger-Affiliated Programmes | |||||||||||||||||
| NB Alternatives Direct Co-investment Programmes | $ 133.4 | $ 275.0 | $ 242.5 | $ 32.5 | |||||||||||||
| Renaissance Programmes | 27.2 | 41.2 | 33.2 | 8.0 | |||||||||||||
| Marquee Brands | 32.9 | 30.0 | 26.6 | 3.4 | |||||||||||||
| NB Credit Opportunities Programme | 14.6 | 50.0 | 49.3 | 0.7 | |||||||||||||
| Total Neuberger-Affiliated Investments | $ 208.1 | $ 396.2 | $ 351.6 | $ 44.6 | |||||||||||||
| (1): Fair value does not include distributions. At 30 June 2026 and 31 December 2025, the total distributions from | |||||||||||||||||
| Neuberger-Affiliated Investments were $607.3 million and $587.1 million, respectively. | |||||||||||||||||
Note 9 - Risks and Contingencies
Market Risk
The Group's exposure to financial risks is both direct (through its holdings of assets and liabilities directly subject to these risks) and indirect (through the impact of these risks on the overall valuation of its private equity companies). The Group's private equity companies are generally not traded in an active market, but are indirectly exposed to market price risk arising from uncertainties about future values of the investments held. Each fund investment of the Group holds a portfolio of investments in underlying companies. These portfolio company investments vary as to type of security held by the underlying partnership (debt or equity, publicly traded or privately held), stage of operations, industry, geographic location and geographic distribution of operations and size, all of which may impact the susceptibility of their valuation to market price risk.
Market conditions for publicly traded and privately held investments in portfolio companies held by the partnerships may affect their value in a manner similar to the potential impact on direct co-investments made by the Group in privately held securities. The fund investments of the Group may also hold financial instruments (including debt and derivative instruments) in addition to their investments in portfolio companies that are susceptible to market price risk and therefore may also affect the value of the Group's investment in the partnerships. As with any individual investment, market prices may vary from composite index movements.
Additionally, the Group's investments in non-USD denominated investments may result in foreign exchange losses caused by devaluations and exchange rate fluctuations.
Credit Risk
Credit risk is the risk of losses due to the failure of a counterparty to perform according to the terms of a contract. The Group may invest in a range of debt securities directly or in funds which do so. Until such investments are sold or are paid in full at maturity, the Group is exposed to credit risk relating to whether the issuer will meet its obligations when the securities come due.
The cash and other liquid securities held can subject the Group to a concentration of credit risk. The Investment Manager attempts to mitigate the credit risk that exists with cash deposits and other liquid securities by regularly monitoring the credit ratings of such financial institutions and evaluating from time to time whether to hold some of the Group's cash and cash equivalents in U.S. Treasuries or other highly liquid securities.
Note 9 - Risks and Contingencies (Continued)
Credit Risk continued
The Group's investments are subject to various risk factors including market and credit risk, interest rate and foreign exchange risk, inflation risk, and the risks associated with investing in private securities. Non-U.S. dollar denominated investments may result in foreign exchange losses caused by devaluations and exchange rate fluctuations. In addition, consequences of political, social, economic, diplomatic changes, or public health conditions may have disruptive effects on market prices or fair valuations of foreign investments.
Liquidity Risk
Liquidity risk is the risk that the Group will not be able to meet its obligations as they fall due. The Investment Manager mitigates this risk by monitoring the sufficiency of cash balances and availability under the credit facility (see Note 4) to meet expected liquidity requirements for investment funding and operating expenses.
Contingencies
In the normal course of business, the Group enters into contracts that contain a variety of representations and warranties which provide general indemnifications. The Group's maximum exposure under these arrangements is unknown, as this would involve future claims that may be made against the Group that have not yet occurred. The Investment Manager expects the risk of loss to be remote and does not expect these to have a material adverse effect on the consolidated financial statements of the Group.
Note 10 - Financial Highlights
The following ratios with respect to the Class A Shares and Class B Shares have been computed for the six month periods ended 30 June 2026 and 2025 and the year ended 31 December 2025:
| Per share operating performance | For the Six Month Period Ended | For the Year Ended | For the Six Month Period Ended | |||||
| (based on average shares outstanding during the year) | 30 June 2026 | 31 December 2025 | 30 June 2025 | |||||
| Beginning net asset value | $ 27.94 | $ 27.53 | $ 27.53 | |||||
| Net increase in net assets resulting from operations: | ||||||||
| Net investment loss | (0.38) | (0.71) | (0.33) | |||||
| Net realised and unrealised gain | 0.50 | 1.57 | 1.27 | |||||
| Dividend payment | (0.48) | (0.95) | (0.47) | |||||
| Stock repurchased and cancelled | 0.42 | 0.50 | 0.14 | |||||
| Ending net asset value | $ 28.00 | $ 27.94 | $ 28.14 | |||||
| Total return | For the Six Month Period Ended | For the Year Ended | For the Six Month Period Ended | |||||
| (based on change in net asset value per share) | 30 June 2026 | 31 December 2025 | 30 June 2025 | |||||
| Total return | 1.93% | 4.94% | 3.92% | |||||
| Net investment loss and expense ratios | For the Six Month Period Ended (Annualised) | For the Year Ended | For the Six Month Period Ended (Annualised) | |||||
| (based on weighted average net assets) | 30 June 2026 | 31 December 2025 | 30 June 2025 | |||||
| Net investment loss | (2.75%) | (2.54%) | (2.45%) | |||||
| Expense ratios: | ||||||||
| Expenses before interest and fee offset | 2.16% | 1.99% | 2.05% | |||||
| Interest expense | 0.64% | 0.54% | 0.54% | |||||
| Fee offset | (0.03%) | - | - | |||||
| Expense ratios total | 2.77% | 2.53% | 2.59% | |||||
Net investment loss is interest income earned net of expenses, including management fees and other expenses consistent with the presentation within the Consolidated Statements of Operations and Changes in Net Assets. The net investment loss ratios do not include net realised and unrealised gain. Expenses do not include the expenses of the underlying private equity investment partnerships. In the expense ratios, expenses are presented as a positive number whereas the offset is negative to represent a reduction to expenses.
Individual shareholder returns may differ from the ratios presented based on differing entry dates into the Group.
Note 11 - Subsequent Events
On 28 August 2026, the Group paid a dividend of $0.47 per Ordinary Share to shareholders of record on 17 July 2026.
From 1 July 2026 through 22 September 2026, the Company purchased and cancelled a total of 3,270,704 shares of its Class A stock, for a total purchase price of $64,475,269.
The Investment Manager and the Board of Directors have evaluated events through 22 September 2026, the date the financial statements are available to be issued and have determined there were no other subsequent events that require adjustment to, or disclosure in, the financial statements.
For further information, please contact:
NBPE Investor Relations+44 20 3214 9002
Luke Mason
Teneo +44 (0) 20 7260 2700
Tom Murray NBPE@teneo.com
Rob Yates
Jessica Pine
About Neuberger Private Equity Partners Limited
Neuberger Private Equity Partners invests in direct private equity investments alongside market leading private equity firms globally. NB Alternatives Advisers LLC (the "Investment Manager"), an indirect wholly owned subsidiary of Neuberger Berman Group LLC, is responsible for sourcing, execution and management of Neuberger Private Equity Partners. The vast majority of direct investments are made with no management fee / no carried interest payable to third-party GPs, offering greater fee efficiency than other listed private equity companies. Neuberger Private Equity Partners seeks capital appreciation through growth in net asset value over time while paying a bi-annual dividend.
LEI number: 213800UJH93NH8IOFQ77
About Neuberger
Neuberger was founded in 1939 to do one thing: deliver compelling investment results for our clients over the long term. This remains our singular purpose today, driven by a culture rooted in deep fundamental research, the pursuit of investment insight and continuous innovation on behalf of clients, and facilitated by the free exchange of ideas across the organization.
From offices in 39 cities[1] across 26 countries, Neuberger manages a range of equity, fixed income, private equity and hedge fund strategies on behalf of institutions, advisors and individual investors worldwide. With more than 780[1] investment professionals and over 2,900[1] employees in total, Neuberger has built a diverse team of individuals united in their commitment to client outcomes and investment excellence. Our culture has afforded us enviable retention rates among our senior investment staff and we are proud to have been ranked 1st by Pensions & Investments in their 2025 "Best Places to Work in Money Management" survey, where we have placed 1st in four of the last five years and finished in the top two for 12 consecutive years[2].
As a private, independent, employee-owned investment manager, Neuberger is structurally aligned with the long-term interests of our clients. We have no external parent or public shareholders to serve, nor other lines of business to distract us from our core mission. And with our employees and their families invested alongside our clients-plus 100% of employee deferred cash compensation directly linked to team and firm strategies-we are truly in this together.
For more information, please visit our website: www.nb.com/en/global/who-we-are.
Media Contacts:
US: Soogyung Jordan: Soogyung.Jordan@nb.com
EMEA: Fiona Kehily: Fiona.Kehily@nb.com
[1] Firm data reflects the collective data for the various subsidiaries of Neuberger Berman Group LLC as of 30 June 2026.
[2] Among organizations with over 1,000 employees by Pensions & Investments. For additional information on the criteria for the award, please visit https://www.pionline.com/awards/best-places-to-work-in-money-management/pi-best-places-to-work-2025…
This material is issued on a limited basis through various global subsidiaries and affiliates of Neuberger Berman Group LLC. Please visit www.nb.com/disclosure-global-communications to learn about each company and the legal restrictions and restrictions. The name "Neuberger Berman" and logo are registered service marks of Neuberger Berman Group LLC.
© 2026 Neuberger Berman Group LLC. All rights reserved.
1 Based on net asset value (unaudited) as of 31 August 2026.
2 Revenue & EBITDA Growth: Past performance is no guarantee of future results. The private companies included in the data represent approximately 80% of the total direct equity portfolio. Fair value as of 30 June 2026 and the data is subject to the following adjustments: 1) Excludes public companies, Marquee Brands and other investments not valued on multiples of EBITDA. 2) Analysis based on 49 private companies. 3) The following exclusions to the data were made: a) seven companies (8% of direct equity fair value) held less than one year were excluded from the growth rates b) one company (less than 1% of direct equity fair value) was excluded due to insufficient information to calculate a growth rate. 4) One company's growth rates were excluded in the 31 December 2025 aggregate portfolio metrics, but included in the 30 June 2026 portfolio metrics and reflect the remaining portion of the business after the sale of a division. Portfolio company operating metrics are based on the most recently available (unaudited) financial information for each company as reported by the lead private equity sponsor to the Manager as of 18 September 2026. Where necessary, estimates were used, which include pro forma adjusted EBITDA and other EBITDA adjustments, pro forma revenue adjustments, run-rate adjustments for acquisitions, and annualised quarterly operating metrics. LTM periods as of 30/6/2026 and 31/3/2026 and 30/6/2025 and 31/3/2025. LTM revenue and LTM EBITDA growth rates are weighted by fair value. Underlying EBITDA reported by the GPs may include pro forma or other adjustments to LTM EBITDA in one or both periods and this reported EBITDA used to calculate growth rates may not be the same EBITDA for valuation purposes by underlying GPs. As a result, growth and valuation multiple data are not directly comparable.
3 As at 18 September 2026
4 Weighted by NAV of the top ten companies. LTM periods as of 30 June 2026, except one company which reported on a one month lag.
5 Weighted by NAV of the 2024 investments. LTM periods as of 30 June 2026.
6 Valuation & Leverage: Past performance is no guarantee of future results. Fair value as of 30 June 2026 and subject to the following adjustments. 1) Excludes public companies, Marquee Brands and other investments not valued on a multiple of EBITDA. 2) Based on 53 private companies which are valued based on EV/EBITDA metrics. 3) The private companies included in the data represent 84% of direct equity investment fair value. 4) Companies not valued on multiples of EBITDA are excluded from valuation statistics. 5) Leverage statistics based on 52 private companies and excludes one company with net cash position; leverage data represent 84% of direct equity investment fair value. Portfolio company operating metrics are based on the most recently available (unaudited) financial information for each company and are as reported by the lead private equity sponsor to the Manager as of 18 September 2026, based on reporting periods as of 30 June 2026 and 31 March 2026. EV and leverage data is weighted by fair value. LTM EBITDA used by underlying GPs for valuation purposes may differ from EBITDA used to calculate growth rates due to pro forma or other adjustments and therefore the two data sets are not directly comparable.

