
EQS-News: Benzinga
/ Key word(s): Financial
By Jim Wyckoff, Benzinga DETROIT, MICHIGAN - October 28, 2026 (NEWMEDIAWIRE) - Successful traders and investors, especially the active ones, are often seeking out the best tools to help position them for a profitable trade. Knowing how the marketplace is presently reading a particular market's future price trajectory, including its level of volatility, is one key element all traders should closely examine before pulling the trigger on a trade. This is especially true for the very popular and more volatile technology sector of the stock market. 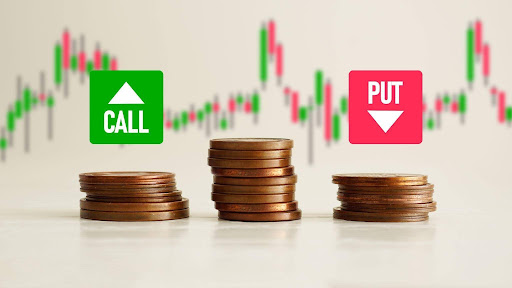 Studying options' price action, volume and open interest is one way to gain valuable insight into where a particular market, stock, or index price may be headed in the near term, or even longer. For the technology sector of the stock market, including red-hot semiconductors - which have commanded overwhelming attention as the AI race evolves - the popular Nasdaq-100 Index Options (NDX) and Nasdaq-100 Micro Index Options (XND) should be at the top of the checklist for every tech trader and investor seeking out new opportunities in the sector. The artificial intelligence race and its growing need for compute power are squarely on the front burner of general stock market discussion and will likely remain so for quite some time to come. NDX and XND are index derivatives that allow traders and investors to trade or hedge the performance of the Nasdaq-100 Index. While both follow the same top 100 non-financial companies listed on Nasdaq, they are distinguished primarily by contract size and affordability. The Micro Index Options (XND) tracks the Nasdaq-100 Micro Index, which is fixed at 1/100th (1%) of the full NDX value. It also carries a $100 multiplier. With the micro index trading around 290, one contract controls $29,000 in notional exposure. This makes XND very accessible for retail traders. Studying the put/call ratio (PCR) of NDX and XND can show a bullish or bearish bias toward the indexes at that particular time. A high PCR ratio (more puts than calls) suggests more trader anxiety and a bearish bias for the index. A low PCR (more calls than puts) shows keener risk appetite and a more bullish stance. Some experienced traders also like to use the PCR as a contrarian indicator for market sentiment. Extreme readings in the PCR can be seen as warnings for upcoming price or trend reversals. During periods of higher market volatility, the prices (or premiums) of options can and usually do increase substantially. That's called "implied volatility." Savvy traders/investors examine implied volatility in options markets closely and on a regular basis. It's not only a gauge of present market risk but also an indicator of a market's likely daily volatility, or price swings, for the near term. Given the recent higher volatility in the tech sector, the implied volatility in NDX and XND are extra important indicators. For example, NDX and XND recently showed a significant surge in implied volatility leading up to second-quarter big high-tech stock earnings reports. The two options markets' implied volatility saw a sharp divergence between that of the technology sector and that of the broader market sector (S&P 500) due to some ideas that U.S. artificial intelligence models had monetization bloat compared to rival models coming out of China. "Investors rushed into NDX and XND options for portfolio protection, creating notable volatility spikes," said a Seeking Alpha report. Traders employed heavy positioning in short-dated NDX/XND options skewed heavily toward puts. The heightened implied volatility peaked in late July, forcing the more general-market Volatility Index (VIX) to rise. Taking implied volatility a step further, "skew" in options means pricing differences between out-of-the-money puts and calls. A steep skew, where out-of-the-money put options' premiums and implied volatility are rising at a more rapid rate than that of the call options, suggests keener risk aversion in the marketplace and a more bearish sentiment. The opposite of a steep skew is flat skew, whereby implied volatility and price premiums are relatively equal and evenly distributed across different strike prices rather than sharply lopsided. Examining skew in the Nasdaq options arena is important for traders and investors, given that tech sector stocks have become much more popular, and more volatile, over the past couple of years. Regarding open interest in NDX and XND individual strike prices, an investor can examine those numbers to see if there are much higher open interest levels at certain strike prices, which would suggest options traders are targeting those levels. Higher clusters of call options at a certain strike price imply upside price targets, or technical resistance levels. Clusters of puts at certain strikes suggest downside targets for options traders, or key technical support levels. Monitoring volume surges in NDX and XND is also appropriate for gauging market sentiment in the tech sector. Volume spikes in puts or calls reflect more aggressive directional trades, or even institutional hedging via puts, suggesting the "smart money" is sensing caution even if the underlying index is trending up. Looking at rising NDX and XND open interest amid a rallying underlying Nasdaq index is a bullish signal that there is investor conviction and heavier investor backing in the price uptrend, as opposed to just shorter-term speculative buying interest. Don't Overlook The Cboe-Nasdaq 100 Volatility Index (VXN) The Cboe-Nasdaq 100 Volatility Index (VXN) is a real-time market indicator measuring expected 30-day volatility for the Nasdaq-100 Index. The keener focus on the tech sector by the VXN gives traders a better reading on market sentiment for that particular sector, as opposed to Cboe's S&P 500 Volatility Index (VIX), which measures the risk sentiment in the overall marketplace for stocks. It's important to note that the VXN trades at a higher numerical value than the VIX. This is because the Nasdaq-100 Index contains more growth-oriented, and potentially more volatile, stocks than the more diverse S&P 500 Index. Rising VXN readings suggest increasing anxiety among technology stock traders, including possibly higher daily price volatility. Declining VXN numbers indicate a calmer sector, and even some complacency among tech stock traders. Featured image from Shutterstock. Nasdaq is a registered trademark of Nasdaq, Inc. The information contained above is provided for informational and educational purposes only, and nothing contained herein should be construed as investment advice, either on behalf of a particular security or an overall investment strategy. Neither Nasdaq, Inc. nor any of its affiliates makes any recommendation to buy or sell any security or any representation about the financial condition of any company. Statements regarding Nasdaq-listed companies or Nasdaq proprietary indexes are not guarantees of future performance. Actual results may differ materially from those expressed or implied. Past performance is not indicative of future results. Investors should undertake their own due diligence and carefully evaluate companies before investing. ADVICE FROM A SECURITIES PROFESSIONAL IS STRONGLY ADVISED. For the sake of simplicity, the examples included do not take into consideration commissions and other transaction fees, tax considerations, or margin requirements, which are factors that may significantly affect the economic consequences of a given strategy. An investor should review transaction costs, margin requirements and tax considerations with a broker and tax advisor before entering into any options strategy. Options involve risk and are not suitable for everyone. Prior to buying or selling an option, a person must receive a copy of Characteristics and Risks of Standardized Options. Copies may be obtained from your broker, one of the exchanges or The Options Clearing Corporation, One North Wacker Drive, Suite 500, Chicago, IL 60606 or call 1-888-OPTIONS or visitwww.888options.com. Any strategies discussed, including examples using actual securities and price data, are strictly for illustrative and education purposes and are not to be construed as an endorsement, recommendation or solicitation to buy or sell securities. This content was originally published on Benzinga. Read further disclosures here. This post contains sponsored content and was created in collaboration with a third-party partner. Benzinga is a publisher and does not provide personalized investment advice or act as a broker or dealer. This content is for informational purposes only and is not intended to be investing advice or an offer or solicitation to buy or sell any security. View the original release on www.newmediawire.com News Source: Benzinga 28.10.2026 CET/CEST Dissemination of a Corporate News, transmitted by EQS News - a service of EQS Group. |
| Language: | English |
| Company: | Benzinga |
| United States | |
| EQS News ID: | 2424078 |
| End of News | EQS News Service |
2424078 28.10.2026 CET/CEST
