
TORONTO, ON / ACCESS Newswire / November 4, 2026 / Rocky Shore Gold Ltd. ("Rocky Shore" or the "Company") (CSE:RSG)(OTCQB:RSGLF) has begun a major 1,321-kilometre airborne TDEM geophysical survey covering the entire Rocky Pond VMS Project ("Rocky Pond"). Rocky Pond lies within the Buchans-Roberts Arm VMS Belt, which hosts several former Volcanogenic Massive Sulphide ("VMS") mines, including the high-grade Buchans mine, and is known for gold-rich polymetallic mineralization. Rocky Pond reflects the Company's commitment to Newfoundland's mineral potential and complements its flagship Gold Anchor Project, located in one of Canada's most prospective gold belts in central Newfoundland (see Map 1 and Map 2).
Ken Lapierre, President and CEO of Rocky Shore, commented, "This is the first airborne geophysical survey of this scale over the Rocky Pond VMS Project. Electromagnetic surveys can detect buried VMS mineralization at considerable depths. The gold-rich Handcamp Zone at surface already demonstrates the project's prospectivity and suggests more targets will emerge. With a presence in two promising districts of central Newfoundland, we are well positioned to advance the Company as we continue drilling Gold Anchor and prepare Rocky Pond for an early winter drill program in 2027."
Key Rocky Pond Highlights (previously presented in a press release dated September 16, 2026):
- Gold-rich VMS zone identified: Handcamp Zone hosts gold-rich VMS mineralization (Au-Ag-Zn-Pb-Cu) trending for 1,200 metres across shallow depths (above 100 metres vertical) and remains open along strike and at depth.
- Handcamp Zone - near-surface drill hole mineralization:
- 1.96 g/t AuEq over 25.05 m from 13.05 m, including 3.50 g/t AuEq over 11.60 m (H22-04)
- 2.20 g/t AuEq over 21.95 m from 10.20 m, including 3.98 g/t AuEq over 11.35 m (H22-03)
- 2.89 g/t AuEq over 11.85 m from 12.10 m, including 4.41 g/t AuEq over 7.30 m (H22-01)
- 2.61 g/t AuEq over 12.25 m from 68.45 m, and 2.92 g/t AuEq over 5.55 m (H22-10)
- 1.17 g/t AuEq over 26.25 m from 19.25 m, including 2.08 g/t AuEq over 11.05 m (H22-02)
- 2.38 g/t AuEq over 8.55 m from 27.60 m, including 4.58 g/t AuEq over 4.10 m (H22-14)
See table below for complete historical drill results.Lengths represent down-the-hole drill thicknesses. True thickness is not known currently.
- On trend to the Buchans VMS mine: Project hosts a 40-kilometre-long trend of the prolific Roberts Arm VMS Belt northeast of the high-grade former producing Buchans VMS mine.
- Additional surface mineralization identified: Loon Pond showing: Two rock samples: 8.35% Zn, 2.5% Pb, 0.75% Cu, 131.6 g/t Ag, 17.2 g/t Au and 9.15%Zn, 0.13% Pb, 0.13% Cu, 85.2 g/t Ag, 0.9 g/t Au.
Loon Pond is strategically located 15 kilometres northeast and on trend to the Handcamp Zone. Surface samples do not accurately reflect the true grade of the surrounding potential VMS system and should not be relied upon.
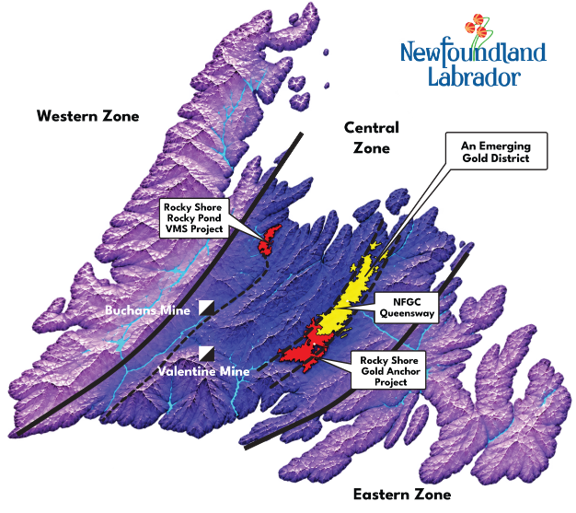
Map 1: Rocky Shore's two projects (in red): Gold Anchor Project (Au) and Rocky Pond VMS Project (Au-Ag-Zn-Pb-Cu).
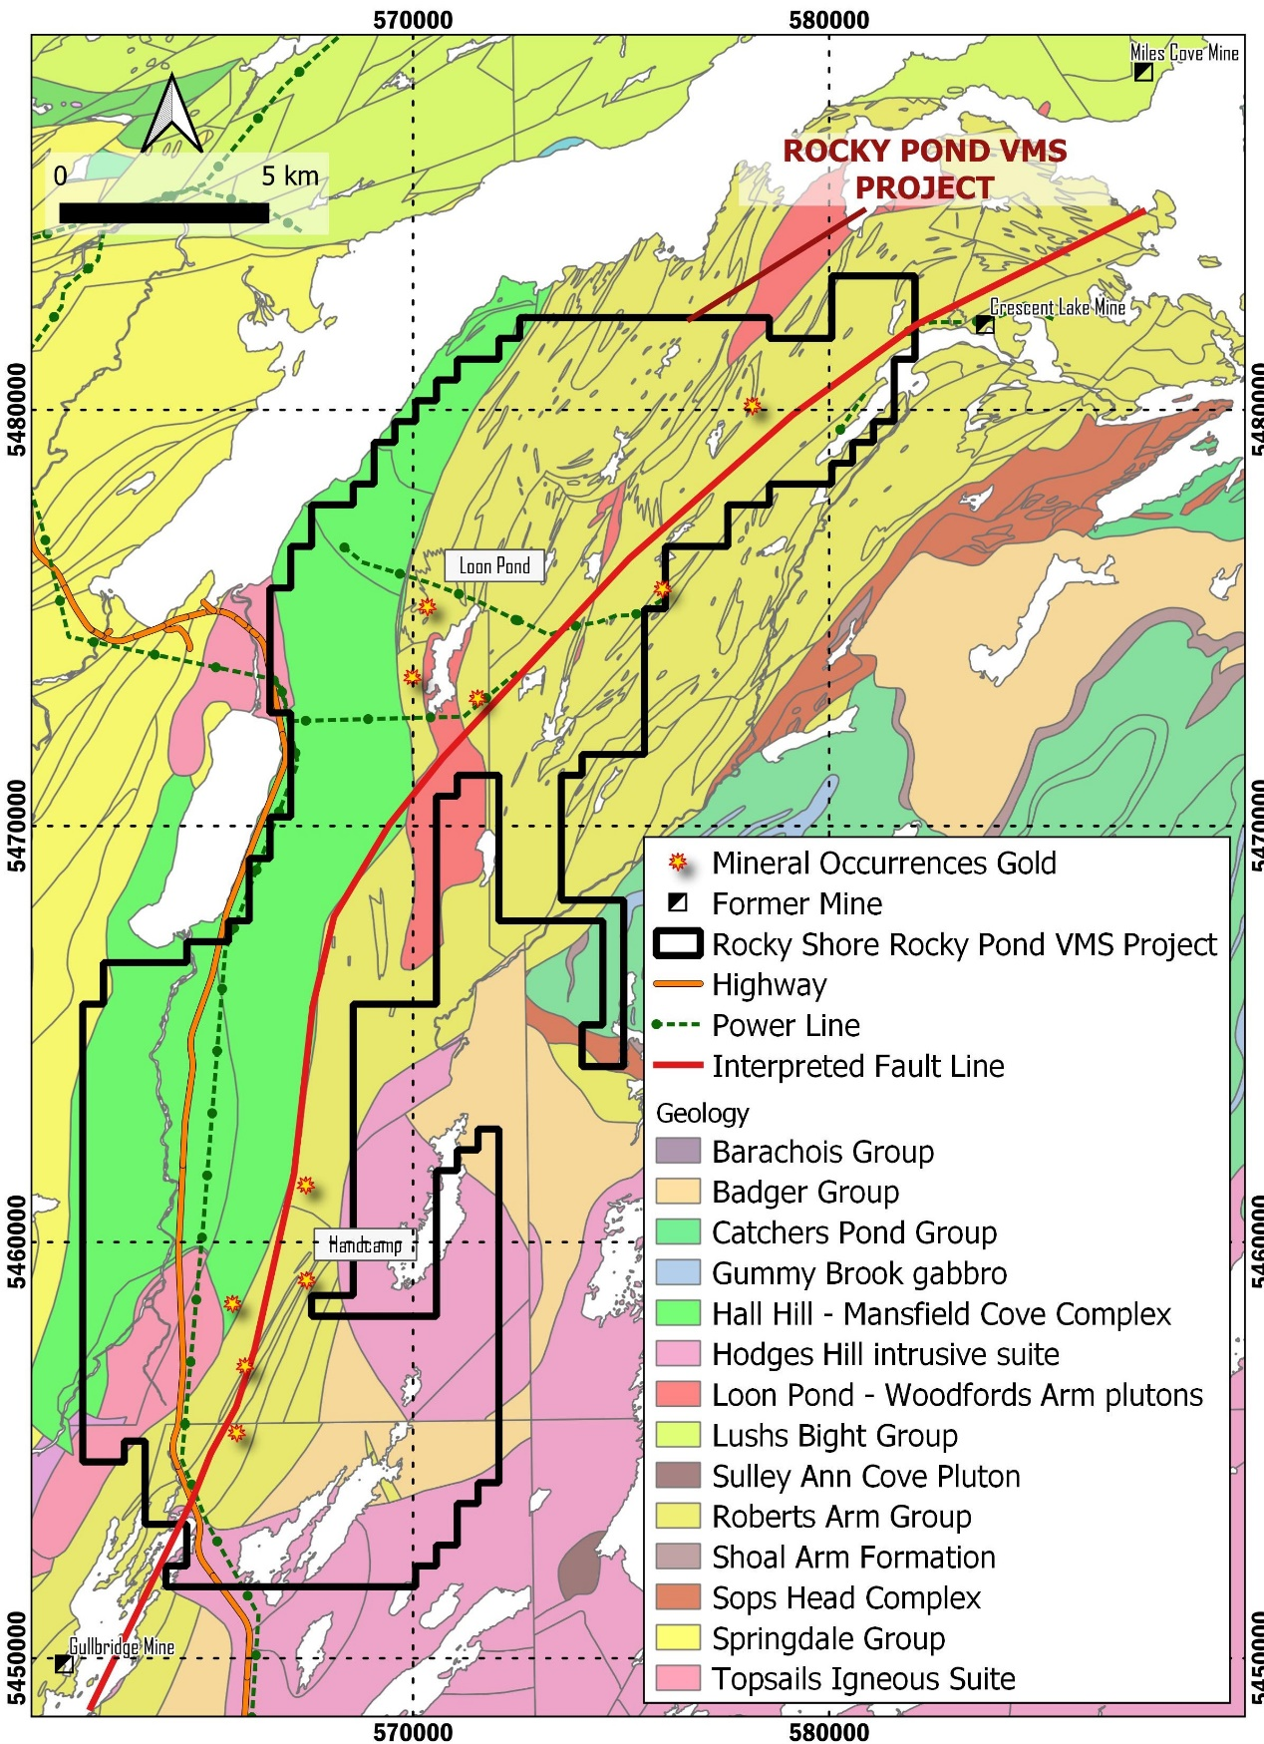
Map 2: Rocky Shore's Rocky Pond VMS Project: Geology of the Buchans-Roberts Arm VMS Belt, Red Indian Line Fault, location of significant mineralization (Handcamp, Loon Pond) within the project on trend to former mines.
Table 1: Handcamp Zone Drill Assay Highlights for 2022 drilling. The lengths below are drill hole lengths as true thickness is not known currently.
Hole* | From (m) | To (m) | Length (m) | Au g/t | Ag g/t | Zn % | Cu % | Pb % | AuEq g/t** |
H22-01 | 12.10 | 23.95 | 11.85 | 2.57 | 19.35 | 0.49 | 0.04 | 0.28 | 2.89 |
including | 12.10 | 19.40 | 7.30 | 3.94 | 29.01 | 0.70 | 0.06 | 0.42 | 4.41 |
H22-02 | 19.25 | 45.50 | 26.25 | 1.05 | 7.57 | 0.21 | 0.02 | 0.07 | 1.17 |
including | 19.25 | 30.30 | 11.05 | 1.92 | 11.32 | 0.31 | 0.02 | 0.09 | 2.08 |
H22-03 | 10.20 | 32.15 | 21.95 | 2.00 | 12.42 | 0.36 | 0.02 | 0.20 | 2.20 |
including | 10.20 | 21.55 | 11.35 | 3.64 | 21.42 | 0.65 | 0.04 | 0.36 | 3.98 |
H22-04 | 13.05 | 38.10 | 25.05 | 1.70 | 13.53 | 0.34 | 0.06 | 0.29 | 1.96 |
including | 13.05 | 24.65 | 11.60 | 3.06 | 22.86 | 0.50 | 0.12 | 0.51 | 3.50 |
H22-05 | 17.90 | 21.55 | 3.65 | 1.89 | 16.88 | 0.66 | 0.05 | 0.36 | 2.26 |
H22-06 | 20.10 | 37.60 | 17.50 | 1.13 | 8.35 | 0.28 | 0.02 | 0.11 | 1.29 |
including | 20.10 | 31.10 | 11.00 | 1.53 | 10.64 | 0.30 | 0.02 | 0.10 | 1.70 |
H22-07 | 27.10 | 35.50 | 8.40 | 0.22 | 4.00 | 0.16 | 0.07 | 0.16 | 0.37 |
H22-08 | 20.15 | 25.15 | 5.00 | 0.19 | 4.07 | 0.44 | 0.06 | 0.11 | 0.40 |
H22-09 | 31.05 | 53.75 | 22.70 | 0.84 | 2.46 | 0.50 | 0.02 | 0.24 | 0.99 |
H22-10 | 68.45 | 80.70 | 12.25 | 2.28 | 20.81 | 0.35 | 0.05 | 0.29 | 2.61 |
and | 95.45 | 101.00 | 5.55 | 2.99 | 4.58 | 0.05 | 0.01 | 0.03 | 2.92 |
H22-11 | 36.95 | 43.90 | 6.95 | 2.14 | 20.53 | 0.49 | 0.02 | 0.32 | 2.49 |
H22-12 | 39.70 | 51.30 | 11.60 | 0.38 | 5.86 | 0.39 | 0.02 | 0.13 | 0.56 |
H22-13 | 59.50 | 82.10 | 22.60 | 0.47 | 5.08 | 0.34 | 0.02 | 0.17 | 0.64 |
H22-14 | 27.60 | 36.15 | 8.55 | 1.52 | 30.15 | 1.02 | 0.27 | 0.46 | 2.38 |
Including | 27.60 | 31.70 | 4.10 | 3.03 | 59.71 | 1.41 | 0.53 | 0.82 | 4.58 |
H22-17 | 43.55 | 54.65 | 11.10 | 0.69 | 22.16 | 1.09 | 0.18 | 0.42 | 1.41 |
including | 43.55 | 47.85 | 4.30 | 1.54 | 51.46 | 1.24 | 0.38 | 0.48 | 2.85 |
H22-18 | 23.05 | 35.60 | 12.55 | 0.89 | 13.63 | 0.60 | 0.09 | 0.30 | 1.32 |
including | 23.05 | 31.15 | 8.10 | 1.29 | 19.63 | 0.58 | 0.11 | 0.22 | 1.74 |
H22-19 | 48.00 | 64.40 | 16.40 | 0.77 | 5.71 | 0.44 | 0.05 | 0.20 | 0.98 |
including | 48.00 | 49.85 | 1.85 | 3.31 | 24.15 | 1.06 | 0.23 | 0.90 | 4.02 |
*Holes H22-15 and 16 tested additional targets with no significant values. **Metal equivalent grades (AuEq) are for illustrative purposes only to express the combined value of gold, silver, zinc, lead and copper as a single metal grade. Metal equivalent grades are calculated using September 3, 2026 spot prices: US$4,475/oz gold, US$66.87/oz silver, US$1.84/pound zinc, US$0.85/pound Pb, and US$6.52/pound copper. Metallurgical recoveries are assumed to be 95% for gold and silver, 85% for copper and 80% for zinc and lead. The following equation is used to calculate AuEq = (percent Cu / 100 X lbs/tonne X price per pound Cu X recovery)/price of Au per gram + (percent Zn / 100 X lbs/tonne X price per pound Zn X recovery)/price of Au per gram + (percent Pb / 100 X lbs/tonne X price per pound Pb X recovery)/price of Au per gram + (Ag gpt X price of Ag per gram)/price Au per gram + (gpt Au X recovery). Rocky Shore has not verified the accuracy of the values in
Table 1.
Table 2: Handcamp Zone drill hole summary
Hole ID | Northing | Easting | Elevation | Azimuth | Dip | Length (m) |
H22-01 | 5459297.0 | 567585.0 | 221.0 | 110.0 | -42 | 44.70 |
H22-02 | 5459297.0 | 567585.0 | 221.0 | 110.0 | -70 | 95.00 |
H22-03 | 5459306.4 | 567582.9 | 219.7 | 102.7 | -45 | 53.00 |
H22-04 | 5459306.4 | 567582.9 | 219.7 | 102.7 | -68 | 74.00 |
H22-05 | 5459326.0 | 567589.6 | 221.6 | 100.6 | -50 | 29.00 |
H22-06 | 5459287.0 | 567571.3 | 221.2 | 100.0 | -55 | 62.00 |
H22-07 | 5459023.7 | 567468.3 | 235.2 | 110.9 | -50 | 96.82 |
H22-08 | 5459035.0 | 567479.1 | 234.4 | 115.7 | -50 | 32.00 |
H22-09 | 5458764.1 | 567333.7 | 238.5 | 109.9 | -53 | 65.00 |
H22-10 | 5458735.0 | 567327.5 | 236.6 | 111.8 | -50 | 134.00 |
H22-11 | 5458770.0 | 567311.0 | 236.6 | 112.0 | -50 | 65.00 |
H22-12 | 5459269.0 | 567558.0 | 221.0 | 105.0 | -50 | 64.40 |
H22-13 | 5459304.0 | 567544.0 | 224.5 | 111.9 | -52 | 105.00 |
H22-14 | 5459164.0 | 567514.0 | 223.5 | 105.0 | -52 | 71.60 |
H22-15 | 5459118.0 | 567100.0 | 235.5 | 70.0 | -50 | 93.40 |
H22-16 | 5459228.5 | 567197.4 | 237.8 | 70.0 | -50 | 128.00 |
H23-17 | 5458945.0 | 567440.0 | 229.3 | 105.0 | -55 | 63.00 |
H23-18 | 5458934.0 | 567448.0 | 232.4 | 105.0 | -54 | 66.00 |
H23-19 | 5458969.0 | 567427.0 | 232.2 | 105.0 | -50 | 72.00 |
QUALIFIED PERSON
Ken Lapierre, P. Geo., President and CEO of the Company, is a Qualified Person in accordance with the Canadian regulatory requirements as set out in National Instrument 43-101 and has reviewed the historical documentation for all properties and has approved the scientific and technical information that forms the basis for the disclosure contained in this news release.
ABOUT ROCKY SHORE GOLD LTD.
Rocky Shore Gold is a Canadian junior explorer focused on two projects in central Newfoundland: Gold Anchor and Rocky Pond VMS. The more than 1,200-square-kilometre Gold Anchor Project is the second-largest property in an emerging, underexplored Canadian gold district. It hosts the near-surface, bulk-scale Mosquito and Reid orogenic gold deposits, the bulk-scale MTH Zone and structurally controlled targets, including the Lucky 13 Au-Sb Zone along the Appleton Fault Corridor, southwest of and along trend from major gold discoveries and deposits. The Rocky Pond VMS Project, in the Roberts Arm VMS Belt and on trend to the former world-class Buchans mine, contains the gold-rich, high-grade Handcamp VMS Zone and several copper-rich VMS showings along a 40-kilometre trend.
Please visit our website at www.rockyshoregold.com.
Rocky Shore Gold would like to acknowledge the $150,000 in financial support received for 2025, and the approval of the 2026 Junior Exploration Assistance (JEA) administered by the Mineral Incentive Program from the Mineral Development Division, Department of Energy and Mines, Government of Newfoundland and Labrador.
For more information, please contact:
Ken Lapierre, President & CEO
Rocky Shore Gold Ltd.
T: +1 (647) 678-3879
E: ken@rockyshoregold.com
Cathy Hume, CEO
CHF Capital Markets
T: +1 (416) 868-1079 x 251
E: cathy@chfir.com
FORWARD-LOOKING INFORMATION
This news release contains "forward-looking information" within the meaning of applicable Canadian securities laws. Generally, forward-looking information can be identified by the use of forward-looking terminology such as "plans", "expects", or "does not expect", "is expected", "budget", "scheduled", "estimates", "forecasts", "intends", "anticipates", or "does not anticipate", or "believes" or variations of such words and phrases or state that certain actions, events or results "may", "could", "would", "might", or "will be taken", "occur", or "be achieved". Certain information set forth in this news release may contain forward-looking information that involves substantial known and unknown risks and uncertainties, including, but not limited to, the acquisition of the additional noted properties and the advancement of the Company's properties post-acquisition. The forward-looking information is based on reasonable assumptions and estimates of the management of the Company at the time such statements were made and is subject to known and unknown risks, uncertainties and other factors that may cause the actual results, level of activity, performance or achievements of Rocky Shore to be materially different from those expressed or implied by such forward-looking information, including risks associated with the exploration; future commodity prices; changes in regulations; political or economic developments; environmental risks; permitting timelines; capital expenditures; technical difficulties in connection with exploration activities; employee relations; the speculative nature of mineral exploration, including the risks of diminishing quantities of grades of resources, contests over title to properties, the Company's limited operating history, future capital needs and uncertainty of additional financing, and the competitive nature of the mining industry; the need for the Company to manage its future strategic plans; global economic and financial market conditions; uninsurable risks; and changes in project parameters as plans continue to be evaluated. Although Rocky Shore has attempted to identify important factors that could cause actual results to differ materially from those contained in the forward-looking information, there may be other factors that cause results not to be as anticipated, estimated or intended. Although the forward-looking information contained in this news release is based upon what management of the Company believes, or believed at the time, to be reasonable assumptions, Rocky Shore cannot assure shareholders that actual results will be consistent with such forward-looking information, as there may be other factors that cause results not to be as anticipated, estimated or intended. Accordingly, readers should not place undue reliance on forward-looking information. There can be no assurance that forward-looking information, or the material factors or assumptions used to develop such forward-looking information, will prove to be accurate. Rocky Shore does not undertake any obligations to release publicly any revisions for updating any voluntary forward-looking information, except as required by applicable securities law.
Neither the Canadian Securities Exchange nor its Market Regulator (as that term is defined in the policies of the Canadian Securities Exchange) accepts responsibility for the adequacy or accuracy of this release.
SOURCE: Rocky Shore Gold Ltd.
View the original press release on ACCESS Newswire:
https://www.accessnewswire.com/newsroom/en/metals-and-mining/rocky-shore-initiates-exploration-at-rocky-pond-drilling-planned-for-q1-2027-1246132
