

VANCOUVER, BC / ACCESS Newswire / June 9, 2026 / Kalo Gold Corp. (TSXV:KALO)(OTCID:KLGDF)(FSE:9M51) ("Kalo", "Kalo Gold" or the "Company") is pleased to report that its 2026 surface campaign at Wainikoro, on the 100%-owned Vatu Aurum Project in Fiji, has identified multiple in-situ low-sulphidation epithermal quartz veins in rock - including a chalcedonic quartz vein returning 1,157 dU (~1.16 g/t Au estimated) and surrounding float at 3,397 dU (~3.40 g/t Au estimated) as determined through detectORE analysis (see Technical Notes on detectORE Gold Screening Results, below). Integrated 2026 soil-geochemistry and airborne magnetic data extend the previously disclosed >1 km arsenic-in-soil anomaly at Wainikoro (22 April 2026 news release) to approximately 1,800 m of strike length, oriented NW-SE within the central magnetic-low feature.
These results align with the Company's 27 May 2026 reinterpretation of Vatu Aurum as a single, multi-phase, structurally reactivated volcanic complex, and sharpen the targeting framework ahead of the next phase of drilling. The recently completed 6,212 line-kilometre airborne magnetic and radiometric survey is being integrated with surface mapping, trenching and soil geochemistry, with an induced polarization ("IP") survey at Wainikoro planned for July 2026 mobilisation; drilling will follow once the integrated dataset is in hand.
Highlights
In-situ epithermal gold veins identified - the 2026 surface campaign at Wainikoro identified multiple in-situ low-sulphidation epithermal quartz veins in rock, including a chalcedonic quartz vein at 1,157 dU (~1.16 g/t Au estimated) with surrounding float up to 3,397 dU (~3.40 g/t Au estimated).
Additional headline surface values - 2,728 dU (~2.73 g/t Au est.) from a chalcedonic-banded quartz vein in bedded tuff; 1,364 dU (~1.36 g/t Au est.) from the adjacent silicified polymictic breccia; 916 dU and 904 dU from silicified host rocks (see Table 1).
Trench results - channel sampling returned values up to 1,446 dU (~1.45 g/t Au estimated); a 13-metre channel interval at TR26-011 averaged 275 dU (~0.28 g/t Au estimated) within silicified fault-controlled structures.
Multi-dataset convergence on a 1,800 m corridor - arsenic-in-soil, magnetic-low features and surface vein samples converge on an approximately 1,800 m NW-SE corridor within the central magnetic-low feature (Figures 4 to 6).
Wainikoro footprint broadening on magnetic lows - beyond the central approximately 1,800 m corridor, additional arsenic-in-soil anomalies across the Wainikoro area coincide with discrete magnetic-low features in the recently completed 6,212 line-kilometre airborne magnetic survey, extending the magnetic-low-controlled target footprint across Wainikoro.
Near-term catalysts - induced polarization (IP) survey at Wainikoro planned for July 2026 mobilisation; certified Fire Assay results from VA26-DH18 and VA26-DH19 pending (per the 22 April 2026 news release).
2026 soil-geochemistry programme - 9,994 soil samples collected to date with a further 5,390 samples planned across magnetic-driven grids based on the recently completed airborne magnetic survey.
Building a Project-Wide Exploration Model
This work builds directly on the updated structural and geological interpretation announced on 27 May 2026, which framed the Vatu Aurum Project as a single, multi-phase, structurally reactivated volcanic complex rather than a series of separate prospects. Earlier drilling was conducted concurrently with surface mapping, geochemistry and the airborne magnetic survey - providing the geological control required to interpret the geophysical response and to integrate subsurface observations into the project-wide model.
Consistent with the 27 May 2026 interpretation, the Company identifies the West-East Transfer Zone ("WETZ") as a regional accommodation corridor expressed as a continuous magnetic low and interpreted as a first-order control on fluid migration across the project. The Nubu Graben - reinterpreted as structurally segmented, en-echelon, and locally offset rather than continuous - is cut by a network of NW-SE oblique faults, Riedel shears and transfer faults that, on present interpretation, perform the dominant gold-hosting structural work at Wainikoro and property wide. The highest fracture density and dilation are expected at intersections of the oblique fault network with the WETZ and the graben margins (Figure 1).
Surface geological mapping, soil and rock geochemistry, detectORE screening and trench results at Wainikoro converge with the new airborne magnetic data on the same structural intersections (Figure 3) - providing a coherent geological explanation for the distribution of gold, arsenic, silicification and hydrothermal brecciation observed at surface, and sharpening the Company's ability to vector toward priority drill targets.

Figure 1 - Vatu Aurum Domain Model - see Figures 2 to 6 for detail (red outline).
Wainikoro Continues to Deliver Encouraging Surface Gold Responses
The 2026 field campaign at Wainikoro extends the surface programme reported in the Company's 22 April 2026 news release, which disclosed peak detectORE soil values of 1,640 dU (~1.64 g/t Au estimated) and 1,322 dU (~1.32 g/t Au estimated) within the previously defined arsenic-in-soil corridor. The traverse and rock-sampling campaign has identified multiple in-situ low-sulphidation epithermal quartz veins, silicified breccias and altered host rocks returning detectORE values of up to 3,397 dU (~3.40 g/t Au estimated).
An important geological observation is newly identified in-situ chalcedonic quartz veins with results of 1,157 dU, ~1.16 g/t Au estimated (KRN-LR26-027C). It occurs immediately adjacent to the KRN-ZB26-021 silicified polymictic breccia (1,364 dU, ~1.36 g/t Au estimated) and is surrounded by float material returning values up to 3,397 dU (~3.40 g/t Au estimated) at KRN-LR26-027A (Figures 7 and 8), consistent with weathering of a gold-bearing vein and breccia source at or near the float location. Table 1 summarises the detectORE values and lists multiple epithermal quartz veins identified across the campaign area, distinguishable by host rock, orientation and texture. These samples sit along an approximately 1,800 m NW-SE strike length within the central magnetic-low feature at Wainikoro (Figures 4 to 6).
DetectORE values from 2026 field traverse and rock-sampling campaign at Wainikoro are summarised in Table 1. Rock-type descriptions are diagnostic of the upper levels of a low-sulphidation epithermal gold system - chalcedonic and comb-textured quartz veining, silicified polymictic breccias, and pervasively silicified bedded and dacitic tuffs.
Sample ID | dU | ~g/t Au est. | Rock type and field description |
KRN-LR26-027A | 3,397 | ~3.40 | Chalcedonic quartz vein float surrounding the in-situ vein (KRN-LR26-027C). |
KRN-PS26-064B | 2,728 | ~2.73 | Chalcedonic-banded epithermal quartz vein in silicified bedded tuff with microcrystalline quartz and minor vugs. |
KRN-ZB26-021 | 1,364 | ~1.36 | Silicified polymictic volcanic breccia with pervasive silica alteration and spotty chlorite, adjacent to the in-situ chalcedonic vein. |
KRN-LR26-027C | 1,157 | ~1.16 | In-situ chalcedonic quartz vein, 10-20 cm wide. |
KRN-PS26-030 | 916 | ~0.92 | Silicified dacitic tuff; strongly silica-altered host within the silicified-brecciated-tuff signature shared by the highest-dU samples. |
KRN-JP26-037B | 904 | ~0.90 | Comb-textured epithermal quartz vein with chlorite-altered clay clasts. |
KRN-LR26-029 | 519 | ~0.52 | Silicified bedded tuff with submillimetre siliceous veinlet stockwork. |
KRN-LR25-039 | 482 | ~0.48 | Microcrystalline quartz float (2025 sample). |
KRN-JP26-039 | 467 | ~0.47 | 5-centimetre epithermal quartz vein with hematite weathering and manganese dendrites in silicified polymictic breccia. |
KRII-ZPB26-004 | 462 | ~0.46 | Chalcedonic quartz vein along ridge spur with vein selvage alteration; resistant chalcedony float through the outcrop. |
Table 1 - DetectORE surface samples (>450 dU, ~0.45 g/t Au estimated), traverse and rock-sampling campaigns at Wainikoro. dU values are semi-quantitative and not equivalent to certified Fire Assay; see Technical Notes on detectORE Gold Screening Results.
Additional surface samples in the 100-500 dU range (~0.1 - ~0.5 g/t Au estimated) across the same area at Wainikoro demonstrate the breadth of the gold-bearing footprint. Trench channel and point sampling returned values up to 1,446 dU (~1.45 g/t Au estimated) within silicified fault-controlled structures, with a 13-metre interval at TR26-011 averaging 275 dU (~0.28 g/t Au estimated) and point samples of 724 dU (~0.72 g/t Au estimated) at 14.5 m (TR26-011) and 701 dU (~0.70 g/t Au estimated) at 9 m (TR26-012). dU values are semi-quantitative and not equivalent to certified Fire Assay; see Technical Notes on detectORE Gold Screening Results.
The strongest detectORE responses consistently sit at intersections of the NW-SE oblique fault network with the WETZ corridor and the segmented Nubu Graben margins - the structural pattern defined in the Company's 27 May 2026 reinterpretation of Vatu Aurum as a single, multi-phase, structurally reactivated volcanic complex. The newly identified in-situ chalcedonic vein, the adjacent silicified breccia, the other quartz veins listed in Table 1 and the trench-hosted channel and point samples are spatially clustered along these intersection points, reinforcing the interpretation of a coherent, structurally controlled hydrothermal system at Wainikoro.
Expanding Geochemical Footprint
The Company's 22 April 2026 news release disclosed kilometre-scale arsenic-in-soil corridors at Wainikoro, including a >1 km anomaly above the 20 ppm As contour. Integration of the 2026 soil-geochemistry programme with the recently completed airborne magnetic survey now defines the principal corridor at approximately 1,800 m of strike length, oriented NW-SE within the central magnetic-low feature (Figures 4 to 6). Infill grids have progressively expanded the original arsenic anomaly, and new grids have been positioned to test magnetic-low features revealed by the airborne magnetic survey (Figure 2).
Preliminary portable XRF results from the new grids continue to identify arsenic and alteration-related anomalies spatially associated with magnetic-low features. A developing coherent arsenic-in-soil anomaly has been defined associated with one of several prominent magnetic-low features at Wainikoro, with arsenic continuing to behave as the principal pathfinder element for the underlying low-sulphidation epithermal system. A broader multi-element pathfinder signature - antimony and mercury alongside arsenic - supports that interpretation. Elsewhere at Wainikoro, the soil programme has identified potassic-depletion patterns spatially associated with magnetic-low features, consistent with the alteration footprint of an upper-level hydrothermal system.
Beyond the central approximately 1,800 m corridor, the 2026 programme has advanced additional arsenic-in-soil anomalies elsewhere across the Wainikoro area. Whereas the earlier interpretation relied on historical regional total magnetic intensity ("TMI") data, the recently completed 6,212 line-kilometre high-resolution airborne magnetic survey now resolves discrete magnetic-low features beneath these anomalies, reinforcing the interpretation that arsenic-in-soil at Wainikoro is consistently controlled by magnetic-low structures. Together with the central corridor, these anomalies extend the magnetic-low-controlled target footprint across the Wainikoro area, which is being prioritised for follow-up mapping, trenching and soil geochemistry.
The convergence of arsenic, alteration-related and multi-element geochemical anomalies with magnetic-low features and the structural intersections defined in the Company's 27 May 2026 reinterpretation provides increasingly defensible inputs for prioritising follow-up trenching and drill targeting at Wainikoro.
Next Steps
Building on the surface results disclosed in this release and the integration of the recently completed airborne magnetic and radiometric survey, near-term work across the Vatu Aurum Project will focus on:
Follow-up trenching at the newly identified in-situ chalcedonic quartz vein and adjacent silicified breccia and quartz-vein targets at Wainikoro.
Induced polarization ("IP") surveys at Wainikoro, with IP planned for July 2026 mobilisation, to test the subsurface geometry of magnetic-low features and the structural intersections defined in the 27 May 2026 reinterpretation.
Final integration of the 6,212 line-kilometre high-resolution airborne magnetic and radiometric dataset into the project-wide structural and geological model; further work at Aurum Prime, including any further drilling, is pending completion of that integration.
At Coqeloa, a detailed caldera-scale BLEG (bulk leach extractable gold) stream-sediment sampling programme is planned together with systematic geological mapping, to advance the area in parallel with Wainikoro.
Receipt and interpretation of certified Fire Assay results from VA26-DH18 and VA26-DH19 at Wainikoro (pending; per the Company's 22 April 2026 news release).
Refinement, ranking and prioritisation of drill-ready targets across the Vatu Aurum Project, in support of the next phase of drilling - which the Company has confirmed will not commence until the airborne magnetic dataset is fully integrated into the exploration model.
CEO Commentary
Terry L. Tucker, P.Geo., President and CEO of Kalo Gold, commented:
"We have moved Wainikoro from kilometre-scale arsenic anomalies in soil to multiple in-situ epithermal quartz veins in rock in the last month - including a newly identified chalcedonic vein - with detectORE surface values up to 3,397 dU, approximately 3.4 g/t Au estimated. That is a real step forward. What I find particularly compelling is that our geological mapping, structural interpretation, airborne geophysics, trenching and geochemistry are now converging on the same ground at Wainikoro - telling us not only where the gold sits but why it sits there. As we trench the vein targets, plan to mobilise IP in July, and integrate the 6,212 line-kilometre airborne magnetic datasets, we are building a strong pipeline of drill-ready opportunities across the Vatu Aurum Project."
Technical Notes on detectORE Gold Screening Results
This news release references gold (Au) values reported in detectORE Units ("dU"), generated using the detectORE field-based gold analysis system developed by Portable PPB Pty Ltd. dU values represent a semi-quantitative, ppb-equivalent measure of leachable gold response and are used for exploration screening purposes only. They are not a direct measure of total gold content and are not equivalent to certified Fire Assay results. Accordingly, dU results are not used to estimate Mineral Resources or Mineral Reserves.
Internal validation work conducted by the Company in 2025 on 824 samples from the Vatu Aurum Project demonstrated a strong correlation between dU values and certified Fire Assay results (Pearson R = 0.98 for drill core; R = 0.96 for trench samples). Soil dU results have not been directly validated against Fire Assay. While a positive relationship exists, it is variable across different ranges and may be influenced by lithology, mineralogy, and sample preparation. Any approximate equivalence (e.g. ~1,000 dU ˜ ~1 g/t Au) is provided for contextual reference only and should not be relied upon for grade estimation. For full details, refer to the Company's news release dated 24 February 2026.
Qualified Person
The technical information in this news release was prepared, reviewed, and approved by Andrew Randell, P.Geo., CEO and Principal Geoscientist of SGDS-Hive, Technical Director of the Vatu Aurum Project, and a Qualified Person as defined by NI 43-101. Mr. Randell is independent of the Company and has verified the data disclosed, having conducted multiple site visits (2023-2026) and direct supervision of the exploration program.
Quality Assurance / Quality Control
Soil, traverse and trench samples referenced in this news release were collected under qualified geological supervision following industry-standard protocols. XRF analysis was performed on site using calibrated portable analyzers. detectORE screening data is QA/QC managed through Portable PPB's pLIMS system, including calibration verification, reference materials, blanks and duplicates. Selected samples are submitted to ALS Limited (Australia) for confirmatory analysis by Au-AA25 (30 g Fire Assay, AAS Finish). ALS is accredited by NATA to ISO/IEC 17025 and is independent of the Company and the Qualified Person.
About Kalo Gold Corp.
Kalo Gold Corp. is a gold exploration company advancing the 100%-owned Vatu Aurum Project (Special Prospecting Licences 1511 and 1464), a 367 km² land package on Vanua Levu, Fiji, located in a preserved volcanic back-arc setting. The Company's work is focused on a northeast-trending corridor of low-sulphidation epithermal gold targets. Exploration across the corridor - including at the flagship Aurum Prime area and Wainikoro - has defined multiple structurally controlled gold targets supported by drilling, trenching, soil geochemistry, structural mapping and airborne geophysics. The Company is systematically advancing high-confidence targets toward discovery.
Kalo Gold Corp. is headquartered in Vancouver, British Columbia, and is listed on the TSX Venture Exchange (KALO), the OTCID Market (KLGDF), and the Frankfurt Stock Exchange (9M51). For further information, visit www.kalogoldcorp.com.
On behalf of the Board of Directors of Kalo Gold Corp.
Terry L. Tucker, P.Geo.
President and Chief Executive Officer
Kevin Ma, CPA, CA
Executive Vice President, Capital Markets and Director
For further information: info@kalogoldcorp.com | www.kalogoldcorp.com
Neither the TSX Venture Exchange nor its Regulation Services Provider (as that term is defined in the policies of the Exchange) accepts responsibility for the adequacy or accuracy of this press release.
Cautionary Statement Regarding Forward-Looking Information
This news release contains "forward-looking statements" and "forward-looking information" within the meaning of applicable Canadian securities laws. Forward-looking statements can often be identified by the use of words such as "will", "may", "should", "could", "would", "anticipate", "believe", "estimate", "expect", "intend", "plan", "potential", "continue", "target", "scheduled", and similar expressions, or statements that certain events or conditions "will", "may", or "could" occur.
Forward-looking statements in this news release include, but are not limited to: (i) the Company's interpretation, as announced on 27 May 2026, of the Vatu Aurum Project as a single, multi-phase, structurally reactivated volcanic complex, and the application of that interpretation to advance Wainikoro within the segmented, en-echelon Nubu Graben; (ii) the interpretation of the West-East Transfer Zone ("WETZ") as a regional accommodation corridor expressed as a continuous magnetic low and as a first-order control on fluid migration; the interpretation that the Nubu Graben is structurally segmented and en-echelon; and the interpretation that NW-SE oblique faults, Riedel shears and transfer faults represent the dominant gold-hosting structural grain on present interpretation; (iii) the interpretation that magnetic-low anomalies identified by airborne geophysical surveys represent zones of hydrothermal alteration and fluid flow and constitute priority exploration targets; (iv) the interpretation that arsenic and alteration-related geochemical patterns are pathfinders for structurally focused hydrothermal activity at Wainikoro; (v) the timing, scope and results of planned follow-up trenching, mapping, soil geochemistry, induced polarization surveys and drill-target ranking across Wainikoro; and (vi) the Company's ability to secure financing, permits, and regulatory approvals required to advance exploration on the Vatu Aurum Project.
Forward-looking statements are based on a number of assumptions that the Company considers reasonable but which may prove to be inaccurate, including: that the Company will be able to fund and execute the planned exploration programs; that permits, tenure, and licences will remain in good standing; that there will be no adverse change in the political, regulatory, or operational environment in Fiji, including potential fuel shortages; and that commodity prices and capital markets conditions will support continued exploration.
Forward-looking statements are subject to known and unknown risks and uncertainties that may cause actual results, performance, or achievements to differ materially from those expressed or implied, including: exploration and drilling risk; the risk that detectORE dU screening results may not be confirmed by certified Fire Assay (detectORE dU values are semi-quantitative screening estimates and are not equivalent to quantitative gold grades; soil dU results have not been directly validated against Fire Assay); the risk that geological, geochemical, geophysical, and structural interpretations may change with additional data; permit, tenure, and title risk; risks of operating in Fiji, including fuel supply, logistics, and currency risk; dependence on key personnel; environmental, health, and safety risk; financing and dilution risk; and commodity price volatility. Readers are cautioned not to place undue reliance on forward-looking statements.
The Company does not undertake any obligation to update or revise any forward-looking statements, whether as a result of new information, future events, or otherwise, except as required by applicable securities laws. Readers are directed to the Company's continuous disclosure filings available on SEDAR+ at www.sedarplus.ca, including its most recent Management's Discussion and Analysis, for a more complete discussion of the risks affecting the Company and its business.
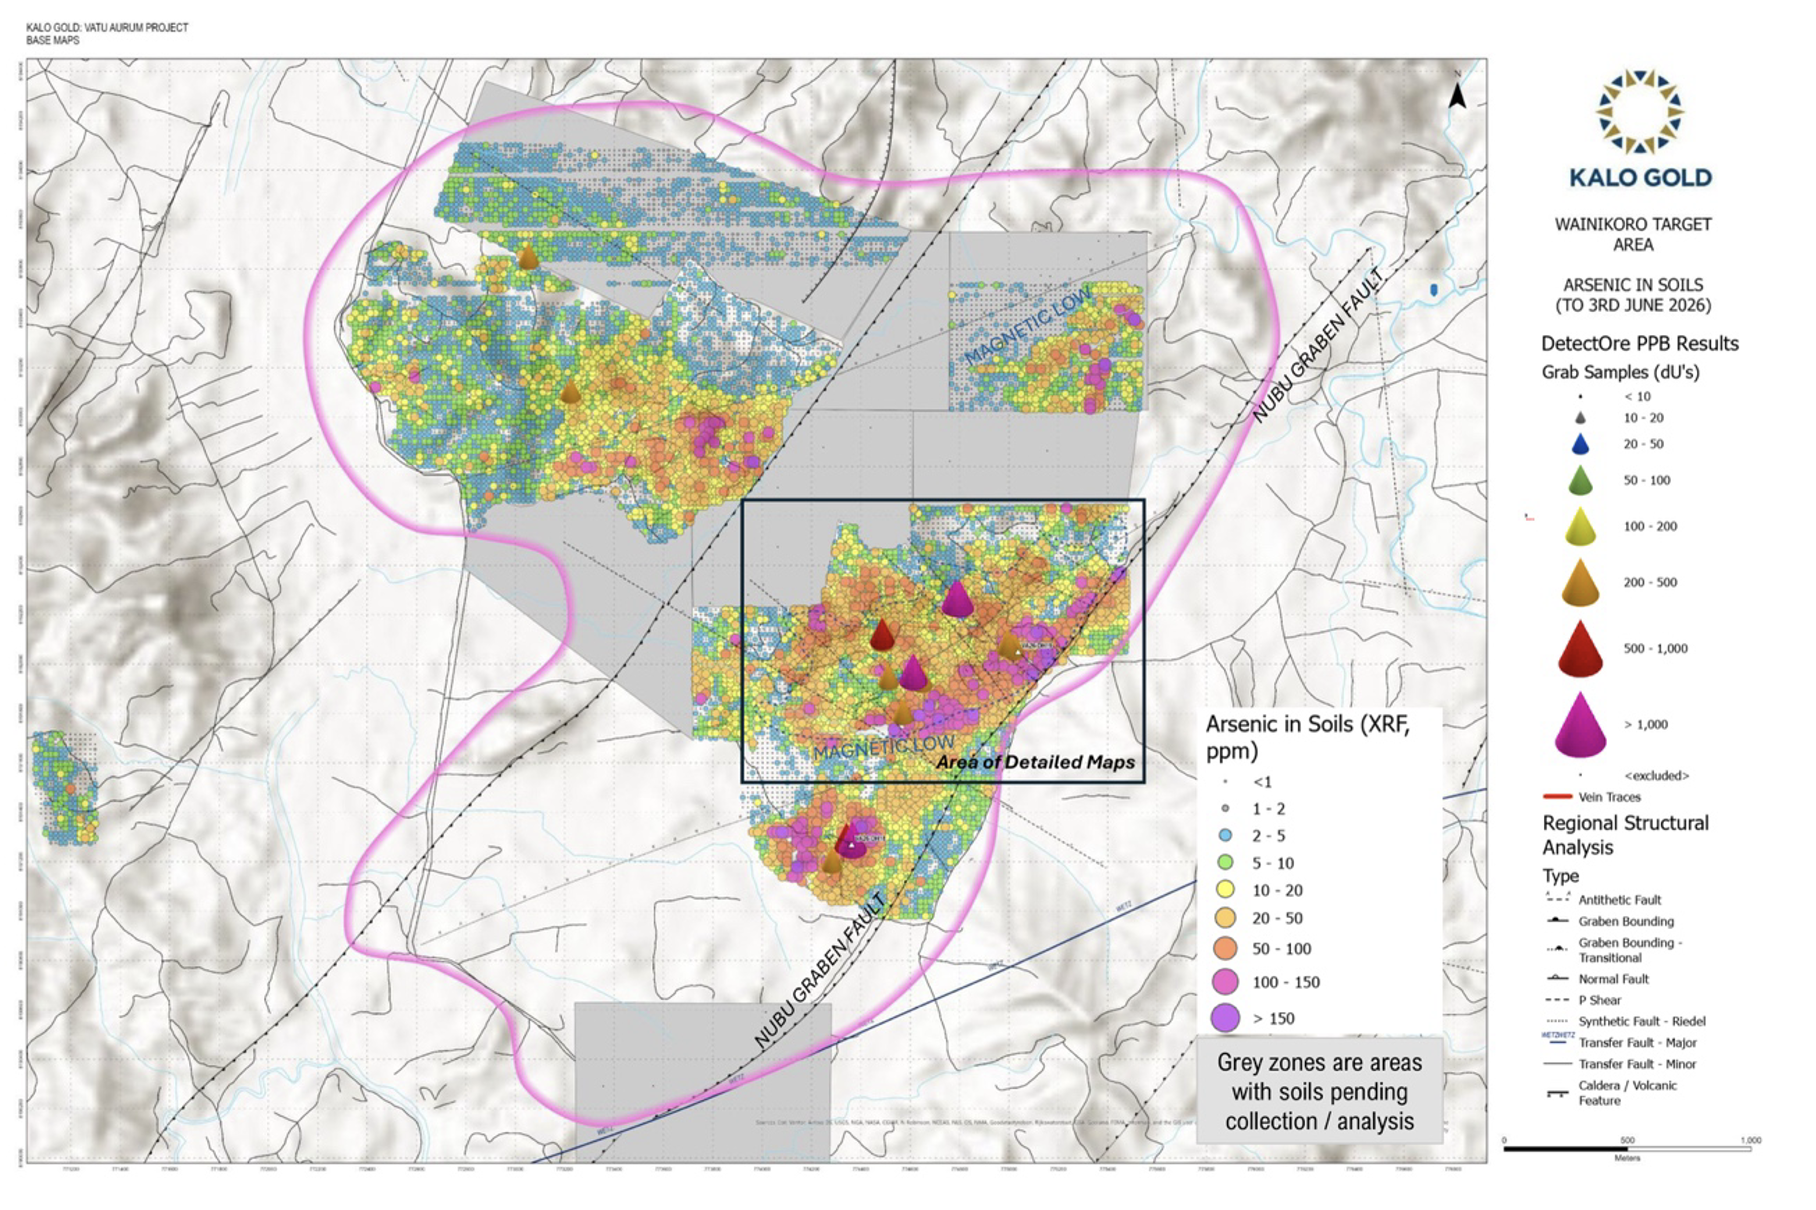
Figure 2 - Wainikoro Target Area: arsenic in soils (pXRF, ppm) to 3 June 2026; black box = detail area of Figures 4 to 6.

Figure 3 - Wainikoro Target Area: preliminary total magnetic intensity (TMI) from the 2026 airborne magnetic survey.

Figure 4 - Wainikoro detail: arsenic-in-soil contours within the central magnetic low; ~1,800 m strike length, NW-SE.

Figure 5 - Wainikoro detail: preliminary TMI geophysics; vein traces in red.

Figure 6 - The hydrothermal breccia zones (HBX) and silicified polymictic breccia samples lie along the 1,800 m strike length of the central magnetic-low feature.
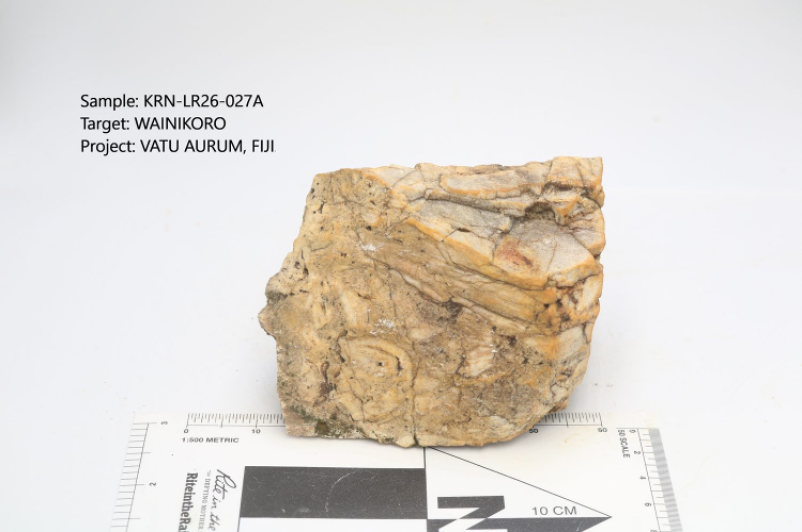
Figure 7 - KRN-LR26-027A: chalcedonic quartz vein float, surface grab sample at Wainikoro; 3,397 dU (~3.40 g/t Au estimated). Collected adjacent to the in-situ chalcedonic vein at KRN-LR26-027C.
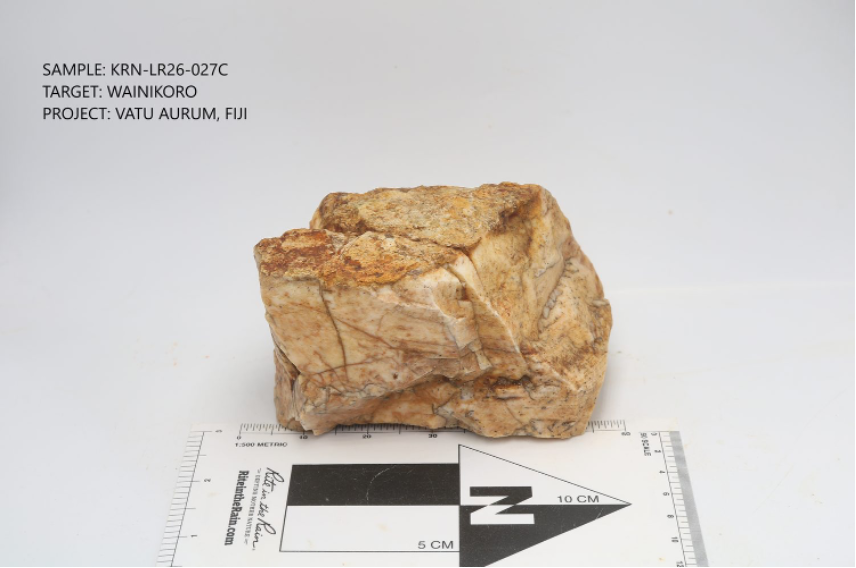
Figure 8 - KRN-LR26-027C: in-situ chalcedonic quartz vein, 10-20 cm wide, surface sample at Wainikoro; 1,157 dU (~1.16 g/t Au estimated).
SOURCE: Kalo Gold Corp.
View the original press release on ACCESS Newswire:
https://www.accessnewswire.com/newsroom/en/metals-and-mining/kalo-gold-identifies-in-situ-epithermal-gold-veins-at-wainikoro-surface-values-up-1174042
