

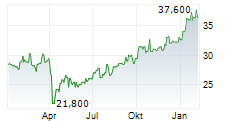
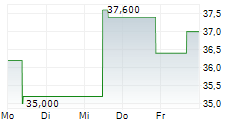
LUXEMBOURG, LU / ACCESS Newswire / August 4, 2026 / Ternium S.A. (NYSE:TX) today announced its results for the second quarter and first half ended June 30, 2026.
The financial information contained in this press release is based on Ternium S.A.'s consolidated condensed interim financial statements prepared in accordance with IAS 34 "Interim financial reporting" (IFRS). Interim financial figures are unaudited. The financial and operational information is presented in U.S. Dollars ($) and metric tons, except otherwise indicated. This press release includes certain non-IFRS alternative performance measures such as Adjusted EBITDA, Cash Operating Income, Free Cash Flow, Net Debt and Net Cash. The reconciliation of these figures to the most directly comparable IFRS measures is included in Exhibit I.
Second Quarter of 2026Highlights
Note: Figures compared to first quarter of 2026.
Summary of Second Quarter of 2026
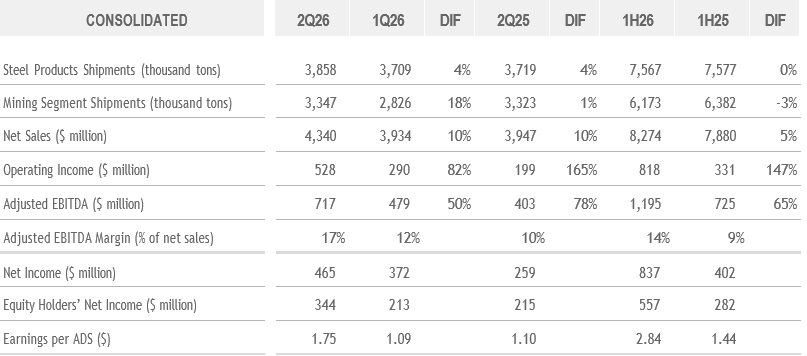
Note: Each American Depositary Share, or ADS, represents 10 shares of Ternium's common stock. Results are based on a weighted average number of shares of common stock outstanding (net of treasury shares) of 1,963,076,776.
Second Quarter of 2026Highlights
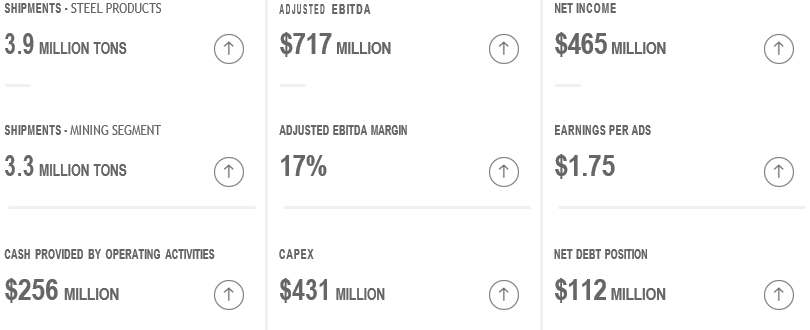
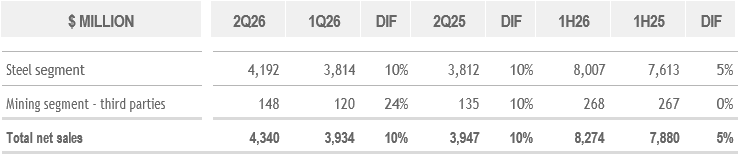
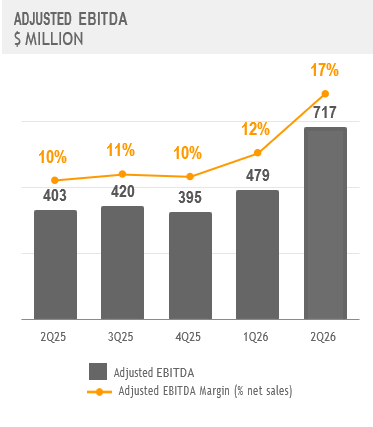
Ternium delivered a robust performance in the second quarter of 2026. Adjusted EBITDA rose sequentially by 50% to $717 million, driven by higher sales volumes and better margins. In Mexico, steel market fundamentals continued to strengthen, amid the implementation of more effective measures against unfairly traded steel imports and the normalization of inventories across the value chain. Likewise, the measures adopted by the Brazilian government to promote fair competition contributed to a more constructive business sentiment across the domestic steel industry. Meanwhile, sales volumes in the Southern Region rebounded in line with seasonal demand trends. The company's net income in the second quarter of 2026 reached $465 million.
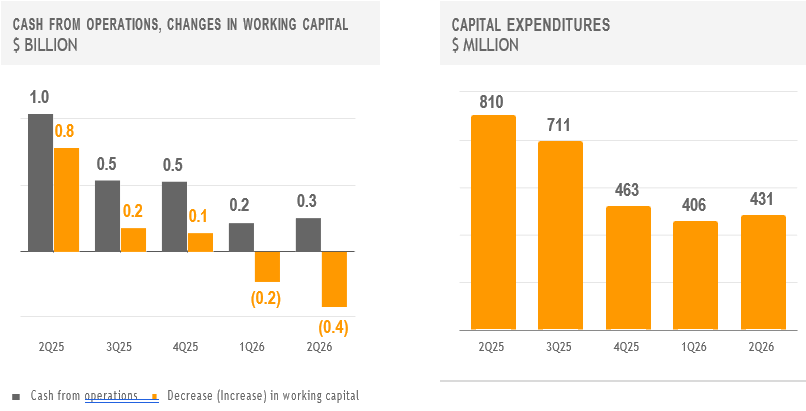
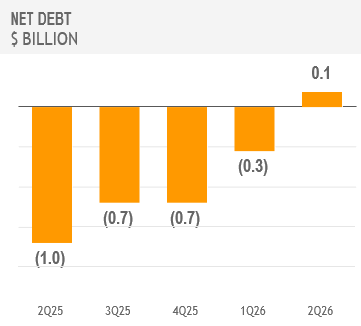
Capital expenditures amounted to $431 million during the second quarter. The construction of Ternium's new steel shop at its industrial center in Pesquería, Mexico, is progressing on schedule. In May 2026, the company paid a dividend to shareholders of $255 million, corresponding to the balance of the total dividend declared for the year 2025. Meanwhile, cash flow from operating activities amounted to $256 million after a $418 million increase in working capital, primarily in connection with higher sales and increased costs. The company recorded a Net Debt position of $112 million at the end of June 2026, compared to Net Cash position of $327 million at the end of March 2026.
Outlook
Ternium expects Adjusted EBITDA to increase in the third quarter of 2026 compared to the second quarter, driven by higher shipments and an improved Adjusted EBITDA margin. The margin expansion should reflect higher revenue per ton, partially offset by an increase in cost per ton.
In Mexico, the company expects shipments to continue recovering in the third quarter of 2026, as the commercial market keeps its momentum. New pipeline projects and the substitution of Asian imported steel at several OEMs are starting to generate additional volumes, while public infrastructure works should provide further support beyond the quarter.
In Brazil, steel demand remains uneven, with resilience in the automotive industry and in infrastructure equipment offset by weaker demand from agricultural machinery. High imports of steel and of manufactured goods with steel content continue to weigh on the market. Trade defense is nevertheless gaining ground, as the steel quota system was renewed until June 2027 and a final decision on the antidumping case on hot rolled coils from China is expected in the coming months.
In Argentina, energy, mining and agriculture are expected to remain strong, with construction recovering gradually from still low levels. Manufacturing activity remains weaker, held back by soft domestic demand and strong competition from imports.
Analysis of Second Quarter of 2026 Results
Consolidated Net Sales
Adjusted EBITDA
Adjusted EBITDA in the second quarter of 2026 equals Net Income adjusted to exclude:
Depreciation and amortization;
Income tax results;
Net financial results;
Equity in earnings of non-consolidated companies;
Provision for ongoing litigation related to the acquisition of a participation in Usiminas; and
Reversal of contingencies (Usiminas).
And adjusted to include the proportional EBITDA in Unigal (70% participation).
Adjusted EBITDA margin equals Adjusted EBITDA divided by net sales.
For more information see Exhibit I - Alternative performance measures - "Adjusted EBITDA".
Steel Segment Second Quarter of 2026 Results
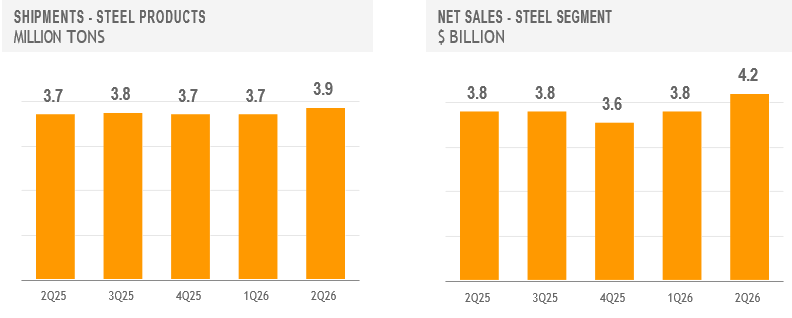
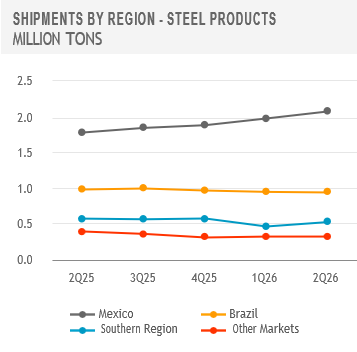
The Steel Segment's net sales increased both sequentially and year-over-year in the second quarter of 2026, driven by higher shipments and revenue per ton. Sequentially, shipment volumes increased in Mexico and the Southern Region, while realized steel prices rose mainly in Mexico and Brazil. Compared to the same period of 2025, the growth in sales volumes was driven by the strength of the Mexican market, which more than offset a decrease in shipments across all other markets. Meanwhile, realized steel prices increased year-over-year in Mexico, Brazil and Other Markets.
In Mexico, shipments to the commercial market continued to strengthen, posting significant year-over-year growth in the second quarter of 2026. Sales volumes to industrial customers were broadly stable sequentially, remaining below those in the same period of 2025.
In Brazil, sales volumes were largely unchanged sequentially, with Usiminas continuing to prioritize margin over volume. Flat steel imports declined in the second quarter, following the implementation of government measures aimed at curbing import surges and supporting more balanced competitive conditions.
In the Southern Region, steel shipments increased sequentially in the second quarter consistent with a seasonal rebound in activity, as underlying demand for steel products remained relatively stable.
In Other Markets, shipments in the second quarter of 2026 were broadly stable sequentially. On a year-over-year basis, sales volumes declined primarily due to decreased shipments in the US market.
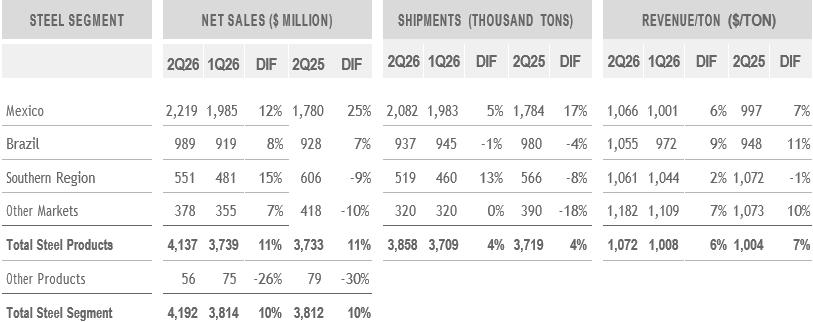
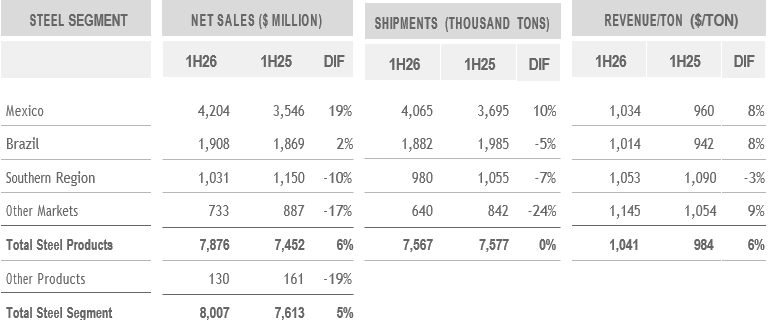
The Steel Segment's Cash Operating Income rose by $240 million sequentially in the second quarter of 2026, driven by higher realized steel prices and greater sales volumes, partially offset by slightly higher unit costs. Year-over-year, the Steel Segment's Cash Operating Income increased by $300 million in the quarter, on higher realized steel prices, increased sales volumes and lower unit costs. Cost per ton declined year-over-year mainly driven by lower raw material and purchased slab costs, aided by the company's ongoing initiatives to improve efficiency.
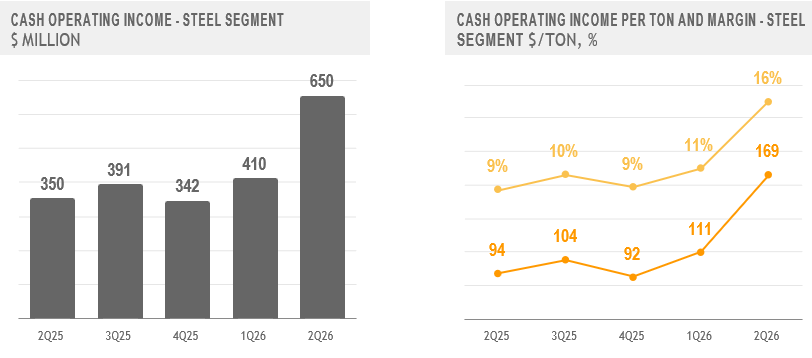
Note: For a reconciliation of the Steel Segment's Cash Operating Income and Cash Operating Income per Ton and Margin to the most directly comparable IFRS measures, see Exhibit I - Alternative performance measures - "Cash Operating Income - Steel Segment".
Mining Segment Second Quarter of 2026 Results
Net sales in the Mining Segment increased both sequentially and year-over-year in the second quarter of 2026. Sequential growth was primarily driven by the Brazilian operations' seasonal rebound, partially offset by lower realized iron ore prices. Compared with the same period in 2025, the rise in net sales in the second quarter of 2026 was mainly the result of higher realized iron ore prices.
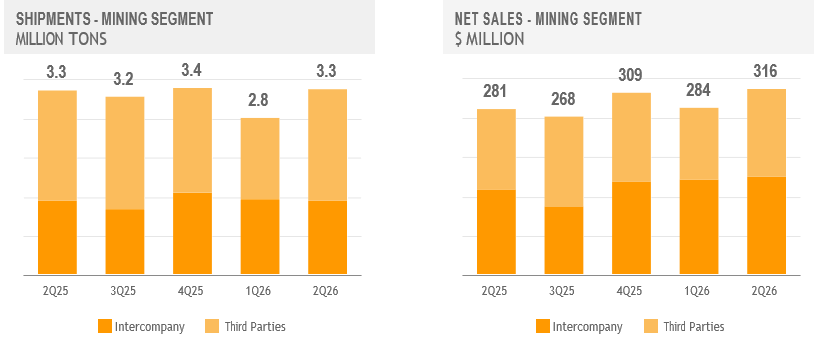
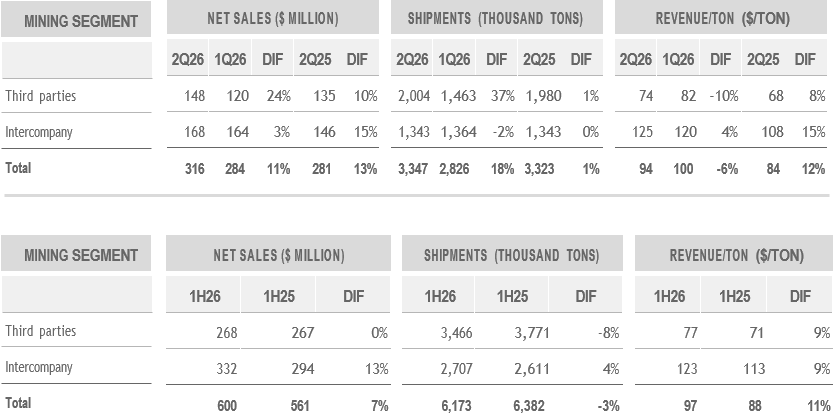
The Mining Segment's Cash Operating Income decreased slightly sequentially in the second quarter of 2026, primarily driven by lower realized iron ore prices partially offset by higher sales volumes. On a year-over-year basis, Cash Operating Income rose slightly supported by higher realized iron ore prices, largely offset by increased costs.
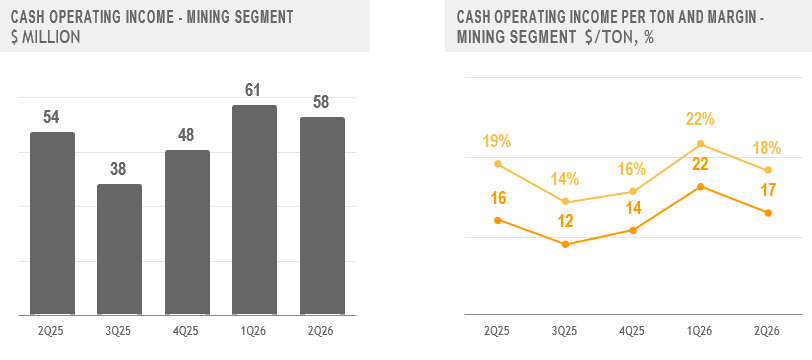
Note: For a reconciliation of the Mining Segment's Cash Operating Income and Cash Operating Income per Ton and Margin to the most directly comparable IFRS measures, see Exhibit I - Alternative performance measures - "Cash Operating Income - Mining Segment".
Net Financial Results
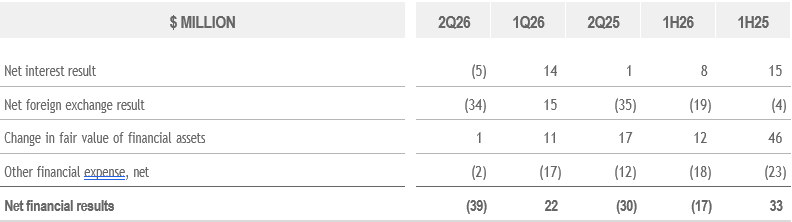
Net financial results were a loss of $39 million for the second quarter of 2026, primarily driven by a $34 million loss in foreign exchange results. This amount mainly reflected the negative effect of the appreciation of the Mexican Peso and the Brazilian Real against the US Dollar on net short local currency positions at Ternium's subsidiaries in these countries, and the negative effect of the depreciation of the Argentine Peso against the US Dollar on a net long local currency position at Ternium Argentina.
Income Tax Results
Ternium's subsidiaries use the U.S. dollar as their functional currency; as a result, fluctuations between their local currencies and the U.S. dollar lead to the recognition of deferred tax results. In the second quarter of 2026, the company recorded a deferred tax gain of $86 million mainly driven by the positive effect of the appreciation of the Mexican Peso against the US Dollar.

Net Income
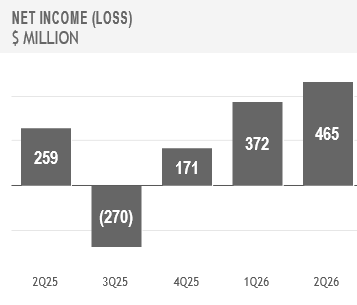
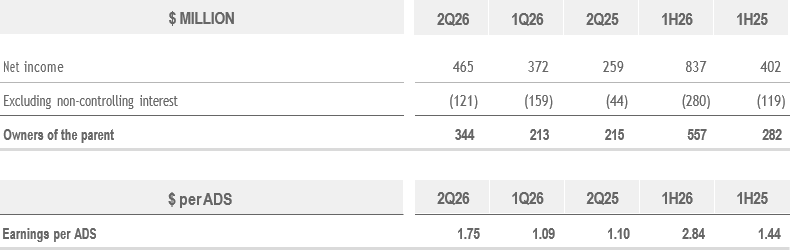
In the second quarter of 2026, Ternium's net income amounted to $465 million.
Equity Holder's Net Income was $344 million in the period, or $1.75 per ADS, mainly after accounting for the participation of a 62.5% non-controlling interest in Usiminas and a 37.4% non-controlling interest in Ternium Argentina.
Cash Flow and Liquidity
In the second quarter of 2026, cash from operations amounted to $256 million. Working capital increased by $418 million reflecting a $205 million increase in trade and other receivables and a $223 million increase in inventories, partially offset by a $10 million net increase in trade payables and other liabilities.
Capital expenditures totaled $431 million, primarily reflecting the progress made in the construction of the new steel shop at Ternium's industrial center in Pesquería, Mexico.
Alongside the development of its capital expenditure program, in the second quarter of 2026 Ternium paid a dividend to shareholders of $255 million, corresponding to the balance of the total dividend declared for the year 2025. In addition, the company paid dividends to non-controlling interest totalling $36 million.
Ternium recorded a Net Debt position of $112 million at the end of June 2026, compared to Net Cash position of $327 million as of the end of March 2026.
Conference Call and Webcast
Ternium will host a conference call on August 5, 2026, at 8:00am ET in which management will discuss second quarter of 2026 results. A webcast link will be available in the Investor Center section of the company's website at www.ternium.com.
Forward Looking Statements
Some of the statements contained in this press release are "forward-looking statements". Forward-looking statements are based on management's current views and assumptions and involve known and unknown risks that could cause actual results, performance or events to differ materially from those expressed or implied by those statements. These risks include but are not limited to risks arising from uncertainties as to gross domestic product, related market demand, global production capacity, tariffs, cyclicality in the industries that purchase steel products, and other factors beyond Ternium's control.
About Ternium
Ternium is a leading steel producer in the Americas, providing advanced steel products to a wide range of manufacturing industries and the construction sector. We invest in low carbon emissions steelmaking technologies to support the energy transition and the mobility of the future. We also support the development of our communities, especially through educational programs in Latin America. More information about Ternium is available at www.ternium.com.
Income Statement
$ MILLION |
| 2Q26 |
|
| 1Q26 |
|
| 2Q25 |
|
| 1H26 |
|
| 1H25 |
| |||||
Net sales |
|
| 4,340 |
|
|
| 3,934 |
|
|
| 3,947 |
|
|
| 8,274 |
|
|
| 7,880 |
|
Cost of sales |
|
| (3,399 | ) |
|
| (3,247 | ) |
|
| (3,337 | ) |
|
| (6,646 | ) |
|
| (6,739 | ) |
Gross profit |
|
| 941 |
|
|
| 687 |
|
|
| 610 |
|
|
| 1,628 |
|
|
| 1,141 |
|
Selling, general and administrative expenses |
|
| (428 | ) |
|
| (390 | ) |
|
| (403 | ) |
|
| (818 | ) |
|
| (799 | ) |
Other operating income (expense), net |
|
| 15 |
|
|
| (7 | ) |
|
| (8 | ) |
|
| 9 |
|
|
| (11 | ) |
Operating income |
|
| 528 |
|
|
| 290 |
|
|
| 199 |
|
|
| 818 |
|
|
| 331 |
|
Financial expense |
|
| (50 | ) |
|
| (50 | ) |
|
| (56 | ) |
|
| (101 | ) |
|
| (111 | ) |
Financial income |
|
| 45 |
|
|
| 64 |
|
|
| 57 |
|
|
| 109 |
|
|
| 126 |
|
Other financial (expense) income, net |
|
| (34 | ) |
|
| 9 |
|
|
| (31 | ) |
|
| (25 | ) |
|
| 18 |
|
Equity in earnings of non-consolidated companies |
|
| 22 |
|
|
| 14 |
|
|
| 25 |
|
|
| 37 |
|
|
| 41 |
|
Provision for ongoing litigation related to the acquisition of a participation in Usiminas |
|
| (24 | ) |
|
| (48 | ) |
|
| (40 | ) |
|
| (72 | ) |
|
| (85 | ) |
Profit before income tax result |
|
| 487 |
|
|
| 279 |
|
|
| 155 |
|
|
| 767 |
|
|
| 320 |
|
Income tax |
|
| (23 | ) |
|
| 93 |
|
|
| 104 |
|
|
| 70 |
|
|
| 82 |
|
Profit for the period |
|
| 465 |
|
|
| 372 |
|
|
| 259 |
|
|
| 837 |
|
|
| 402 |
|
Attributable to: |
|
|
|
|
|
|
|
|
|
|
|
|
|
|
|
|
|
|
|
|
Owners of the parent |
|
| 344 |
|
|
| 213 |
|
|
| 215 |
|
|
| 557 |
|
|
| 282 |
|
Non-controlling interest |
|
| 121 |
|
|
| 159 |
|
|
| 44 |
|
|
| 280 |
|
|
| 119 |
|
Profit for the period |
|
| 465 |
|
|
| 372 |
|
|
| 259 |
|
|
| 837 |
|
|
| 402 |
|
Statement of Financial Position
$ MILLION |
| JUNE 30, 2026 |
|
| DECEMBER 31, 2025 |
| ||
Property, plant and equipment, net |
|
| 10,973 |
|
|
| 10,406 |
|
Intangible assets, net |
|
| 1,037 |
|
|
| 1,002 |
|
Investments in non-consolidated companies |
|
| 614 |
|
|
| 563 |
|
Other investments |
|
| 0 |
|
|
| 0 |
|
Deferred tax assets |
|
| 1,283 |
|
|
| 1,039 |
|
Receivables, net |
|
| 764 |
|
|
| 804 |
|
Trade receivables, net |
|
| 5 |
|
|
| 4 |
|
Total non-current assets |
|
| 14,676 |
|
|
| 13,819 |
|
Receivables, net |
|
| 707 |
|
|
| 985 |
|
Derivative financial instruments |
|
| 26 |
|
|
| 43 |
|
Inventories, net |
|
| 4,395 |
|
|
| 4,094 |
|
Trade receivables, net |
|
| 2,007 |
|
|
| 1,536 |
|
Other investments |
|
| 1,301 |
|
|
| 1,600 |
|
Cash and cash equivalents |
|
| 1,431 |
|
|
| 1,531 |
|
Total current assets |
|
| 9,867 |
|
|
| 9,788 |
|
Non-current assets classified as held for sale |
|
| 9 |
|
|
| 8 |
|
Total assets |
|
| 24,552 |
|
|
| 23,615 |
|
Statement of Financial Position (cont.)
$ MILLION |
| JUNE 30, 2026 |
|
| DECEMBER 31, 2025 |
| ||
Capital and reserves attributable to the owners of the parent |
|
| 12,300 |
|
|
| 11,944 |
|
Non-controlling interest |
|
| 4,439 |
|
|
| 4,203 |
|
Total equity |
|
| 16,739 |
|
|
| 16,148 |
|
Provisions |
|
| 597 |
|
|
| 586 |
|
Deferred tax liabilities |
|
| 23 |
|
|
| 24 |
|
Non current tax liabilities |
|
| 5 |
|
|
| 13 |
|
Other liabilities |
|
| 998 |
|
|
| 956 |
|
Trade payables |
|
| 1 |
|
|
| 1 |
|
Lease liabilities |
|
| 160 |
|
|
| 138 |
|
Borrowings |
|
| 2,206 |
|
|
| 1,815 |
|
Total non-current liabilities |
|
| 3,989 |
|
|
| 3,533 |
|
Provision for ongoing litigation related to the acquisition of a participation in Usiminas |
|
| 599 |
|
|
| 528 |
|
Current income tax liabilities |
|
| 64 |
|
|
| 39 |
|
Other liabilities |
|
| 440 |
|
|
| 640 |
|
Trade payables |
|
| 2,036 |
|
|
| 2,073 |
|
Derivative financial instruments |
|
| - |
|
|
| 1 |
|
Lease liabilities |
|
| 47 |
|
|
| 49 |
|
Borrowings |
|
| 638 |
|
|
| 604 |
|
Total current liabilities |
|
| 3,823 |
|
|
| 3,934 |
|
Total liabilities |
|
| 7,813 |
|
|
| 7,467 |
|
Total equity and liabilities |
|
| 24,552 |
|
|
| 23,615 |
|
Statement of Cash Flows
$ MILLION |
| 2Q26 |
|
| 1Q26 |
|
| 2Q25 |
|
| 1H26 |
|
| 1H25 |
| |||||
Result for the period |
|
| 465 |
|
|
| 372 |
|
|
| 259 |
|
|
| 837 |
|
|
| 402 |
|
Adjustments for: |
|
|
|
|
|
|
|
|
|
|
|
|
|
|
|
|
|
|
|
|
Depreciation and amortization |
|
| 194 |
|
|
| 181 |
|
|
| 197 |
|
|
| 374 |
|
|
| 381 |
|
Income tax accruals less payments |
|
| 3 |
|
|
| (130 | ) |
|
| (202 | ) |
|
| (127 | ) |
|
| (252 | ) |
Equity in earnings of non-consolidated companies |
|
| (22 | ) |
|
| (14 | ) |
|
| (25 | ) |
|
| (37 | ) |
|
| (41 | ) |
Provision for ongoing litigation related to the acquisition of a participation in Usiminas |
|
| 24 |
|
|
| 48 |
|
|
| 40 |
|
|
| 72 |
|
|
| 85 |
|
Interest accruals less payments / receipts, net |
|
| (4 | ) |
|
| (7 | ) |
|
| (9 | ) |
|
| (10 | ) |
|
| - |
|
Changes in provisions |
|
| (10 | ) |
|
| 1 |
|
|
| 1 |
|
|
| (9 | ) |
|
| 4 |
|
Changes in working capital |
|
| (418 | ) |
|
| (233 | ) |
|
| 781 |
|
|
| (651 | ) |
|
| 727 |
|
Net foreign exchange results and others |
|
| 24 |
|
|
| - |
|
|
| - |
|
|
| 24 |
|
|
| (55 | ) |
Net cash provided by operating activities |
|
| 256 |
|
|
| 217 |
|
|
| 1,044 |
|
|
| 473 |
|
|
| 1,251 |
|
Capital expenditures and advances to suppliers for PP&E |
|
| (431 | ) |
|
| (406 | ) |
|
| (810 | ) |
|
| (837 | ) |
|
| (1,327 | ) |
Decrease in other investments |
|
| 288 |
|
|
| 88 |
|
|
| 319 |
|
|
| 376 |
|
|
| 562 |
|
Proceeds from the sale of property, plant & equipment |
|
| 0 |
|
|
| 1 |
|
|
| 0 |
|
|
| 1 |
|
|
| 1 |
|
Dividends received from non-consolidated companies |
|
| 1 |
|
|
| 1 |
|
|
| 1 |
|
|
| 2 |
|
|
| 2 |
|
Recovery of loans from non-consolidated companies |
|
| - |
|
|
| 150 |
|
|
| - |
|
|
| 150 |
|
|
| - |
|
Acquisition of additional participation in Usiminas |
|
| - |
|
|
| (315 | ) |
|
| - |
|
|
| (315 | ) |
|
| - |
|
Acquisition of business - purchase consideration |
|
| - |
|
|
| (24 | ) |
|
| - |
|
|
| (24 | ) |
|
| - |
|
Acquisition of business - cash acquired |
|
| - |
|
|
| 4 |
|
|
| - |
|
|
| 4 |
|
|
| - |
|
Repayment of additional paid in capital |
|
| - |
|
|
| - |
|
|
| (5 | ) |
|
| - |
|
|
| (5 | ) |
Net cash used in investing activities |
|
| (142 | ) |
|
| (502 | ) |
|
| (495 | ) |
|
| (644 | ) |
|
| (768 | ) |
Dividends paid in cash to company's shareholders |
|
| (255 | ) |
|
| - |
|
|
| (353 | ) |
|
| (255 | ) |
|
| (353 | ) |
Dividends paid in cash to non-controlling interest |
|
| (36 | ) |
|
| (6 | ) |
|
| (2 | ) |
|
| (43 | ) |
|
| (2 | ) |
Finance lease payments |
|
| (18 | ) |
|
| (14 | ) |
|
| (15 | ) |
|
| (32 | ) |
|
| (35 | ) |
Proceeds from borrowings |
|
| 29 |
|
|
| 406 |
|
|
| 9 |
|
|
| 435 |
|
|
| 582 |
|
Repayments of borrowings |
|
| (19 | ) |
|
| (39 | ) |
|
| (162 | ) |
|
| (58 | ) |
|
| (547 | ) |
Net cash (used in) provided by financing activities |
|
| (300 | ) |
|
| 346 |
|
|
| (523 | ) |
|
| 46 |
|
|
| (356 | ) |
(Decrease) increase in cash and cash equivalents |
|
| (186 | ) |
|
| 61 |
|
|
| 26 |
|
|
| (125 | ) |
|
| 127 |
|
Exhibit I - Alternative Performance Measures
These non-IFRS measures should not be considered in isolation of, or as a substitute for, measures of performance prepared in accordance with IFRS. These non-IFRS measures do not have a standardized meaning under IFRS and, therefore, may not correspond to similar non-IFRS financial measures reported by other companies.
Adjusted EBITDA
$ MILLION |
| 2Q26 |
|
| 1Q26 |
|
| 2Q25 |
|
| 1H26 |
|
| 1H25 |
| |||||
Net income |
|
| 465 |
|
|
| 372 |
|
|
| 259 |
|
|
| 837 |
|
|
| 402 |
|
Adjusted to exclude: |
|
|
|
|
|
|
|
|
|
|
|
|
|
|
|
|
|
|
|
|
Depreciation and amortization |
|
| 194 |
|
|
| 181 |
|
|
| 197 |
|
|
| 374 |
|
|
| 381 |
|
Income tax results |
|
| 23 |
|
|
| (93 | ) |
|
| (104 | ) |
|
| (70 | ) |
|
| (82 | ) |
Net financial results |
|
| 39 |
|
|
| (22 | ) |
|
| 30 |
|
|
| 17 |
|
|
| (33 | ) |
Equity in earnings of non-consolidated companies |
|
| (22 | ) |
|
| (14 | ) |
|
| (25 | ) |
|
| (37 | ) |
|
| (41 | ) |
Provision for ongoing litigation related to the acquisition of a participation in Usiminas |
|
| 24 |
|
|
| 48 |
|
|
| 40 |
|
|
| 72 |
|
|
| 85 |
|
Reversal of contingencies (Usiminas) |
|
| (12 | ) |
|
| - |
|
|
| - |
|
|
| (12 | ) |
|
| - |
|
Adjusted to include: |
|
|
|
|
|
|
|
|
|
|
|
|
|
|
|
|
|
|
|
|
Proportional EBITDA in Unigal (70%participation) |
|
| 7 |
|
|
| 8 |
|
|
| 7 |
|
|
| 15 |
|
|
| 13 |
|
Adjusted EBITDA |
|
| 717 |
|
|
| 479 |
|
|
| 403 |
|
|
| 1,195 |
|
|
| 725 |
|
Divided by: net sales |
|
| 4,340 |
|
|
| 3,934 |
|
|
| 3,947 |
|
|
| 8,274 |
|
|
| 7,880 |
|
Adjusted EBITDA Margin (%) |
|
| 17 | % |
|
| 12 | % |
|
| 10 | % |
|
| 14 | % |
|
| 9 | % |
Exhibit I - Alternative Performance Measures (cont.)
Cash Operating Income - Steel Segment
$ MILLION |
| 2Q26 |
|
| 1Q26 |
|
| 2Q25 |
|
| 1H26 |
|
| 1H25 |
| |||||
Operating Income - Management View (Note "Segment Information" to Ternium's Financial Statements as of the corresponding dates) |
|
| 410 |
|
|
| 272 |
|
|
| 190 |
|
|
| 682 |
|
|
| 433 |
|
Plus/minus differences in cost of sales (IFRS) |
|
| 88 |
|
|
| (18 | ) |
|
| 10 |
|
|
| 70 |
|
|
| (106 | ) |
Excluding depreciation and amortization |
|
| 158 |
|
|
| 148 |
|
|
| 144 |
|
|
| 306 |
|
|
| 286 |
|
Excluding reversal of contingencies (Usiminas) |
|
| (12 | ) |
|
| - |
|
|
| - |
|
|
| (12 | ) |
|
| - |
|
Including proportional EBITDA in Unigal (70% participation) |
|
| 7 |
|
|
| 8 |
|
|
| 7 |
|
|
| 15 |
|
|
| 13 |
|
Cash Operating Income |
|
| 650 |
|
|
| 410 |
|
|
| 350 |
|
|
| 1,060 |
|
|
| 626 |
|
Divided by: steel shipments (thousand tons) |
|
| 3,858 |
|
|
| 3,709 |
|
|
| 3,719 |
|
|
| 7,567 |
|
|
| 7,577 |
|
Cash Operating Income per Ton - Steel |
|
| 169 |
|
|
| 111 |
|
|
| 94 |
|
|
| 140 |
|
|
| 83 |
|
Divided by: steel net sales |
|
| 4,192 |
|
|
| 3,814 |
|
|
| 3,812 |
|
|
| 8,007 |
|
|
| 7,613 |
|
Cash Operating Income Margin - Steel (%) |
|
| 16 | % |
|
| 11 | % |
|
| 9 | % |
|
| 13 | % |
|
| 8 | % |
Cash Operating Income - Mining Segment
$ MILLION |
| 2Q26 |
|
| 1Q26 |
|
| 2Q25 |
|
| 1H26 |
|
| 1H25 |
| |||||
Operating Result - Management View (Note "Segment Information" to Ternium's Financial Statements as of the corresponding dates) |
|
| (33 | ) |
|
| (25 | ) |
|
| (38 | ) |
|
| (58 | ) |
|
| (40 | ) |
Plus/minus differences in cost of sales (IFRS) |
|
| 55 |
|
|
| 53 |
|
|
| 38 |
|
|
| 108 |
|
|
| 55 |
|
Excluding depreciation and amortization |
|
| 36 |
|
|
| 33 |
|
|
| 53 |
|
|
| 69 |
|
|
| 95 |
|
Cash Operating Income |
|
| 58 |
|
|
| 61 |
|
|
| 54 |
|
|
| 119 |
|
|
| 110 |
|
Divided by: mining shipments (thousand tons) |
|
| 3,347 |
|
|
| 2,826 |
|
|
| 3,323 |
|
|
| 6,173 |
|
|
| 6,382 |
|
Cash Operating Income per Ton - Mining |
|
| 17 |
|
|
| 22 |
|
|
| 16 |
|
|
| 19 |
|
|
| 17 |
|
Divided by: mining net sales |
|
| 316 |
|
|
| 284 |
|
|
| 281 |
|
|
| 600 |
|
|
| 561 |
|
Cash Operating Income Margin - Mining (%) |
|
| 18 | % |
|
| 22 | % |
|
| 19 | % |
|
| 20 | % |
|
| 20 | % |
Exhibit I - Alternative Performance Measures (cont.)
Free Cash Flow
$ MILLION |
| 2Q26 |
|
| 1Q26 |
|
| 2Q25 |
|
| 1H26 |
|
| 1H25 |
| |||||
Net cash provided by operating activities |
|
| 256 |
|
|
| 217 |
|
|
| 1,044 |
|
|
| 473 |
|
|
| 1,251 |
|
Less: capital expenditures and advances to suppliers for PP&E |
|
| (431 | ) |
|
| (406 | ) |
|
| (810 | ) |
|
| (837 | ) |
|
| (1,327 | ) |
Free Cash Flow |
|
| (175 | ) |
|
| (189 | ) |
|
| 234 |
|
|
| (364 | ) |
|
| (77 | ) |
Net Debt
$ BILLION |
| JUNE 30, 2026 |
|
| MARCH 31, 2026 |
|
| JUNE 30, 2025 |
| |||
Borrowings (current and non-current) |
|
| 2.8 |
|
|
| 2.8 |
|
|
| 2.4 |
|
Less: cash and cash equivalents |
|
| (1.4 | ) |
|
| (1.6 | ) |
|
| (1.9 | ) |
Less: other investments (current and non-current) |
|
| (1.3 | ) |
|
| (1.5 | ) |
|
| (1.5 | ) |
Net Debt (Cash) |
|
| 0.1 |
|
|
| (0.3 | ) |
|
| (1.0 | ) |
Note: Ternium Argentina's consolidated position of cash and cash equivalents and other investments amounted to $0.7 billion and $0.8 billion as of June 30 and March 31, 2026, and $1.0 billion as of June 30, 2025.
Contact:
Sebastián Martí
Ternium - Investor Relations
+1 (866) 890 0443
+54 (11) 4018 8389
www.ternium.com
SOURCE: Ternium S.A.
View the original press release on ACCESS Newswire:
https://www.accessnewswire.com/newsroom/en/metals-and-mining/ternium-announces-second-quarter-and-first-half-of-2026-results-1201349
