

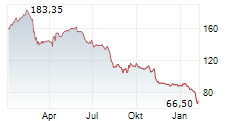
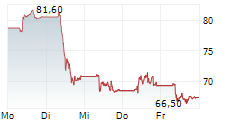
Wolters Kluwer 2026 Half-Year Report
Alphen aan den Rijn, August 5, 2026 - Wolters Kluwer, a global leader in professional information solutions, software and services, today releases its half-year 2026 results.
Highlights
- Group-level guidance for 2026 reiterated.
- Revenues €3,033 million, up 4% in constant currencies and up 5% organically.
- Excluding print (4% of total), organic growth was 6%.
- Recurring revenues (85% of total) grew 7% organically; non-recurring declined 3% organically.
- Recurring cloud software (24% of total) grew 14% organically.
- Adjusted operating profit €893 million, up 10% in constant currencies.
- Adjusted operating profit margin increased 100 basis points.
- Product development spend will be weighted toward the second half.
- Diluted adjusted EPS €2.83, up 14% in constant currencies.
- Adjusted free cash flow €533 million, up 14% in constant currencies.
- Net-debt-to-EBITDA of 2.0x.
- Interim dividend €1.01 per share, set at 40% of prior year total dividend.
- Share buyback: €244 million of 2026 program of up to €500 million repurchased to date.
Interim Report of the Executive Board
Stacey Caywood, CEO and Chair of the Executive Board, commented: "We have had a good start to the year, with 7% organic growth in recurring revenues, solid renewals across the group, and great progress in rolling out several advanced AI solutions. In Health, over 90% of our U.S. Enterprise customers have now adopted UpToDate Expert AI. And, internationally, we now have over 230 sites activated in 36 countries. Our recently launched advanced AI offerings for tax and legal professionals are seeing strong early adoption and are being valued for their trusted content, enterprise-grade security, and seamless integration into customer workflows. Recent acquisitions are performing ahead of plan and, together with deepening partnerships, are creating new opportunities for growth. I am pleased to reiterate our group-level guidance for the year and am excited about the opportunities ahead."
| Key Figures - Six months ended June 30 | |||||
| € million (unless otherwise stated) | 2026 | 2025 | ? | ? CC | ? OG |
| Business performance - benchmark figures | |||||
| Revenues | 3,033 | 3,052 | -1% | +4% | +5% |
| Adjusted operating profit | 893 | 865 | +3% | +10% | +9% |
| Adjusted operating profit margin | 29.4% | 28.4% | |||
| Adjusted net profit | 637 | 631 | +1% | +10% | |
| Diluted adjusted EPS (€) | 2.83 | 2.70 | +5% | +14% | |
| Adjusted free cash flow | 533 | 505 | +5% | +14% | |
| Net debt | 4,024 | 4,274 | -6% | ||
| ROIC | 18.2% | 18.5% | |||
| IFRS reported results | |||||
| Revenues | 3,033 | 3,052 | -1% | ||
| Operating profit | 820 | 765 | +7% | ||
| Profit for the period | 580 | 553 | +5% | ||
| Diluted EPS (€) | 2.57 | 2.36 | +9% | ||
| Net cash from operating activities | 694 | 670 | +4% | ||
| ?: % Change; - CC: % Change in constant currencies (€/$ 1.13); - OG: % Organic growth. Benchmark figures are performance measures used by management. ROIC is based on twelve-months rolling figures. See Note 4 for a reconciliation from IFRS to benchmark figures. | |||||
Full-Year 2026 Outlook
Our group-level guidance for full-year 2026 is provided in the table below and is unchanged. We continue to expect another year of good organic growth, a margin increase, and high single-digit growth in diluted adjusted EPS in constant currencies. As stated previously, we expect the full-year adjusted operating profit margin to increase while we simultaneously increase annual product development spending to 12%-13% of revenues in 2026 to further advance our AI strategy. Product development spending is expected to be weighted toward the second half of 2026.
| Full-Year 2026 Outlook | ||
| Performance indicators | 2026 Guidance | 2025 Actual |
| Adjusted operating profit margin* | Approximately 28.0% | 27.5% |
| Adjusted free cash flow** | €1,300-€1,350 million | €1,348 million |
| ROIC* | 18%-19% | 18.0% |
| Diluted adjusted EPS growth** | High single-digit growth | 9% |
| *Guidance for adjusted operating profit margin and ROIC is in reporting currency and assumes an average EUR/USD rate in 2026 of €/$1.15. **Guidance for adjusted free cash flow and diluted adjusted EPS is in constant currencies (€/$ 1.13). Guidance reflects share repurchases of €500 million in 2026. | ||
In 2025, Wolters Kluwer generated over 60% of its revenues and adjusted operating profit in North America. As a rule of thumb, based on our 2025 currency profile, each 1 U.S. cent move in the average €/$ exchange rate for the year causes an opposite change of approximately 4.5 euro cents in diluted adjusted EPS.
Restructuring costs are included in adjusted operating profit. We now expect restructuring costs to be approximately €20 million in 2026 (FY 2025: €37 million). We now expect adjusted net financing costs in constant currencies to increase to approximately €105 million in 2026 (FY 2025: €86 million). The benchmark tax rate on adjusted pre-tax profits is expected to be in the range of 23.5%-24.5% (FY 2025: 23.6%). Capital expenditures are expected to be in the range of 5.0%-6.0% of total revenues (FY 2025: 5.0%). We expect the full-year 2026 cash conversion ratio to be within 95%-100% (FY 2025: 103%), due to higher capital expenditures and lower working capital inflows.
Our guidance assumes no additional significant change to the scope of operations. We may make further acquisitions or disposals which can be dilutive to margins, earnings, and ROIC in the near term.
2026 outlook by division
Our divisional outlook is currently as follows:
Health: We expect full-year 2026 organic growth to be in line with prior year (FY 2025: 5%).
Tax & Accounting: We expect full-year 2026 organic growth to be in line with prior year (FY 2025: 7%), with revenue momentum picking up in the second half.
Financial & Corporate Compliance: We expect full-year 2026 organic growth to be ahead of prior year
(FY 2025: 3%), with some transactional variability possible given macroeconomic uncertainty.
Legal & Regulatory: We expect full-year 2026 organic growth to be ahead of prior year (FY 2025: 5%), with trend picking up in the second half.
Corporate Performance & ESG: We now expect full-year 2026 organic growth to be in line with prior year (FY 2025: 7%), given the impact of geopolitical and macroeconomic uncertainty on sales cycles.
Executing against our strategic priorities
Our objective is to create sustainable long-term value and to drive profitable revenue growth by providing trusted, AI-powered expert solutions and services that deliver increased productivity and improved outcomes for professionals. Our strategy is centered on driving organic growth through continuous investment in product innovation designed to create value for customers, increase our role in customer workflows, and extend into adjacencies.
In early 2026, we announced plans to increase our annual investment in product development to 12%-13% of revenues in 2026 and beyond, while simultaneously continuing our track record of driving adjusted operating profit margin increases. Our near-term priorities are to accelerate the pace of advanced AI innovation, to foster and scale partnerships, and to intensify our go-to-market capabilities. In the first half, we began executing against these near-term imperatives:
- Accelerate roll-out of AI-powered innovation: In Health, UpToDate Expert AI has now been adopted by over 90% of our U.S. Enterprise Edition customers, just nine months after commercial release. In Tax & Accounting, approaching 250 firms have already subscribed to our new CCH Axcess agentic AI modules, with substantial efficiencies to their workflows. In Legal & Regulatory, the Libra AI Workspace has been introduced into 10 countries and extends our leadership in European legal research platforms into the high-growth AI workspace adjacency.
- Foster and scale partnerships: In early June, we announced an expanded partnership with OpenAI to scale AI-native solutions across our business leveraging OpenAI's latest APIs and enterprise-grade platform capabilities. We are continuing to execute on partnerships with ambient clinical documentation providers, allowing us to position our trusted clinical content and AI capabilities directly into the clinician's workflow. In March, the integration of UpToDate clinical content with the Abridge AI scribe became generally available, and the integration with Dragon Copilot is on track to launch later this year.
- Intensify go-to-market capabilities: In the first half of 2026, we formed a global revenue operations organization, which will support the businesses with data-driven, scalable sales processes, and AI-powered capabilities to optimize value capture.
These priorities are central to achieving our 2025-2027 strategic goals:
- Scale expert solutions: We aim to grow our expert solutions and our advanced digital information solutions by driving penetration of cloud-based, modular platforms, powered by AI and integrated into customer data and ecosystems. We seek to enhance customer workflows through AI and by harnessing content and data.
- Accelerate growth: We are pursuing high-growth adjacencies with a build, buy, or partner approach. Our innovation focuses on advancing customer productivity and outcomes. We are actively fostering partnerships to be able to extend along the workflow and into higher growth adjacencies.
- Evolve capabilities: We are investing in sales operations to elevate our go-to-market capabilities and sales effectiveness. We are embracing AI and other technologies to drive operational performance. And we foster a great place to work and best-in-class sustainability performance.
Financial policy, capital allocation, net debt, and liquidity
We use our free cash flow to invest in the business organically and through acquisitions, to maintain optimal leverage, and to provide returns to shareholders. We regularly assess our financial position and evaluate the appropriate level of debt in view of our expectations for cash flow, investment plans, interest rates, and capital market conditions.
As we execute on our strategic priorities, we aim to maintain leverage in the range of 1.5x to 2.5x, providing a strong and secure financial foundation for our business. We may temporarily deviate from this range, but our high proportion of recurring revenues and resilient free cash flows would give us the ability to rapidly return to this range.
Dividend policy and interim dividend 2026
Wolters Kluwer remains committed to a progressive dividend policy, under which we aim to increase the dividend per share in euros each year, independent of currency fluctuations. The payout ratio1 can therefore vary from year to year. Proposed annual increases in the dividend per share consider our ?nancial performance, market conditions, and our need for ?nancial ?exibility. The policy takes into account the characteristics of our business, our expectations for future cash ?ows, and our plans for organic investment in innovation and productivity, or for acquisitions. We balance these factors with the objective of maintaining a strong balance sheet.
The interim dividend for 2026 has been set at €1.01 per share (40% of prior year total dividend). Shareholders can choose to reinvest both interim and ?nal dividends by purchasing additional Wolters Kluwer shares through the Dividend Reinvestment Plan (DRIP) administered by ABN AMRO Bank N.V.
Progress on 2026 share buyback
As a matter of policy since 2012, Wolters Kluwer will offset the dilution caused by our annual incentive share issuance with share repurchases (Anti-Dilution Policy). In addition, from time to time when appropriate, we return capital to shareholders through share buyback programs. Shares repurchased by the company are added to and held as treasury shares and are either cancelled or utilized to meet future obligations arising from share-based incentive plans.
On February 25, 2026, we announced our intention to repurchase shares for up to €500 million during 2026. In the year to date, up to and including August 4, 2026, we have repurchased €244 million in shares (3.6 million shares at an average price of €67.79).
For the period starting August 6, 2026, up to and including December 28, 2026, we have mandated a third party to execute a maximum of €256 million in share buybacks on our behalf, within the limits of relevant laws and regulations (in particular Regulation (EU) 596/2014) and the company's Articles of Association. The maximum number of shares which may be repurchased will not exceed the authorization granted by the Annual General Meeting of Shareholders.
Assuming global economic conditions do not deteriorate substantially, we believe this level of share buybacks leaves us with ample headroom to support our dividend plans, to sustain organic investment, and to make selective acquisitions. The share repurchase program may be suspended, discontinued, or modified at any time.
Share cancellation 2026
At the 2026 Annual General Meeting on May 21, 2026, shareholders approved a resolution to cancel for capital reduction purposes any or all ordinary shares held in treasury or to be acquired by the company, up to a maximum of 10% of issued share capital.
As of August 4, 2026, Wolters Kluwer held 9.8 million shares in treasury (equivalent to approximately 4.2% of issued share capital). As authorized by shareholders, the Executive Board has determined the number of ordinary shares to be cancelled this year is 7.8 million. Wolters Kluwer intends to cancel these shares in the second half of 2026. The remaining treasury shares will be retained to meet future obligations under share-based incentive plans.
Net debt, leverage, credit facility, and liquidity position
As of June 30, 2026, net debt was €4,024 million, unchanged from December 31, 2025, as free cash flow was fully deployed toward dividends, share buybacks, and the acquisition of StandardFusion.
The net-debt-to-EBITDA ratio based on twelve months' rolling EBITDA to June 30, 2026, was 2.0x (December 31, 2025: 2.0x).
Gross debt of €5,548 million includes the €500 million Eurobond (7-year term; 3.625% annual coupon) issued on June 22, 2026. Upon issuing this Eurobond, we announced the early redemption of the €500 million Eurobond due September 2026; repayment of this debt was completed on July 2, 2026.
As of June 30, 2026, our €600 million multi-currency revolving credit facility was fully undrawn. We recently exercised the final option to extend this credit facility by one year such that it will now mature in 2031.
As of June 30, 2026, net cash available was €1,211 million2.
Half-Year 2026 Results
Benchmark figures
Group revenues were €3,033 million, down 1% in reporting currency due to the depreciation of the U.S. dollar against the euro. Excluding the effect of exchange rate movements, revenues increased 4% in constant currencies. Organic revenue growth was 5%, in line with the comparable period (HY 2025: 5%). Print revenue decline reduced organic revenue growth by 100 basis points.
Revenues from North America accounted for 64% of total group revenues and grew 4% organically (HY 2025: 5%). Revenues from Europe, 29% of total revenues, grew 7% organically (HY 2025: 6%). Revenues from Asia Pacific and Rest of World, 7% of total revenues, grew 7% organically (HY 2025: 5%).
Adjusted operating profit was €893 million (HY 2025: €865 million), up 10% in constant currencies. The adjusted operating profit margin increased by 100 basis points to 29.4% (HY 2025: 28.4%), reflecting the divestment of FRR in Financial & Corporate Compliance and underlying margin improvements in Health and Corporate Performance & ESG.
Restructuring expenses, which are included in adjusted operating profit, were €9 million (HY 2025: €5 million). Investment in product development (including capitalized spend) amounted to 11% of revenues in the first half of 2026 (HY 2025: 11%). Product development spending is expected to be weighted toward the second half of 2026.
Adjusted net financing costs increased to €56 million (HY 2025: €38 million), due to a higher average effective cost of debt. Included in adjusted net financing costs was an €8 million net foreign exchange loss (HY 2025: €2 million net foreign exchange gain) mainly due to the translation of intercompany balances.
Adjusted profit before tax was €836 million (HY 2025: €828 million), up 9% in constant currencies. The benchmark effective tax rate on adjusted profit before tax was 23.8% (HY 2025: 23.8%).
Adjusted net profit was €637 million (HY 2025: €631 million), an increase of 10% in constant currencies.
Diluted adjusted EPS was €2.83 (HY 2025: €2.70), up 14% in constant currencies, reflecting the increase in adjusted net profit and a 3.7% reduction in the diluted weighted average number of shares outstanding to 225.3 million (HY 2025: 234.0 million).
IFRS reported figures
Reported operating profit increased 7% to €820 million (HY 2025: €765 million), reflecting a decrease in amortization of acquired intangible assets, lower acquisition-related costs, and a €7 million net gain on divestments. See Note 7 for further information on the net gain on divestments.
Reported financing results amounted to a net cost of €59 million (HY 2025: €39 million cost) due to a higher average effective cost of debt. The reported effective tax rate decreased to 23.7% (HY 2025: 23.9%), mainly due to a favorable movement in our deferred tax position.
As a result, net profit for the period increased 5% to €580 million (HY 2025: €553 million). Diluted EPS increased 9% to €2.57 (HY 2025: €2.36), due to the increase in net profit and the reduction in weighted average number of shares outstanding resulting from the ongoing share buyback program.
Cash flow
Adjusted operating cash flow was €812 million (HY 2025: €738 million), up 17% in constant currencies. The cash conversion ratio was 91% (HY 2025: 85%) and higher than expected, due to favorable movements in working capital expected to be reversed in coming quarters. Working capital outflows were €54 million
(HY 2025: €110 million outflow). Capital expenditures were €143 million (HY 2025: €147 million), reflecting the divestment of FRR and timing of development projects. Cash payments related to leases, including lease interest paid, amounted to €31 million (HY 2025: €33 million). Depreciation of physical assets, amortization and impairment of internally developed software, and depreciation of right-of-use assets totaled €147 million (HY 2025: €163 million).
Net interest paid, excluding lease interest paid, increased to €66 million (HY 2025: €53 million), reflecting higher cost of borrowing and the initial annual coupon payment on the €500 million Eurobond issued in March 2025. Income tax paid increased to €220 million (HY 2025: €192 million), reflecting higher profit before tax and current year payments on tax assessments related to prior years. Net cash outflows related to restructuring were €7 million (HY 2025: net outflow of €2 million). As a result, adjusted free cash flow was €533 million (HY 2025: €505 million), up 14% in constant currencies.
Total acquisition spending, net of cash acquired and including transaction costs, was €42 million (HY 2025: €833 million), primarily relating to the acquisition of StandardFusion on January 9, 2026. See Note 7 for more detail.
Dividends paid amounted to €303 million (HY 2025: €297 million), excluding dividend tax of €53 million
(HY 2025: €52 million) which was paid in July. Cash deployed towards share repurchases in the first six months amounted to €215 million (HY 2025: €509 million).
Divisional Review
Group organic revenue growth was 5%, with all divisions delivering good organic growth. The adjusted operating profit margin increased, mainly due to the divestment of FRR in Financial & Corporate Compliance and underlying margin improvements in Health and Corporate Performance & ESG.
| Divisional Summary - Six months ended June 30 | |||||||||||
| € million (unless otherwise stated) | 2026 | 2025 | ? | ? CC | ? OG | ||||||
| Revenues | |||||||||||
| Health | 774 | 788 | -2% | +5% | +5% | ||||||
| Tax & Accounting | 847 | 837 | +1% | +6% | +6% | ||||||
| Financial & Corporate Compliance | 569 | 635 | -10% | -4% | +4% | ||||||
| Legal & Regulatory | 523 | 487 | +7% | +10% | +5% | ||||||
| Corporate Performance & ESG | 320 | 305 | +5% | +8% | +7% | ||||||
| Total revenues | 3,033 | 3,052 | -1% | +4% | +5% | ||||||
| Adjusted operating profit | |||||||||||
| Health | 264 | 260 | +2% | +9% | +9% | ||||||
| Tax & Accounting | 308 | 308 | 0% | +6% | +6% | ||||||
| Financial & Corporate Compliance | 224 | 211 | +6% | +14% | +9% | ||||||
| Legal & Regulatory | 104 | 98 | +6% | +9% | +12% | ||||||
| Corporate Performance & ESG | 31 | 18 | +70% | +83% | +84% | ||||||
| Corporate | (38) | (30) | +29% | +31% | +31% | ||||||
| Total adjusted operating profit | 893 | 865 | +3% | +10% | +9% | ||||||
| Adjusted operating profit margin | |||||||||||
| Health | 34.1% 35.1% 37.2% 14.2% 4.6% 26.1% | 33.0% 35.1% 37.2% 14.2% 4.6% 26.1% | |||||||||
| Tax & Accounting | 36.3% | 36.8% | |||||||||
| Financial & Corporate Compliance | 39.3% | 33.3% | |||||||||
| Legal & Regulatory | 19.9% | 20.1% | |||||||||
| Corporate Performance & ESG | 9.7% | 6.0% | |||||||||
| Total adjusted operating profit margin | 29.4% | 28.4% | |||||||||
| ?: % Change; - CC: % Change in constant currencies (€/$ 1.13); - OG: % Organic growth. | |||||||||||
Total recurring revenues, which include subscriptions and other renewing revenue streams, accounted for 85% of total revenues (HY 2025: 84%) and grew 7% organically (HY 2025: 7%). Within recurring revenues, digital and service subscriptions grew 7% organically (HY 2025: 7%). Total non-recurring revenues declined 3% organically (HY 2025: 4% decline). Within non-recurring revenues, Financial & Corporate Compliance transactional revenues increased 2% organically (HY 2025: 1%) while Legal & Regulatory transactional revenues (ELM) increased 10% organically (HY 2025: 7%). Print book revenues declined 19% (HY 2025: 11% decline), partly due to publication schedules. Other non-recurring revenues, mainly on-premise software licenses and implementation fees, declined 6% organically (HY 2025: 9% decline).
| Revenues by Type - Six months ended June 30 | |||||||
| € million (unless otherwise stated) | 2026 | 2025 | ? | ? CC | ? OG | ||
| Digital and service subscription | 2,387 | 2,346 | +2% | +7% | +7% | ||
| Print subscription | 53 | 61 | -12% | -10% | -11% | ||
| Other recurring | 153 | 149 | +2% | +10% | +7% | ||
| Total recurring revenues | 2,593 | 2,556 | +1% | +6% | +7% | ||
| Transactional - Financial & Corporate Compliance | 169 | 176 | -4% | +3% | +2% | ||
| Transactional - Legal & Regulatory (ELM) | 53 | 51 | +3% | +10% | +10% | ||
| Print books | 38 | 49 | -21% | -17% | -19% | ||
| Other non-recurring | 180 | 220 | -18% | -15% | -6% | ||
| Total non-recurring revenues | 440 | 496 | -11% | -6% | -3% | ||
| Total revenues | 3,033 | 3,052 | -1% | +4% | +5% | ||
| ?: % Change; - CC: % Change in constant currencies (€/$ 1.13); - OG: % Organic growth. Other non-recurring revenues include software licenses, software implementation fees, professional services, and other non-subscription offerings. For divisional details, see Appendix 3. | |||||||
Health
- Organic growth 5%, led by Clinical Solutions.
- Learning, Research & Practice grew 4% organically.
- Margin mainly reflects operational gearing and ongoing mix shift.
| Health - Six months ended June 30 | ||||||
| € million (unless otherwise stated) | 2026 | 2025 | ? | ? CC | ? OG | |
| Revenues | 774 | 788 | -2% | +5% | +5% | |
| Adjusted operating profit | 264 | 260 | +2% | +9% | +9% | |
| Adjusted operating profit margin | 34.1% | 33.0% | ||||
| Operating profit | 251 | 242 | +4% | |||
| Net capital expenditure | 22 | 17 | ||||
| Ultimo FTEs | 3,476 | 3,536 | ||||
| ?: % Change; - CC: % Change in constant currencies (€/$ 1.13); - OG: % Organic growth. | ||||||
Health revenues increased 5% in constant currencies. Organic growth improved to 5% (HY 2025: 4%). Adjusted operating profit increased 9% in constant currencies and 9% on an organic basis. The margin increase reflects operational gearing, the ongoing mix shift towards clinical solutions, and ongoing efficiency programs. IFRS operating profit increased 4% overall, reflecting the increase in adjusted operating profit and a decrease in amortization of acquired identifiable intangible assets.
- Clinical Solutions (59% of divisional revenues) delivered 5% organic revenue growth (HY 2025: 6%), driven by good renewals for the UpToDate enterprise platform in the U.S. and internationally and new partnership revenues. As of July 31, more than 90% of our U.S. Enterprise Edition customers3 (representing approximately 2,500 hospitals) have signed up to adopt the Expert AI version, exceeding our mid-year goal of reaching 70%. International uptake of Expert AI includes over 230 sites activated across 36 countries. We continue to expand content and AI capabilities, most recently adding drug dosing after rigorous validation by clinical experts and pharmacists.
- Learning, Research & Practice (41% of divisional revenues) achieved 4% organic revenue growth (HY 2025: 1%). Excluding print, organic growth would have been 8% (HY 2025: 5%). In medical research, organic growth of 6% was partly driven by an open access journal publishing partnership with AME in China (which began in October 2025) and a relatively easy comparable (HY 2025: 1%). In learning and practice, digital learning solutions for nursing schools faced a tough comparable while print books continued to decline.
Tax & Accounting
- Organic growth 6%, driven by continued strong growth in cloud software revenues.
- Recurring revenues (93% of division) grew 7% organically.
- Margin reflects operational gearing offset by increased product investment.
| Tax & Accounting - Six months ended June 30 | ||||||
| € million (unless otherwise stated) | 2026 | 2025 | ? | ? CC | ? OG | |
| Revenues | 847 | 837 | +1% | +6% | +6% | |
| Adjusted operating profit | 308 | 308 | 0% | +6% | +6% | |
| Adjusted operating profit margin | 36.3% | 36.8% | ||||
| Operating profit | 292 | 294 | -1% | |||
| Net capital expenditure | 38 | 35 | ||||
| Ultimo FTEs | 6,883 | 6,928 | ||||
| ?: % Change; - CC: % Change in constant currencies (€/$ 1.13); - OG: % Organic growth. | ||||||
Tax & Accounting revenues increased 6% in constant currencies. Organic growth was 6%, in line with the comparable period (HY 2025: 6%). Adjusted operating profit increased 6% in constant currencies and 6% organically. The adjusted operating profit margin decreased slightly, with operational gearing largely offset by increased investment. IFRS operating profit decreased 1%, largely reflecting the development of adjusted operating profit.
- Tax & Accounting North America (58% of divisional revenues) delivered 5% organic growth (HY 2025: 6%), despite declines in outsourcing services (CCH Xpitax) and print books. Organic growth was driven by sustained 18% organic growth in our North American cloud software revenues as firms continue to migrate from on-premise software to our modular cloud platforms (CCH Axcess in the U.S. and CCH iFirm in Canada) and adopt additional workflow modules. As of mid-year, about 250 firms have subscribed to our new agentic AI modules (Intelligence, Client Collaboration, Scan, Workflow, and Advisor).
- Tax & Accounting Europe (39% of divisional revenues) recorded 8% organic growth (HY 2025: 7%), with strong performances across all regions. Revenue growth was driven by double-digit organic growth in our cloud and hybrid-cloud software, including e-invoicing solutions.
- Tax & Accounting Asia Pacific & Rest of World (3% of divisional revenues) revenues were broadly stable.
Financial & Corporate Compliance
- Organic growth 4%, supported by 6% growth in recurring revenues.
- Trends in transactional and other non-recurring revenues remained subdued.
- Margin increase mainly reflects the divestment of FRR.
| Financial & Corporate Compliance - Six months ended June 30 | |||||
| € million (unless otherwise stated) | 2026 | 2025 | ? | ? CC | ? OG |
| Revenues | 569 | 635 | -10% | -4% | +4% |
| Adjusted operating profit | 224 | 211 | +6% | +14% | +9% |
| Adjusted operating profit margin | 39.3% | 33.3% | |||
| Operating profit | 220 | 186 | +18% | ||
| Net capital expenditure | 18 | 34 | |||
| Ultimo FTEs | 3,152 | 4,099 | |||
| ?: % Change; - CC: % Change in constant currencies (€/$ 1.13); - OG: % Organic growth. | |||||
Financial & Corporate Compliance revenues declined 4% in constant currencies, due to the divestment of FRR in December 2025. Organic growth was 4%, in line with the comparable period (HY 2025: 4%). Recurring revenues (69% of division total revenues) grew 6% organically, while growth in non-recurring revenues remained subdued (HY 2025: 1% decline). Adjusted operating profit increased 14% in constant currencies and 9% on an organic basis. The increase in the adjusted operating profit margin reflects the divestment of FRR. IFRS operating profit increased 18%, including a gain from the final settlement on the disposal of FRR assets and lower amortization of acquired identifiable intangible assets.
- In Legal Services (62% of divisional revenues), organic growth was 5% (HY 2025: 6%), reflecting good growth in service subscriptions (despite lower BOI revenues following the suspended enforcement of the Corporate Transparency Act) and active upselling of business licensing and other services. In the mid-sized corporate segment, RASi delivered strong organic growth, ahead of our expectations. Amid lackluster macro-economic conditions and low M&A volumes, transactional revenues remained subdued.
- In Financial Services (38% of divisional revenues), organic growth was 3% (HY 2025: 1%), driven by good growth in recurring revenues from our U.S. lending compliance solutions (eOriginal). Transactional revenues declined 2% (HY 2025: 0%), reflecting subdued lending market activity.
Legal & Regulatory
- Organic growth 5%, led by digital revenues up 7%.
- Software businesses grew 7% organically.
- Margin eased slightly, reflecting acquisitions and investments.
| Legal & Regulatory - Six months ended June 30 | ||||||
| € million (unless otherwise stated) | 2026 | 2025 | ? | ? CC | ? OG | |
| Revenues | 523 | 487 | +7% | +10% | +5% | |
| Adjusted operating profit | 104 | 98 | +6% | +9% | +12% | |
| Adjusted operating profit margin | 19.9% | 20.1% | ||||
| Operating profit | 81 | 71 | +15% | |||
| Net capital expenditure | 29 | 25 | ||||
| Ultimo FTEs | 4,482 | 4,357 | ||||
| ?: % Change; - CC: % Change in constant currencies (€/$ 1.13); - OG: % Organic growth. | ||||||
Legal & Regulatory revenues increased 10% in constant currencies, including the effect of acquisitions of Inisoft (May 2, 2025), Brightflag (June 11, 2025), and Libra Technology (November 19, 2025). Organic revenue growth was 5% against a challenging comparable (HY 2025: 6%). Excluding print, organic growth was 8% (HY 2025: 6%). Adjusted operating profit increased 9% in constant currencies and 12% on an organic basis. The adjusted operating profit margin eased slightly, reflecting acquisitions and increased product development. IFRS operating profit increased 15%, benefitting from lower acquisition-related costs, partly offset by higher amortization of acquired identifiable intangible assets related to acquisitions completed in 2025.
- Legal & Regulatory Information Solutions (75% of divisional revenues) grew 5% organically (HY 2025: 6%), led by continued strong organic growth in digital revenues. Print revenues declined 13% organically against a tough comparable (HY 2025: 3% organic growth) related to German elections a year ago. Libra's AI Workspace solution, acquired in November 2025, has been rapidly integrated with our legal content in Europe, rolled out to ten countries and thousands of users.
- Legal & Regulatory Software (25% of divisional revenues) grew 7% organically (HY 2025: 5%). Enterprise Legal Management (ELM) Solutions (Tymetrix 360 and Passport) recorded mid-single digit organic growth driven by 10% organic growth in transactional revenues linked to legal spend volumes. Brightflag, which provides enterprise legal management software to mid-sized and large corporations, delivered strong double-digit growth. Legal practice management software solutions posted mid-single digit organic growth.
Corporate Performance & ESG
- Organic revenue growth 7%, driven by cloud software up 14%.
- Recurring revenues (78% of division) grew 10% organically, while non-recurring declined 1%.
- Margin reflects improved operational gearing and expense management.
| Corporate Performance & ESG - Six months ended June 30 | ||||||
| € million (unless otherwise stated) | 2026 | 2025 | ? | ? CC | ? OG | |
| Revenues | 320 | 305 | +5% | +8% | +7% | |
| Adjusted operating profit | 31 | 18 | +70% | +83% | +84% | |
| Adjusted operating profit margin | 9.7% | 6.0% | ||||
| Operating profit | 14 | 2 | n/m | |||
| Net capital expenditure | 36 | 36 | ||||
| Ultimo FTEs | 2,624 | 2,405 | ||||
| ?: % Change; - CC: % Change in constant currencies (€/$ 1.13); - OG: % Organic growth. | ||||||
Corporate Performance & ESG revenues increased 8% in constant currencies, including the acquisition of StandardFusion (January 9, 2026). Organic growth was 7%, in line with the comparable period (HY 2025: 7%). Recurring revenues grew 10% organically (HY 2025: 14%), while non-recurring revenues declined 1%
(HY 2025: 10% decline).
Adjusted operating profit increased 83% in constant currencies and 84% on an organic basis. The margin increase reflects improved operational gearing and expense management. IFRS operating profit was
€14 million, reflecting the increase in adjusted operating profit.
- In EHS & ESG4 (30% of divisional revenues), organic growth was 2% as growth in software revenues was largely offset by a decline in implementation projects amidst geopolitical uncertainty in Enablon's key markets. Cloud software revenues grew 10% organically (HY 2025: 18%). Non-recurring revenues (services and on-premise software licenses) decreased 13% organically (HY 2025: 0%).
- In Corporate Performance, Corporate Tax, and Audit & Assurance (70% of divisional revenues), organic growth was 10% (HY 2025: 5%). CCH Tagetik recorded 12% organic growth (HY 2025: 5%), as 19% organic growth in recurring cloud software was partly offset by declines in on-premise software licenses and implementation services. As of 2026, we only offer license maintenance outside the U.S. and Europe. Both Corporate Tax and Audit & Assurance recorded high single-digit organic growth, supported by new sales in their cloud software solutions. The integration of StandardFusion GRC5 tools with TeamMate is proceeding as planned.
On August 4, Corporate Performance & ESG acquired Marosa, a tax automation provider based in Europe, for €112 million (enterprise value) paid in cash. Marosa's VAT compliance and other solutions complement our existing U.S. corporate tax business (CCH SureTax) and will help accelerate the development of a broader global indirect tax platform. Marosa brings 112 FTEs, deep regulatory expertise, proven technology, and an extensive multinational customer base. In 2025, Marosa's gross revenues increased more than 25% to reach approximately €10 million (un-audited).
Corporate
Corporate expenses increased 31% in constant currencies, primarily driven by higher third-party expenses, project-related costs, and brand investments.
| Corporate - Six months ended June 30 | ||||||
| € million (unless otherwise stated) | 2026 | 2025 | ? | ? CC | ? OG | |
| Adjusted operating profit | (38) | (30) | +29% | +31% | +31% | |
| Operating profit | (38) | (30) | +29% | |||
| Net capital expenditure | 0 | 0 | ||||
| Ultimo FTEs | 154 | 142 | ||||
| ?: % Change; - CC: % Change in constant currencies (€/$ 1.13); - OG: % Organic growth. | ||||||
Risk Management
In our 2025 Annual Report, the company described certain risk categories that could have a material adverse effect on its operations and financial position. Those risk categories are deemed to be incorporated and repeated in this report by reference. In the company's view, the nature and potential impact of these risk categories on the business are not materially different for the second half of 2026.
Statement by the Executive Board
The Executive Board is responsible for the preparation of the 2026 Half-Year Report, which includes the Interim Report of the Executive Board and the condensed consolidated interim financial statements for the six months ended June 30, 2026. The condensed consolidated interim financial statements for the six months ended June 30, 2026, are prepared in accordance with International Financial Reporting Standards (IFRS) as adopted by the European Union. The responsibility of the Executive Board includes selecting and applying appropriate accounting policies and making accounting estimates that are reasonable in the circumstances.
The Interim Report of the Executive Board endeavors to present a fair review of the situation of the business at the balance sheet date and of the state of affairs in the half-year under review. Such an overview contains a selection of some of the main developments in the first six months of the financial year and can never be exhaustive. This Interim Report also contains the current expectations of the Executive Board for the second half of the financial year. With respect to these expectations, reference is made to the disclaimer about forward-looking statements on page 34 of this half-year report. As required by provision 5:25d (2)(c) of the Dutch Financial Markets Supervision Act (Wet op het financieel toezicht) and on the basis of the foregoing, the Executive Board confirms that to its knowledge:
- The condensed consolidated interim financial statements for the six months ended June 30, 2026, give a true and fair view of the assets, liabilities, financial position, and profit or loss of the company and the undertakings included in the consolidation taken as a whole; and
- The Interim Report of the Executive Board includes a fair overview of the situation at the balance sheet date, the course of affairs during the first six months of the financial year of the company, and the undertakings included in the consolidation taken as a whole, and the reasonably to be expected course of affairs for the second half of 2026 as well as an indication of important events that have occurred during the six months ended June 30, 2026, and their impact on the condensed consolidated interim financial statements, together with a description of the principal risks and uncertainties for the second half of 2026, and also includes the major related parties transactions entered into during the six months ended June 30, 2026.
Alphen aan den Rijn, August 4, 2026
Executive Board
S. Caywood, CEO and Chair of the Executive Board
K. B. Entricken, CFO and Member of the Executive Board
The content of this Half-Year Report has not been audited or reviewed by an independent external auditor.
CONDENSED CONSOLIDATED INTERIM FINANCIAL STATEMENTS
Unaudited condensed consolidated interim financial statements for the six months
ended June 30, 2026, and 2025
Unaudited condensed consolidated interim statement of profit or loss
Unaudited condensed consolidated interim statement of comprehensive income
Unaudited condensed consolidated interim statement of cash flows
Unaudited condensed consolidated interim statement of financial position
Unaudited condensed consolidated interim statement of the changes in total equity
Notes to the unaudited condensed consolidated interim financial statements
Unaudited condensed consolidated interim statement of profit or loss
| (in millions of euros, unless otherwise stated) | Note | Six months ended June 30 | |
| 2026 | 2025 | ||
| Revenues | 5 | 3,033 | 3,052 |
| Cost of revenues | (776) | (818) | |
| Gross profit | 2,257 | 2,234 | |
| Sales costs | (469) | (473) | |
| General and administrative costs | (971) | (977) | |
| Total operating expenses | (1,440) | (1,450) | |
| Other gains and (losses) | 3 | (19) | |
| Operating profit | 820 | 765 | |
| Financing results | (59) | (39) | |
| Share of profit of equity-accounted associates, net of tax | (1) | 1 | |
| Profit before tax | 760 | 727 | |
| Income tax expense | (180) | (174) | |
| Profit for the period | 580 | 553 | |
| Attributable to: | |||
| 580 | 553 | |
| 0 | 0 | |
| Profit for the period | 580 | 553 | |
| Earnings per share (EPS) (€) | |||
| Basic EPS | 2.58 | 2.37 | |
| Diluted EPS | 2.57 | 2.36 | |
Unaudited condensed consolidated interim statement of comprehensive income
(in millions of euros) | Six months ended June 30 | ||
| 2026 | 2025 | ||
| Comprehensive income: | |||
| Profit for the period | 580 | 553 | |
| Other comprehensive income: | |||
| Items that are or may be reclassified subsequently to the statement of profit or loss: | |||
| Exchange differences on translation of foreign operations | 140 | (394) | |
| Net gains/(losses) on hedges of net investments | (18) | 30 | |
| Net gains/(losses) on cash flow hedges | (6) | (2) | |
| Items that will not be reclassified to the statement of profit or loss: | |||
| Remeasurements on defined benefit plans | 0 | 8 | |
| Other comprehensive income/(loss) for the period, before tax | 116 | (358) | |
| Income tax on other comprehensive income | 0 | 2 | |
| Other comprehensive income/(loss) for the period, net of tax | 116 | (356) | |
| Total comprehensive income for the period | 696 | 197 | |
| Attributable to: | |||
| 696 | 197 | |
| 0 | 0 | |
| Total | 696 | 197 | |
Unaudited condensed consolidated interim statement of cash flows
| (in millions of euros) | Note | Six months ended June 30 | ||||
| 2026 | 2025 | |||||
| Cash flows from operating activities | ||||||
| Profit for the period | 580 | 553 | ||||
| Adjustments for: | ||||||
| Income tax expense | 180 | 174 | ||||
| Share of profit of equity-accounted associates, net of tax | 1 | (1) | ||||
| Financing results | 59 | 39 | ||||
| Amortization, impairment, and depreciation | 223 | 244 | ||||
| Book (profit)/loss on disposal of operations and non-current assets | (8) | 0 | ||||
| Fair value changes in contingent considerations | 1 | 0 | ||||
| Changes in employee benefit provisions | 0 | 3 | ||||
| Additions to and releases from provisions | 1 | 2 | ||||
| Appropriation of provisions | (8) | (3) | ||||
| Share-based payments | 15 | 15 | ||||
| Autonomous movements in working capital | (54) | (110) | ||||
| Other adjustments | (7) | 2 | ||||
| Total adjustments | 403 | 365 | ||||
| Interest paid and received (including the interest portion of lease payments) | (69) | (56) | ||||
| Paid income tax | (220) | (192) | ||||
| Net cash from operating activities | 694 | 670 | ||||
| Cash flows from investing activities | ||||||
| Net capital expenditure | (143) | (147) | ||||
| Acquisition spending, net of cash acquired | 7 | (33) | (822) | |||
| Receipts from divestments, net of cash disposed | 7 | 2 | 0 | |||
| Net cash used in investing activities | (174) | (969) | ||||
| Cash flows from financing activities | ||||||
| Repayment of loans | (155) | (352) | ||||
| Proceeds from new loans | 750 | 1,540 | ||||
| Repayment of principal portion of lease liabilities | (28) | (30) | ||||
| Collateral | (7) | 2 | ||||
| Repurchased shares | (215) | (509) | ||||
| Dividends paid | 9 | (303) | (297) | |||
| Net cash used in financing activities | 42 | 354 | ||||
| Net cash flow before effect of exchange differences | 562 | 55 | ||||
| Exchange differences on cash and cash equivalents and bank overdrafts | 33 | (65) | ||||
| Net change in cash and cash equivalents less bank overdrafts | 595 | (10) | ||||
| Cash and cash equivalents less bank overdrafts at January 1 | 891 | 945 | ||||
| Cash and cash equivalents less bank overdrafts at June 30 | 1,486 | 935 | ||||
| Add: Bank overdrafts used for cash management purposes at June 30 | 8 | 7 | ||||
| Cash and cash equivalents at June 30 in the statement of financial position | 1,494 | 942 | ||||
Unaudited condensed consolidated interim statement of financial position
| (in millions of euros) | Note | June 30, 2026 | December 31, 2025 | June 30, 2025 | ||||
| Goodwill | 4,933 | 4,787 | 4,882 | |||||
| Intangible assets other than goodwill | 1,818 | 1,825 | 1,884 | |||||
| Property, plant, and equipment | 69 | 68 | 70 | |||||
| Right-of-use assets | 184 | 196 | 186 | |||||
| Investments in equity-accounted associates | 14 | 14 | 12 | |||||
| Financial assets and other receivables | 18 | 11 | 12 | |||||
| Contract assets | 17 | 19 | 14 | |||||
| Deferred tax assets | 30 | 31 | 58 | |||||
| Total non-current assets | 7,083 | 6,951 | 7,118 | |||||
| Inventories | 63 | 62 | 70 | |||||
| Contract assets | 162 | 147 | 168 | |||||
| Trade and other receivables | 1,329 | 1,389 | 1,323 | |||||
| Current income tax assets | 122 | 103 | 111 | |||||
| Cash and cash equivalents | 1,494 | 932 | 942 | |||||
| Total current assets | 3,170 | 2,633 | 2,614 | |||||
| Total assets | 10,253 | 9,584 | 9,732 | |||||
| Issued share capital | 28 | 28 | 29 | |||||
| Share premium reserve | 87 | 87 | 87 | |||||
| Other reserves | 825 | 683 | 771 | |||||
| Equity attributable to the owners of the company | 940 | 798 | 887 | |||||
| Non-controlling interests | 0 | 0 | 0 | |||||
| Total equity | 940 | 798 | 887 | |||||
| Long-term debt, excl. lease liabilities | 8 | 4,036 | 4,033 | 4,478 | ||||
| Lease liabilities | 8 | 157 | 160 | 156 | ||||
| Deferred tax liabilities | 333 | 328 | 359 | |||||
| Employee benefits | 65 | 62 | 59 | |||||
| Provisions | 4 | 5 | 5 | |||||
| Non-current deferred income | 112 | 140 | 117 | |||||
| Total non-current liabilities | 4,707 | 4,728 | 5,174 | |||||
| Deferred income | 2,057 | 1,911 | 1,922 | |||||
| Other contract liabilities | 71 | 88 | 72 | |||||
| Trade and other payables | 1,009 | 1,118 | 922 | |||||
| Current income tax liabilities | 110 | 130 | 130 | |||||
| Short-term provisions | 28 | 33 | 25 | |||||
| Borrowings and bank overdrafts | 8 | 283 | 221 | 547 | ||||
| Short-term bonds | 8 | 1,000 | 500 | ? | ||||
| Short-term lease liabilities | 8 | 48 | 57 | 53 | ||||
| Total current liabilities | 4,606 | 4,058 | 3,671 | |||||
| Total liabilities | 9,313 | 8,786 | 8,845 | |||||
| Total equity and liabilities | 10,253 | 9,584 | 9,732 | |||||
Unaudited condensed consolidated interim statement of changes in total equity
| (in millions of euros) | 2026 | |||
| Equity attributable to the owners of the company | Non-controlling interests | Total equity | ||
| Balance at January 1, 2026 | 798 | 0 | 798 | |
| Total comprehensive income for the period | 696 | 0 | 696 | |
| Share-based payments | 15 | ? | 15 | |
| Final cash dividend 2025 | (356) | ? | (356) | |
| Repurchased shares | (213) | ? | (213) | |
| Balance at June 30, 2026 | 940 | 0 | 940 |
| (in millions of euros) | 2025 | |||
| Equity attributable to the owners of the company | Non-controlling interests | Total equity | ||
| Balance at January 1, 2025 | 1,545 | 0 | 1,545 | |
| Total comprehensive income for the period | 197 | 0 | 197 | |
| Share-based payments | 15 | ? | 15 | |
| Final cash dividend 2024 | (349) | ? | (349) | |
| Repurchased shares | (521) | ? | (521) | |
| Balance at June 30, 2025 | 887 | 0 | 887 |
Notes to the unaudited condensed consolidated interim financial statements
Note 1 Reporting entity
Wolters Kluwer N.V. (the company) with its subsidiaries (together referred to as 'the group', and individually as 'group entities') is a global provider of information, software solutions, and services for professionals in the health, tax and accounting, financial and corporate compliance, legal and regulatory, and corporate performance and ESG sectors. Our expert solutions combine deep domain knowledge with technology to deliver both content and workflow automation to drive improved outcomes and productivity for our customers.
These unaudited condensed consolidated interim financial statements (interim financial statements) for the six months ended June 30, 2026, comprise the group and the group's interests in associates.
Note 2 Basis of preparation
Statement of compliance
These interim financial statements have been prepared in accordance with International Accounting Standards (IAS) 34 Interim Financial Reporting, as adopted by the European Union. As such, the financial statements do not include all the information required for a complete set of IFRS financial statements, and should be read in conjunction with the 2025 consolidated financial statements included in the 2025 Annual Report. However, selected explanatory notes are included to explain events and transactions that are significant to get an understanding of the changes in the group's financial position and performance since the last annual consolidated financial statements for the year ended December 31, 2025.
These interim financial statements have not been audited or reviewed by the external auditor. The interim financial statements were authorized for issuance by the Executive Board and Supervisory Board on August 4, 2026.
Accounting policies
The accounting policies applied in these interim financial statements are the same as those applied in the 2025 Financial statements, apart from the effect of the following new accounting standards and amendments which became effective as of January 1, 2026:
- Classification and measurement of financial instruments (amendments to IFRS 9 and IFRS 7);
- Contracts referencing nature-dependent electricity (amendments to IFRS 9 and IFRS 7); and
- Annual improvements to IFRS Accounting Standards (volume 11).
These amendments did not have any impact on the amounts recognized in the current or prior periods and are not expected to significantly affect future periods.
Effect of forthcoming accounting standards
A number of new standards and amendments are not yet effective for annual reporting periods beginning on or after January 1, 2026, and have not been early adopted in these interim financial statements. With the exception of IFRS 18 - Presentation and Disclosures in Financial Statements (effective for financial years starting on or after January 1, 2027), the group expects no significant changes as a result of these new standards and amendments.
Functional and presentation currency
The interim financial statements are presented in euros, which is the company's functional and presentation currency. Unless otherwise indicated, the financial information in these interim financial statements is in euros and has been rounded to the nearest million.
| Exchange rates to the euro | 2026 | 2025 |
| U.S. dollar (at June 30) | 1.13 | 1.16 |
| U.S. dollar (average six months) | 1.17 | 1.09 |
| U.S. dollar (at December 31) | 1.18 |
Judgments and estimates
The preparation of the interim financial statements in conformity with IFRS requires management to make judgments, estimates, and assumptions that affect the application of policies and reported amounts of assets, liabilities, income, and expense.
In preparing these interim financial statements, the significant judgments made by management in applying the group's accounting policies and the key sources of estimation and uncertainty were the same as those applied to the 2025 Financial statements (reference is made to Note 3 - Accounting estimates and judgments of the 2025 Financial statements).
The estimates and underlying assumptions are based on historical experience and other factors that are believed to be reasonable under the circumstances, the results of which form the basis of making the judgments about carrying values of assets and liabilities that are not clear from other sources. Actual results may differ from those estimates and may result in material adjustments in the next financial period(s).
Reference is also made to Note 29 - Financial risk management of the 2025 Financial statements, which outlines Wolters Kluwer's exposure to a variety of risks, including market risk, currency risk, interest rate risk, liquidity risk, and credit risk. These risks have not substantially changed since the issuance of our 2025 Annual Report.
Note 3 Seasonality
The overall impact of seasonality on group revenues and costs is limited. Revenue recognition does not always follow the pattern of cash flows as the revenues for certain customer contracts are deferred.
Note 4 Benchmark figures
Wherever used in these interim financial statements, the term 'adjusted' refers to figures adjusted for non-benchmark items and, where applicable, amortization and impairment of goodwill and acquired identifiable intangible assets.
Adjusted figures are non-IFRS compliant financial figures, but are internally regarded as key performance indicators to measure the underlying performance of the business. These figures are presented as additional information and do not replace the information in the consolidated interim statement of profit or loss and in the consolidated interim statement of cash flows. The term 'adjusted' is not a defined term under IFRS.
Reconciliation of benchmark figures
Revenue Bridge
| (in millions of euros) | € | % |
| Revenues HY 2025 | 3,052 | |
| Organic change | 152 | 5 |
| Acquisitions | 37 | 1 |
| Divestments | (60) | (2) |
| Currency impact | (148) | (5) |
| Revenues HY 2026 | 3,033 | (1) |
U.S. dollar 2026: HY average €/$=1.17 versus 2025: HY average €/$=1.09.
Reconciliation between operating profit and adjusted operating profit
| (in millions of euros) | Six months ended June 30 | |
| 2026 | 2025 | |
| Operating profit | 820 | 765 |
| Amortization and impairment of acquired identifiable intangible assets | 76 | 81 |
| Non-benchmark items in operating profit | (3) | 19 |
| Adjusted operating profit (A) | 893 | 865 |
Reconciliation between financing results and adjusted net financing costs
| (in millions of euros) | Six months ended June 30 | |
| 2026 | 2025 | |
| Financing results | (59) | (39) |
| Non-benchmark items in financing results | 3 | 1 |
| Adjusted net financing costs | (56) | (38) |
Reconciliation between profit for the period and adjusted net profit
| (in millions of euros) | Six months ended June 30 | |
| 2026 | 2025 | |
| Profit for the period attributable to the owners of the company (B) | 580 | 553 |
| Amortization and impairment of acquired identifiable intangible assets and goodwill | 76 | 81 |
| Tax on amortization and impairment of acquired identifiable intangible assets and goodwill | (18) | (20) |
| Non-benchmark items, net of tax | (1) | 17 |
| Adjusted net profit (C) | 637 | 631 |
Summary of non-benchmark items
| (in millions of euros) | Six months ended June 30 | |
| 2026 | 2025 | |
| Included in other gains and (losses): | ||
| Divestment-related results | 7 | (1) |
| Acquisition-related costs | (3) | (17) |
| Additions to acquisition integration provisions | 0 | (1) |
| Fair value changes contingent considerations | (1) | 0 |
| Total non-benchmark income/(costs) in operating profit | 3 | (19) |
| Included in financing results: | ||
| Employee benefits financing component | (2) | (1) |
| Unwinding of discount of deferred and contingent considerations | (1) | ? |
| Total non-benchmark income/(costs) in financing results | (3) | (1) |
| Total non-benchmark items before tax | 0 | (20) |
| Tax on non-benchmark items | 1 | 3 |
| Non-benchmark items, net of tax | 1 | (17) |
Reconciliation between net cash from operating activities and adjusted free cash flow
| (in millions of euros) | Six months ended June 30 | |
| 2026 | 2025 | |
| Net cash from operating activities | 694 | 670 |
| Net capital expenditure | (143) | (147) |
| Repayment of principal portion of lease liabilities | (28) | (30) |
| Paid acquisition-related costs | 9 | 11 |
| Paid divestment expenses | 1 | 1 |
| Adjusted free cash flow (D) | 533 | 505 |
Return on invested capital (ROIC) calculation
| (in millions of euros, unless otherwise stated) | Six months ended June 30 | |
| 12 months rolling | 2026 | 2025 |
| Adjusted operating profit | 1,715 | 1,700 |
| Allocated tax | (404) | (394) |
| Net operating profit after allocated tax (NOPAT) | 1,311 | 1,306 |
| Average invested capital | 7,182 | 7,070 |
| ROIC-ratio (%) | 18.2 | 18.5 |
Per share information
| (in euros, unless otherwise stated) | Six months ended June 30 | |
| 2026 | 2025 | |
| Total number of ordinary shares outstanding at June 301) | 223.2 | 231.4 |
| Weighted average number of ordinary shares outstanding (E)1) | 224.6 | 233.2 |
| Diluted weighted average number of ordinary shares (F)1) | 225.3 | 234.0 |
| Adjusted EPS (C/E) | 2.84 | 2.71 |
| Diluted adjusted EPS (C/F) | 2.83 | 2.70 |
| Diluted adjusted EPS in constant currencies | 2.96 | 2.59 |
| Basic EPS (B/E) | 2.58 | 2.37 |
| Diluted EPS (B/F) | 2.57 | 2.36 |
| Adjusted free cash flow per share (D/E) | 2.37 | 2.17 |
| Diluted adjusted free cash flow per share (D/F) | 2.37 | 2.16 |
1) In millions of shares
Benchmark tax rate
| (in millions of euros, unless otherwise stated) | Six months ended June 30 | |
| 2026 | 2025 | |
| Income tax expense | 180 | 174 |
| Tax benefit on amortization and impairment of acquired identifiable intangible assets | 18 | 20 |
| Tax benefit/(expense) on non-benchmark items | 1 | 3 |
| Tax on adjusted profit before tax (G) | 199 | 197 |
| Adjusted net profit (C) | 637 | 631 |
| Adjustment for non-controlling interests | 0 | 0 |
| Adjusted profit before tax (H) | 836 | 828 |
| Benchmark tax rate (G/H) (%) | 23.8 | 23.8 |
Cash conversion ratio
| (in millions of euros, unless otherwise stated) | Six months ended June 30 | |
| 2026 | 2025 | |
| Operating profit | 820 | 765 |
| Amortization, impairment, and depreciation | 223 | 244 |
| EBITDA | 1,043 | 1,009 |
| Non-benchmark items in operating profit | (3) | 19 |
| Adjusted EBITDA | 1,040 | 1,028 |
| Autonomous movements in working capital | (54) | (110) |
| Net capital expenditure | (143) | (147) |
| Repayment of principal portion of lease liabilities | (28) | (30) |
| Interest portion of lease liabilities | (3) | (3) |
| Adjusted operating cash flow (I) | 812 | 738 |
| Adjusted operating profit (A) | 893 | 865 |
| Cash conversion ratio (I/A) (%) | 91 | 85 |
Note 5 Segment reporting
Divisional revenues and operating profit
| (in millions of euros) | Six months ended June 30 | |
| 2026 | 2025 | |
| Revenues | ||
| Health | 774 | 788 |
| Tax & Accounting | 847 | 837 |
| Financial & Corporate Compliance | 569 | 635 |
| Legal & Regulatory | 523 | 487 |
| Corporate Performance & ESG | 320 | 305 |
| Total revenues | 3,033 | 3,052 |
| Operating profit/(loss) | ||
| Health | 251 | 242 |
| Tax & Accounting | 292 | 294 |
| Financial & Corporate Compliance | 220 | 186 |
| Legal & Regulatory | 81 | 71 |
| Corporate Performance & ESG | 14 | 2 |
| Corporate | (38) | (30) |
| Total operating profit | 820 | 765 |
The group disaggregates revenues by media format and by revenue type as part of the management information discussed by the Executive Board. Reference is made to Appendix 2 and 3 of this report.
Note 6 Earnings per share
Earnings per share (EPS)
| (in millions of euros, unless otherwise stated) | Six months ended June 30 | |
| 2026 | 2025 | |
| Profit for the period attributable to the owners of the company (B) | 580 | 553 |
| Weighted average number of shares | ||
| in millions of shares | ||
| Outstanding ordinary shares at January 1 | 232.5 | 238.5 |
| Effect of repurchased shares | (7.9) | (5.3) |
| Weighted average number of ordinary shares for the period (E) | 224.6 | 233.2 |
| Basic EPS (€) (B/E) | 2.58 | 2.37 |
| Diluted weighted average number of shares | ||
| in millions of shares | ||
| Weighted average number of ordinary shares for the period (E) | 224.6 | 233.2 |
| Effect of Long-Term Incentive Plan | 0.7 | 0.8 |
| Diluted weighted average number of ordinary shares for the period (F) | 225.3 | 234.0 |
| Diluted EPS (€) (B/F) | 2.57 | 2.36 |
Note 7 Acquisitions and divestments
Acquisitions
Total acquisition spending in the first half of 2026, net of cash acquired, was €33 million (HY 2025:
€822 million).
On January 9, 2026, Wolters Kluwer Corporate Performance & ESG (CP&ESG) signed and completed the acquisition of 100% of the shares of StandardFusion, a global provider of cloud-based governance, risk, and compliance (GRC) solutions, based in Vancouver, Canada, with around 40 FTEs, for approximately €32 million in cash. StandardFusion will be integrated into CP&ESG's audit and assurance platform, TeamMate, creating a comprehensive offering that delivers a unified solution for audit and GRC. This strategic acquisition positions TeamMate to meet growing demand for integrated risk and control oversight. The StandardFusion platform is enterprise-ready, featuring granular workflows and a robust library of compliance frameworks that customers can leverage to ensure proper controls and compliance. Integration with TeamMate's cloud-based, AI-enabled platform will provide a single source of truth, align all three lines of defense, and enhance quality assurance, reporting, and compliance capabilities.
In addition, other smaller acquisitions were completed during the year, with a total consideration of
€1 million.
In the first half of 2026, acquisition-related costs were €3 million (HY 2025: €17 million).
Acquisition-related balances and cash-flows
| (in millions of euros) | Six months ended June 30 | |
| 2026 | 2025 | |
| Consideration payable in cash | 33 | 822 |
| Deferred and contingent acquisition payments | 0 | 13 |
| Total consideration | 33 | 835 |
| Non-current assets | 13 | 312 |
| Current assets | 0 | 79 |
| Non-current liabilities | 0 | (3) |
| Current liabilities | (4) | (33) |
| Deferred tax liabilities | (5) | (59) |
| Fair value of net identifiable assets/(liabilities) | 4 | 296 |
| Goodwill on acquisitions | 29 | 539 |
| Cash effect of the acquisitions: | ||
| Consideration payable in cash | 33 | 822 |
| Cash acquired | (1) | (2) |
| Deferred and contingent considerations paid | 1 | 2 |
| Acquisition spending, net of cash acquired | 33 | 822 |
The fair value of the identifiable assets and liabilities will be revised if new information, obtained within one year from the acquisition date, about facts and circumstances that existed at the acquisition date, causes adjustments to the above amounts, or for any additional provisions that existed at the acquisition date.
The goodwill relating to acquisitions represents future economic bene?ts speci?c to the group arising from assets that do not qualify for separate recognition as intangible assets. This includes expected new customers who generate revenue streams in the future, revenues generated because of new capabilities of the acquired product platforms, as well as expected synergies that will arise following the acquisitions.
Of the goodwill recognized in 2026, none was deductible for income tax purposes (HY 2025: none).
Divestments
In the first half of 2026, net divestment proceeds amounted to €14 million, for the most part relating to a final settlement pertaining to the divestment of the Financial, Risk and Regulatory Reporting (FRR) unit during 2025. In addition, a small divestment in Tax & Accounting was completed in the first half of 2026.
Divestment-related results
| (in millions of euros) | Six months ended June 30 | |
| 2026 | 2025 | |
| Consideration receivable in cash | 3 | ? |
| Deferred consideration receivable | 11 | ? |
| Total consideration | 14 | 0 |
| Non-current assets | 1 | ? |
| Current assets | 5 | ? |
| Current liabilities | (2) | ? |
| Fair value of net identifiable assets/(liabilities) | 4 | 0 |
| Reclassification of foreign exchange gain/(loss) on loss of control, recognized in other comprehensive income | (2) | ? |
| Book profit/(loss) on divestments of operations | 8 | 0 |
| Divestment expenses | (1) | (1) |
| Divestment-related results, included in other gains and (losses) | 7 | (1) |
| Cash-effect of divestments: | ||
| Consideration receivable in cash | 3 | ? |
| Deferred consideration received | 4 | ? |
| Cash included in divested operations | (5) | ? |
| Receipts from divestments, net of cash disposed | 2 | 0 |
Note 8 Net debt
Reconciliation gross debt to net debt
| (in millions of euros, unless otherwise stated) | June 30, 2026 | December 31, 2025 | June 30, 2025 | |||
| Gross debt | ||||||
| Bonds | 3,818 | 3,822 | 4,319 | |||
| Private placements | 108 | 108 | 118 | |||
| Other long-term loans | 16 | 16 | 17 | |||
| Deferred and contingent acquisition payments | 49 | 49 | 1 | |||
| Derivative financial instruments | 45 | 38 | 23 | |||
| Long-term debt (excl. lease liabilities) | 4,036 | 4,033 | 4,478 | |||
| Lease liabilities | 157 | 160 | 156 | |||
| Total long-term debt | 4,193 | 4,193 | 4,634 | |||
| Borrowings and bank overdrafts | 283 | 221 | 547 | |||
| Short-term bonds | 1,000 | 500 | ? | |||
| Short-term lease liabilities | 48 | 57 | 53 | |||
| Deferred and contingent acquisition payments | 2 | 1 | 12 | |||
| Derivative financial instruments | 22 | 0 | 1 | |||
| Total short-term debt | 1,355 | 779 | 613 | |||
| Total gross debt | 5,548 | 4,972 | 5,247 | |||
| Minus: | ||||||
| Cash and cash equivalents | (1,494) | (932) | (942) | |||
| Deferred divestment receivable | (11) | (4) | ? | |||
| Collateral | (19) | (12) | ? | |||
| Derivative financial instruments: | ||||||
| Current asset | ? | 0 | (31) | |||
| Net debt | 4,024 | 4,024 | 4,274 | |||
| Net-debt-to-EBITDA ratio (on a rolling basis)* | 2.0 | 2.0 | 2.1 | |||
* Net-debt-to-EBITDA ratio is based on a twelve-months rolling EBITDA.
On June 22, 2026, the group issued a new €500 million seven-year senior unsecured Eurobond. The bonds were sold at an issue price of 99.255 per cent and carry an annual coupon of 3.625 per cent. The securities were placed with a broad range of institutional investors across Europe. The notes are rated A- by S&P Global Ratings. The net proceeds of the offering will be used for general corporate purposes. The bonds are listed on the Official List of the Luxembourg Stock Exchange.
Note 9 Equity, LTIP, and dividends
The group made progress on the share buyback program of up to €500 million which was previously announced for 2026. In 2026, up to and including August 4, 2026, the group has completed repurchases of €244 million (3.6 million ordinary shares at an average share price of €67.79).
For the period starting August 6, 2026, up to and including December 28, 2026, the group has now engaged a third party to execute a maximum of €256 million in share buybacks on the group's behalf, within the limits of relevant laws and regulations (in particular Regulation (EU) 596/2014) and Wolters Kluwer's Articles of Association.
Shares repurchased are added to and held as treasury shares and will be used for capital reduction purposes and to meet obligations arising from share-based incentive plans. In 2026, the group used 0.1 million shares held in treasury for the vesting of the LTIP grant 2023-25, the third tranches of the Restricted Stock Units (RSU) 2023 plan, the second tranches of the Restricted Stock Units (RSU) 2024 plan, and the first tranches of the RSU 2025 plan.
In the first six months of 2026, treasury shares were used for the vesting of Long-Term Incentive Plan (LTIP) shares; no new shares were issued. The LTIP 2023-25 vested on December 31, 2025. Total Shareholder Return (TSR) ranked fifteenth relative to the peer group of 15 companies, resulting in a payout of 0% of the conditional base number of shares awarded to the Executive Board and senior management. The EPS- and ROIC-related shares resulted in a pay-out of 98% and 77%, respectively. A total of 120,629 shares were released on February 26, 2026.
Under the 2026-28 LTIP grant, 618,174 shares were conditionally awarded to the Executive Board and other senior managers in the first six months of 2026. In the first six months of 2026, a total of 53,696 shares were forfeited under the long-term incentive plans.
RSU shares are granted and vest over time (with 1 year, 2 years, and 3 years vesting periods), vesting is conditioned on continued employment. There are no performance conditions that need to be met for the RSU shares to vest. Under the 2026-2028 RSU grant, 78,454 shares were awarded to key employees (in 2025: 29,821). In the first six months of 2026, a total of 3,866 shares were forfeited under the RSU plans (2025: 2,265) and 28,598 shares were released (2025: 21,900).
A final dividend of €1.59 per share was approved at the Annual General Meeting of Shareholders in May 2026 and was paid in the second quarter. The final dividend brings the total dividend over the 2025 financial year to €2.52 per share, an increase of 8% compared to the 2024 dividend. The 2025 dividend of €2.52 per share amounting to €570 million (2024 dividend: €545 million) was fully distributed in cash. This 2025 dividend was paid in two parts, an interim dividend of €214 million in the second half of 2025 and a final dividend of
€356 million in the first half of 2026 (€303 million, before dividend withholding tax of €53 million paid in July 2026).
For 2026, the interim dividend was set at 40% of the prior year's total dividend, equivalent to €1.01 per share. The interim dividend will be paid in September.
At June 30, 2026, the Executive Board jointly held 82,563 shares (December 31, 2025: 535,921 shares, including 460,412 shares held by former CEO Ms. McKinstry), which included 21,137 shares that were held by Ms. Caywood (December 31, 2025: 18,775 shares) and 61,426 shares held by Mr. Entricken (December 31, 2025: 56,734 shares).
At June 30, 2026, Mrs. A.E. Ziegler held 4,358 Wolters Kluwer ADRs (December 31, 2025: 3,073 ADRs), Mr. C.F.H.H. Vogelzang held 779 shares (December 31, 2025: none), Mr. M.J. de Vries held 1,000 shares (December 31, 2025: none), and Mr. D.W. Sides held 1,875 shares (December 31, 2025: 1,875). None of the other members of the Supervisory Board held shares in Wolters Kluwer (December 31, 2025: 7,948 ordinary shares or ADRS were owned by members of the Supervisory Board, including Mr. De Kreij).
Note 11 Related party transactions
There were no major related party transactions entered into during the six months period ended June 30, 2026.
Note 12 Events after balance sheet date
On August 4, Corporate Performance & ESG acquired 100% of the shares of Marosa, a tax automation provider based in Europe, for €112 million (enterprise value) paid in cash. Marosa's VAT compliance and other solutions complement our existing U.S. corporate tax business (CCH SureTax) and will help accelerate the development of a broader global indirect tax platform. Marosa brings deep regulatory expertise, proven technology, and an extensive multinational customer base. Gross revenues (un-audited) were approximately €10 million in 2025. The acquisition is expected to achieve a return on invested capital above our weighted average cost of capital (WACC) within 3 to 5 years. The impact on Wolters Kluwer adjusted net profit is immaterial.
Appendix 1 Divisional supplemental information - Six months ended June 30
| (€ million, unless otherwise stated) | Change: | |||||||||
| 2026 | 2025 | Organic | Acquisition/ Divestment | Currency | ||||||
| Health | ||||||||||
| Revenues | 774 | 788 | 37 | 1 | (52) | |||||
| Adjusted operating profit | 264 | 260 | 21 | 0 | (17) | |||||
| Adjusted operating profit margin | 34.1% | 33.0% | ||||||||
| Tax & Accounting | ||||||||||
| Revenues | 847 | 837 | 46 | 0 | (36) | |||||
| Adjusted operating profit | 308 | 308 | 17 | 0 | (17) | |||||
| Adjusted operating profit margin | 36.3% | 36.8% | ||||||||
| Financial & Corporate Compliance | ||||||||||
| Revenues | 569 | 635 | 22 | (49) | (39) | |||||
| Adjusted operating profit | 224 | 211 | 19 | 9 | (15) | |||||
| Adjusted operating profit margin | 39.3% | 33.3% | ||||||||
| Legal & Regulatory | ||||||||||
| Revenues | 523 | 487 | 24 | 23 | (11) | |||||
| Adjusted operating profit | 104 | 98 | 12 | (3) | (3) | |||||
| Adjusted operating profit margin | 19.9% | 20.1% | ||||||||
| Corporate Performance & ESG | ||||||||||
| Revenues | 320 | 305 | 23 | 2 | (10) | |||||
| Adjusted operating profit | 31 | 18 | 15 | 0 | (2) | |||||
| Adjusted operating profit margin | 9.7% | 6.0% | ||||||||
| Corporate | ||||||||||
| Adjusted operating profit | (38) | (30) | (9) | ? | 1 | |||||
| Total Wolters Kluwer | ||||||||||
| Revenues | 3,033 | 3,052 | 152 | (23) | (148) | |||||
| Adjusted operating profit | 893 | 865 | 75 | 6 | (53) | |||||
| Adjusted operating profit margin | 29.4% | 28.4% | ||||||||
| Note: Acquisition/divestment column includes the contribution from 2026 and 2025 acquisitions before these became organic (12 months from their acquisition date), the impact of 2026 and 2025 divestments, and the effect of asset transfers between divisions, if any. | ||||||||||
Appendix 2 Revenues by media format - Six months ended June 30
| (€ million, unless otherwise stated) | 2026 | 2025 | ? | ? CC | ? OG | |
| Software | 1,438 | 1,413 | +2% | +6% | +8% | |
| Digital information | 1,177 | 1,195 | -1% | +4% | +5% | |
| Total digital | 2,615 | 2,608 | 0% | +5% | +6% | |
| Services | 303 | 305 | 0% | +7% | +5% | |
| 115 | 139 | -18% | -14% | -15% | ||
| Total revenues | 3,033 | 3,052 | -1% | +4% | +5% | |
| ?: % Change; - CC: % Change in constant currencies (€/$ 1.13); - OG: % Organic growth. Digital information includes digital information solutions and software-related services. Services include legal representation, consulting, training, events, and other services. | ||||||
Appendix 3 Divisional revenues by type - Six months ended June 30
| (€ million, unless otherwise stated) | 2026 | 2025 | ? | ? CC | ? OG | |
| Health | ||||||
| Digital and service subscription | 649 | 653 | -1% | +6% | +6% | |
| Print subscription | 15 | 18 | -15% | -9% | -9% | |
| Other recurring | 66 | 65 | +1% | +9% | +9% | |
| Total recurring revenues | 730 | 736 | -1% | +6% | +6% | |
| Print books | 15 | 19 | -22% | -17% | -17% | |
| Other non-recurring | 29 | 33 | -13% | -6% | -6% | |
| Total Health | 774 | 788 | -2% | +5% | +5% | |
| Tax & Accounting | ||||||
| Digital and service subscription | 712 | 682 | +4% | +8% | +8% | |
| Print subscription | 6 | 7 | -7% | -7% | -7% | |
| Other recurring | 74 | 79 | -6% | +1% | +1% | |
| Total recurring revenues | 792 | 768 | +3% | +7% | +7% | |
| Print books | 6 | 12 | -47% | -43% | -43% | |
| Other non-recurring | 49 | 57 | -14% | -10% | -9% | |
| Total Tax & Accounting | 847 | 837 | +1% | +6% | +6% | |
| Financial & Corporate Compliance | ||||||
| Digital and service subscription | 392 | 430 | -9% | -3% | +6% | |
| Total recurring revenues | 392 | 430 | -9% | -3% | +6% | |
| Legal Services (LS) transactional | 114 | 112 | +2% | +9% | +4% | |
| Financial Services (FS) transactional | 55 | 64 | -14% | -8% | -2% | |
| Other non-recurring | 8 | 29 | -71% | -70% | -18% | |
| Total Financial & Corporate Compliance | 569 | 635 | -10% | -4% | +4% | |
| Legal & Regulatory | ||||||
| Digital and service subscription | 386 | 351 | +10% | +12% | +6% | |
| Print subscription | 32 | 36 | -11% | -11% | -12% | |
| Other recurring | 10 | 5 | +83% | +92% | +92% | |
| Total recurring revenues | 428 | 392 | +9% | +11% | +6% | |
| Print books | 17 | 18 | -3% | -2% | -6% | |
| ELM transactional | 53 | 51 | +3% | +10% | +10% | |
| Other non-recurring | 25 | 26 | -4% | -3% | -7% | |
| Total Legal & Regulatory | 523 | 487 | +7% | +10% | +5% | |
| Corporate Performance & ESG | ||||||
| Digital and service subscription | 248 | 230 | +8% | +12% | +10% | |
| Other recurring | 3 | 0 | nm | nm | -4% | |
| Total recurring revenues | 251 | 230 | +9% | +13% | +10% | |
| Other non-recurring | 69 | 75 | -8% | -6% | -1% | |
| Total Corporate Performance & ESG | 320 | 305 | +5% | +8% | +7% | |
| Total Wolters Kluwer | ||||||
| Digital and service subscription | 2,387 | 2,346 | +2% | +7% | +7% | |
| Print subscription | 53 | 61 | -12% | -10% | -11% | |
| Other recurring | 153 | 149 | +2% | +10% | +7% | |
| Total recurring revenues | 2,593 | 2,556 | +1% | +6% | +7% | |
| Print books | 38 | 49 | -21% | -17% | -19% | |
| Transactional | 222 | 227 | -3% | +4% | +4% | |
| Other non-recurring | 180 | 220 | -18% | -15% | -6% | |
| Total non-recurring revenues | 440 | 496 | -11% | -6% | -3% | |
| Total Wolters Kluwer | 3,033 | 3,052 | -1% | +4% | +5% | |
| ?: % Change; - CC: % Change in constant currencies (€/$ 1.13); - OG: % Organic growth. Other non-recurring revenues include software license & implementation fees. | ||||||
About Wolters Kluwer
Wolters Kluwer (EURONEXT: WKL) is a global leader in information solutions, software and services for professionals in healthcare; tax and accounting; financial and corporate compliance; legal and regulatory; corporate performance and ESG. We help our customers make critical decisions every day by providing expert solutions that combine deep domain knowledge with technology and services.
Wolters Kluwer reported 2025 annual revenues of €6.1 billion. The group serves customers in over 180 countries, maintains operations in over 40 countries, and employs approximately 21,000 people worldwide. The company is headquartered in Alphen aan den Rijn, the Netherlands.
Wolters Kluwer shares are listed on Euronext Amsterdam (WKL) and are included in the AEX, Euro Stoxx 50, and Euronext 100 indices. Wolters Kluwer has a sponsored Level 1 American Depositary Receipt (ADR) program. The ADRs are traded on the over-the-counter market in the U.S. (WTKWY).
For more information, visit www.wolterskluwer.com, follow us on LinkedIn, Facebook, YouTube and Instagram
| Financial Calendar | |
| September 1, 2026 | Ex-dividend date: 2026 interim dividend ordinary shares |
| September 2, 2026 | Record date: 2026 interim dividend |
| September 24, 2026 | Payment date: 2026 interim dividend |
| October 1, 2026 | Payment date: 2026 interim dividend ADRs |
| November 4, 2026 | Nine-Month 2026 Trading Update |
| February 24, 2027 | Full-Year 2026 Results |
| March 10, 2027 | Publication of 2026 Annual Report |
| Media | Investors/Analysts |
| Stefan Kloet | Meg Geldens |
| Global Communications | Investor Relations |
| m +31 (0)612 223 657 | t + 31 (0)172 641 407 |
| press@wolterskluwer.com | ir@wolterskluwer.com |
Forward-looking Statements and Other Important Legal Information
This report contains forward-looking statements. These statements may be identified by words such as "expect", "should", "could", "shall" and similar expressions. Wolters Kluwer cautions that such forward-looking statements are qualified by certain risks and uncertainties that could cause actual results and events to differ materially from what is contemplated by the forward-looking statements. Factors which could cause actual results to differ from these forward-looking statements may include, without limitation, general economic conditions; conditions in the markets in which Wolters Kluwer is engaged; conditions created by global pandemics, such as COVID-19; behavior of customers, suppliers, and competitors; technological developments; the implementation and execution of new ICT systems or outsourcing; and legal, tax, and regulatory rules affecting Wolters Kluwer's businesses, as well as risks related to mergers, acquisitions, and divestments. In addition, financial risks such as currency movements, interest rate fluctuations, liquidity, and credit risks could influence future results. The foregoing list of factors should not be construed as exhaustive. Wolters Kluwer disclaims any intention or obligation to publicly update or revise any forward-looking statements, whether as a result of new information, future events or otherwise.
Elements of this press release contain or may contain inside information about Wolters Kluwer within the meaning of Article 7(1) of the Market Abuse Regulation (596/2014/EU). Trademarks referenced are owned by Wolters Kluwer N.V. and its subsidiaries and may be registered in various countries.
Notice regarding bearer share certificates
Owners of physical bearer share certificates in Wolters Kluwer N.V. (or its predecessors) are currently still entitled to surrender these bearer certificates and to receive a corresponding number of ordinary shares in Wolters Kluwer N.V. The opportunity to exchange the bearer certificates is open until October 31, 2026, at the latest. For more information, please email ir@wolterskluwer.com.
1 Dividend payout ratio: dividend per share divided by adjusted earnings per share.
2 Total cash and cash equivalents of €1,494 million, less European Commercial Paper of €275 million, and overdrafts used for cash management purposes of €8 million.
3 Customers with Enterprise Edition contracts.
4 EHS = environmental, health, and safety. ESG = environmental, social, and governance (Enablon suite).
5 GRC = governance, risk, and compliance.
Attachment
- 2026.08.05 Wolters Kluwer 2026 Half-Year Results

