
- Q2 2026 product revenue of €315 million (+105% Y/Y), comprising €252 million for YORVIPATH- , €55 million for SKYTROFA- , and €8 million for YUVIWEL-
- Through July 31, more than 220 unique YUVIWEL patient enrollments in the U.S.
- Substantial pipeline updates: presented long-term Phase 2 & 3 YORVIPATH data, shared Week 78 COACH Trial data, and completed target enrollment for pivotal infant reACHin Trial
- Settled all convertible notes and Ascendis added to multiple Russell U.S. Indexes
- Conference call today at 8:00 am ET
COPENHAGEN, Denmark, Aug. 13, 2026 (GLOBE NEWSWIRE) -- Ascendis Pharma A/S (Nasdaq: ASND) today announced financial results for the second quarter ended June 30, 2026, and provided a business update.
"Our patient focus has driven achievement of important milestones and strong demand for our TransCon products as Ascendis continues to transform into a leading biopharma company," said Jan Mikkelsen, President and Chief Executive Officer of Ascendis Pharma. "This focus on addressing unmet medical needs continues to drive a growing pipeline of innovative TransCon programs, further positioning Ascendis for durable, long-term growth in rare endocrine diseases and new therapeutic areas."
Select Highlights & Anticipated 2026 Milestones
- YORVIPATH
(palopegteriparatide, developed as TransCon PTH)
-
- YORVIPATH revenue for the second quarter of 2026 totaled €252 million, reflecting consistent new patient demand in the U.S.
- Outside of the U.S., consistent new patient demand and continued expansion of global commercial launches with full reimbursement. Now available commercially or through named patient programs in more than 35 countries.
- Presented 5-year Phase 2 PaTH Forward data at ECE 2026 and 3.5-year Phase 3 PaTHway data at ENDO 2026 showing that long-term treatment with TransCon PTH demonstrated sustained efficacy and safety in adults with hypoparathyroidism.
- Ongoing label expansion trials through PaTHway60 and PaTHway Adolescent.
- SKYTROFA
(lonapegsomatropin, developed as TransCon hGH)
-
- SKYTROFA revenue for the second quarter of 2026 totaled €55 million.
- More than 20,000 unique enrollments globally since launch.
- Ongoing Phase 3 HighLiGHts basket trial across a range of established growth hormone indications: idiopathic short stature (ISS), SHOX deficiency, Turner syndrome, and small for gestational age (SGA).
- YUVIWEL
(navepegritide, developed as TransCon CNP)
- YUVIWEL revenue for the second quarter of 2026 totaled €8 million.
- More than 220 unique YUVIWEL patient enrollments by more than 100 prescribing healthcare providers, with more than 65% of enrollments approved for reimbursement in the U.S. through July 31, 2026.
- Marketing Authorisation Application remains under review by the European Medicines Agency, with a decision anticipated in the fourth quarter of 2026.
- Making YUVIWEL available in select International Markets countries through early access programs using U.S. FDA approval.
- Completed target enrollment for pivotal reACHin Trial, supporting planned regulatory filings for infants 0 to <2 years of age with achondroplasia.
- Expect to initiate enrollment in Phase 3 trial in the second half of the year to investigate TransCon CNP monotherapy for the treatment of hypochondroplasia.
- TransCon CNP + TransCon hGH Combination Therapy
(navepegritide plus lonapegsomatropin) - Week 78 COACH Trial data showed sustained unprecedented efficacy over 78 weeks with no compromise to safety or tolerability.
- To date, 100% of the 21 enrolled children completed 78 weeks of treatment and remain on therapy in the COACH Trial.
- Expect to initiate enrollment in Phase 3 trial of TransCon CNP and TransCon hGH in pediatric achondroplasia in the fourth quarter of 2026.
Key Financial Highlights
- Total product revenue for the second quarter of 2026 increased to €315 million, reflecting year-over-year growth of +105%.
- Total revenue for the second quarter of 2026 was €339 million.
- Operating profit for the second quarter of 2026 totaled €220 million, reflecting a margin of 65%. On a non-IFRS basis, operating profit was €92 million*, reflecting a margin of 27%*.
- Net profit for the second quarter of 2026 totaled €207 million, or €2.83 per diluted share. On a non-IFRS basis, net profit was €61 million*, or €0.90 per diluted share*.
- As of June 30, 2026, Ascendis Pharma had cash and cash equivalents totaling €812 million, which includes the use of €56 million in the second quarter for our previously announced share repurchase program and the net settlement of certain Restricted Stock Units. As of December 31, 2025, cash and cash equivalents totaled €616 million.
- During the second quarter, the Company closed the sale of its Rare Pediatric Disease Priority Review Voucher (PRV) to an undisclosed buyer with payment of €158 million in cash, net of transaction-related expenses. The PRV was awarded by the FDA upon approval of YUVIWEL in February 2026.
- Effective May 6, 2026, the Company completed its previously announced optional redemption process with respect to all outstanding $575 million of 2.25% Convertible Senior Notes due 2028, resulting in the conversion of all outstanding notes. The conversions resulted in the settlement of the current liabilities of convertible notes to equity, comprising borrowings and derivative liabilities totaling €719 million as of the redemption date.
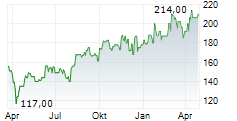
- After the close of market on June 26, 2026, the Company was added to multiple Russell U.S. Indexes, including the Russell 3000, Russell 1000, Russell 2500 and Russell Midcap Indexes.
* See "Non-IFRS Financial Measures" below for definitions of these non-IFRS measures and a reconciliation to the most directly comparable IFRS measures.
Second Quarter 2026 Financial Results
Total revenue for the second quarter of 2026 was €339 million, compared to €158 million during the same period in 2025.
| Total Revenue (In EUR'000s) | Three Months Ended June 30, | Six Months Ended June 30, | ||||||
| 2026 | 2025 | 2026 | 2025 | |||||
| Revenue | ||||||||
| Commercial products | 314,910 | 153,663 | 555,763 | 249,690 | ||||
| Services and clinical supply | 4,856 | 3,570 | 9,965 | 7,094 | ||||
| Licenses | 2,473 | 812 | 3,112 | 2,214 | ||||
| Milestones | 17,046 | - | 17,046 | - | ||||
| Total revenue | 339,285 | 158,045 | 585,886 | 258,998 | ||||
| Revenue from Commercial Products (In EUR'000s) | Three Months Ended June 30, | Six Months Ended June 30, | ||||||
| 2026 | 2025 | 2026 | 2025 | |||||
| Revenue from commercial products | ||||||||
| YORVIPATH | 252,114 | 102,957 | 449,010 | 147,646 | ||||
| SKYTROFA | 55,214 | 50,706 | 99,171 | 102,044 | ||||
| YUVIWEL | 7,582 | - | 7,582 | - | ||||
| Total revenue from commercial products | 314,910 | 153,663 | 555,763 | 249,690 | ||||
Research and development expenses for the second quarter of 2026 were €76 million, compared to €72 million during the same period in 2025. The higher expenses were due to increased clinical trial activities within the Endocrinology Rare Disease pipeline, offset by reduced clinical trial activities within Oncology.
Selling, general, and administrative expenses for the second quarter of 2026 were €173 million, compared to €108 million during the same period in 2025. The increase was primarily due to the continued impact from commercial expansion, including global launch activities.
Total operating expenses for the second quarter of 2026 were €249 million compared to €180 million during the same period in 2025.
Operating profit for the second quarter of 2026 was €220 million, compared to an operating loss of €53 million during the same period in 2025. The increase was primarily driven by growth in product revenue and sale of the PRV for €158 million in cash, net of transaction-related expenses.
Net finance income for the second quarter of 2026 was €6 million, compared to €22 million in the same period in 2025. The change was primarily driven by non-cash items.
For the second quarter of 2026, Ascendis Pharma reported a net profit of €207 million, or €3.22 per basic share and €2.83 per diluted share, compared to a net loss of €39 million, or €0.64 per basic share and €0.82 per diluted share for the same period in 2025.
Cash flows from operating activities for the six months ended June 30, 2026, were €274 million compared to €22 million used during the same period in 2025. The increase in cash flows from operating activities was primarily related to commercial revenue growth and sale of the PRV.
As of June 30, 2026, Ascendis Pharma had 66,189,926 ordinary shares outstanding, of which 516,642 were held as treasury shares.
For the second quarter of 2026, non-IFRS operating profit was €92 million, compared to a non-IFRS operating loss of €23 million for the same period in 2025.
For the second quarter of 2026, non-IFRS net profit was €61 million, or €0.90 earnings per diluted share, compared to a non-IFRS net profit of €4 million, or €0.07 earnings per diluted share, for the same period in 2025.
Conference Call and Webcast Information
Ascendis Pharma will host a conference call and webcast today at 8:00 am Eastern Time (ET) to discuss its second quarter 2026 financial results.
Those who would like to participate may access the live webcast here, or register in advance for the teleconference here. The link to the live webcast will also be available on the Investors & News section of the Ascendis Pharma website at https://investors.ascendispharma.com. A replay of the webcast will be available in this section of the Ascendis Pharma website shortly after the conclusion of the event for 30 days.
About Ascendis Pharma A/S
Ascendis Pharma is a global biopharmaceutical company focused on applying our innovative TransCon technology platform to make a meaningful difference for patients. Guided by our core values of Patients, Science, and Passion, and following our algorithm for product innovation, we apply TransCon to develop new therapies that demonstrate best-in-class potential to address unmet medical needs. Ascendis is headquartered in Copenhagen, Denmark, and has additional facilities in Europe and the United States. Please visit ascendispharma.com to learn more.
Forward-Looking Statements
This press release contains forward-looking statements that involve substantial risks and uncertainties. All statements, other than statements of historical facts, included in this press release regarding Ascendis' future operations, results, plans and objectives of management are forward-looking statements within the meaning of Section 27A of the Securities Act of 1933, as amended, and Section 21E of the Securities Exchange Act of 1934, as amended. Examples of such statements include, but are not limited to, statements relating to (i) anticipated timing of a regulatory decision from the European Medicines Agency, (ii) anticipated timing and plans of clinical trials and development activities, including expected timing of patient recruitment and trial initiation, (iii) Ascendis' ability to apply its TransCon technology platform to make a meaningful difference for patients, (iv) Ascendis' use of TransCon to create new and potentially best-in-class therapies, (v) plans for regulatory filings and label expansions, and (vi) expectations regarding continued patient demand, product uptake, reimbursement coverage, future growth and market positioning. Ascendis may not actually achieve the plans, carry out the intentions or meet the expectations or projections disclosed in the forward-looking statements and you should not place undue reliance on these forward-looking statements. Actual results or events could differ materially from the plans, intentions, expectations and projections disclosed in the forward-looking statements. Various important factors could cause actual results or events to differ materially from the forward-looking statements that Ascendis makes, including, without limitation: dependence on third-party manufacturers, distributors, and service providers for Ascendis' products and product candidates; risks related to regulatory review and approval, including the possibility of delays, requests for additional data or analyses, restrictions or limitations on use, approval with labeling that is more limited than expected, or failure to obtain approval in the United States, European Union, or other jurisdictions; clinical development risks, including that results from ongoing or future trials may not confirm earlier data; unforeseen safety or efficacy findings in development programs or on-market products; manufacturing, supply chain, quality, or logistics issues that could delay development or commercialization; unforeseen expenses related to commercialization of any approved Ascendis products; unforeseen research and development or selling, general and administrative expenses and other costs impacting Ascendis' business generally; market acceptance, pricing, and reimbursement challenges, including payer coverage decisions and health technology assessments; competitive developments, including new or improved therapies; intellectual property protection, freedom-to-operate, and litigation risks; Ascendis' ability to obtain additional funding, if needed, to support its business activities; cybersecurity, data privacy, and information technology disruptions; and the impact of international economic, political, legal, compliance, public health, and business factors, including tariffs, trade policies, currency fluctuations, and geopolitical events. For a further description of the risks and uncertainties that could cause actual results to differ from those expressed in these forward-looking statements, as well as risks relating to Ascendis' business in general, see Ascendis' Annual Report on Form 20-F filed with the U.S. Securities and Exchange Commission (SEC) on February 11, 2026, and Ascendis' other future reports filed with, or submitted to, the SEC. Forward-looking statements do not reflect the potential impact of any future licensing, collaborations, acquisitions, mergers, dispositions, joint ventures, or investments that Ascendis may enter into or make. Ascendis does not assume any obligation to update any forward-looking statements, except as required by law.
Ascendis, Ascendis Pharma, the Ascendis Pharma logo, the company logo, TransCon, SKYTROFA- , YORVIPATH- , and YUVIWEL- are trademarks owned by the Ascendis Pharma group. © August 2026 Ascendis Pharma A/S.
| Investor Contact: | Media Contact: |
| Chad Fugere | Melinda Baker |
| Ascendis Pharma | Ascendis Pharma |
| +1 (650) 519-7494 | +1 (650) 709-8875 |
| FINANCIAL TABLES FOLLOW | |
| Ascendis Pharma A/S Unaudited Condensed Consolidated Statements of Profit or (Loss) and Comprehensive Income / (Loss) (In EUR'000s, except per share data) | Three Months Ended June 30, | Six Months Ended June 30, | |||||||||||
| 2026 | 2025 | 2026 | 2025 | ||||||||||
| Consolidated Statement of Profit or (Loss) | |||||||||||||
| Revenue | 339,285 | 158,045 | 585,886 | 258,998 | |||||||||
| Cost of sales | (27,658 | - | (31,447 | - | (45,173 | - | (48,963 | - | |||||
| Gross profit | 311,627 | 126,598 | 540,713 | 210,035 | |||||||||
| Research and development expenses | (75,888 | - | (71,988 | - | (134,932 | - | (158,591 | - | |||||
| Selling, general, and administrative expenses | (173,341 | - | (107,561 | - | (318,571 | - | (208,608 | - | |||||
| Other operating income | 158,067 | - | 158,067 | - | |||||||||
| Operating profit/(loss) | 220,465 | (52,951 | - | 245,277 | (157,164 | - | |||||||
| Share of profit/(loss) of associates | 3,836 | (4,097 | - | (6,415 | - | 22,482 | |||||||
| Finance income | 19,965 | 55,059 | 9,347 | 83,912 | |||||||||
| Finance expenses | (14,173 | - | (33,018 | - | (66,292 | - | (77,803 | - | |||||
| Profit/(loss) before tax | 230,093 | (35,007 | - | 181,917 | (128,573 | - | |||||||
| Income taxes (expenses) | (23,123 | - | (3,848 | - | 654,393 | (4,909 | - | ||||||
| Net profit/(loss) for the period | 206,970 | (38,855 | - | 836,310 | (133,482 | - | |||||||
| Attributable to owners of the Company | 206,970 | (38,855 | - | 836,310 | (133,482 | - | |||||||
| Basic earnings/(loss) per share | 3.22 | (0.64 | - | 13.27 | (2.22 | - | |||||||
| Diluted earnings/(loss) per share | 2.83 | (0.82 | - | 12.73 | (2.22 | - | |||||||
| Consolidated Statement of Comprehensive Income or (Loss) | |||||||||||||
| Net profit/(loss) for the period | 206,970 | (38,855 | - | 836,310 | (133,482 | - | |||||||
| Other comprehensive income/(loss) | |||||||||||||
| Items that may be reclassified subsequently to profit or (loss): | |||||||||||||
| Exchange differences on translating foreign operations | 4,859 | (1,399 | - | 7,917 | (1,474 | - | |||||||
| Other comprehensive income/(loss) for the period, net of tax | 4,859 | (1,399 | - | 7,917 | (1,474 | - | |||||||
| Total comprehensive income/(loss) for the period, net of tax | 211,829 | (40,254 | - | 844,227 | (134,956 | - | |||||||
| Attributable to owners of the Company | 211,829 | (40,254 | - | 844,227 | (134,956 | - | |||||||
| Ascendis Pharma A/S Unaudited Condensed Consolidated Statements of Financial Position (In EUR'000s) | June 30, 2026 | December 31, 2025 | ||||
| Assets | ||||||
| Non-current assets | ||||||
| Intangible assets | 3,680 | 3,710 | ||||
| Property, plant and equipment | 135,685 | 146,479 | ||||
| Investments in associates | 30,479 | 32,526 | ||||
| Other receivables | 26,489 | 10,870 | ||||
| Deferred tax assets | 699,276 | - | ||||
| 895,609 | 193,585 | |||||
| Current assets | ||||||
| Inventories | 310,576 | 301,533 | ||||
| Trade receivables | 206,505 | 141,333 | ||||
| Income tax receivables | 1,993 | 1,781 | ||||
| Other receivables | 15,604 | 14,582 | ||||
| Prepayments | 43,473 | 33,715 | ||||
| Cash and cash equivalents | 812,260 | 616,041 | ||||
| 1,390,411 | 1,108,985 | |||||
| Total assets | 2,286,020 | 1,302,570 | ||||
| Equity and liabilities | ||||||
| Equity | ||||||
| Share capital | 8,885 | 8,322 | ||||
| Distributable equity | 1,427,606 | (171,143 | - | |||
| Total equity | 1,436,491 | (162,821 | - | |||
| Non-current liabilities | ||||||
| Borrowings | 384,642 | 385,254 | ||||
| Contract liabilities | - | 1,123 | ||||
| Deferred tax liabilities | - | 9,623 | ||||
| 384,642 | 396,000 | |||||
| Current liabilities | ||||||
| Convertible notes | ||||||
| Borrowings | - | 429,391 | ||||
| Derivative liabilities | - | 256,231 | ||||
| - | 685,622 | |||||
| Other current liabilities | ||||||
| Borrowings | 65,432 | 57,141 | ||||
| Contract liabilities | 2,776 | 4,944 | ||||
| Trade payables and accrued expenses | 103,920 | 90,657 | ||||
| Other liabilities | 58,690 | 58,204 | ||||
| Income tax payables | 12,662 | 6,427 | ||||
| Provisions | 221,407 | 166,396 | ||||
| 464,887 | 383,769 | |||||
| 464,887 | 1,069,391 | |||||
| Total liabilities | 849,529 | 1,465,391 | ||||
| Total equity and liabilities | 2,286,020 | 1,302,570 | ||||
| Ascendis Pharma A/S Unaudited Condensed Consolidated Statements of Cash Flows (In EUR'000s) | Six Months Ended June 30, | ||||||||
| 2026 | 2025 | ||||||||
| Operating activities | |||||||||
| Net profit/(loss) for the period | 836,310 | (133,482 | - | ||||||
| Reversal of finance income | (9,347 | - | (83,912 | - | |||||
| Reversal of finance expenses | 66,292 | 77,803 | |||||||
| Reversal of (gain)/loss on disposal of property, plant and equipment | 21 | - | |||||||
| Reversal of income taxes | (654,393 | - | 4,909 | ||||||
| Adjustments for non-cash items: | |||||||||
| Non-cash consideration relating to revenue | (3,112 | - | (2,214 | - | |||||
| Share of (profit)/loss of associates | 6,415 | (22,482 | - | ||||||
| Share-based payment | 59,964 | 55,580 | |||||||
| Depreciation and amortization | 8,789 | 8,853 | |||||||
| Impairment of property, plant and equipment | - | 7,508 | |||||||
| Changes in working capital: | |||||||||
| Inventories | (9,044 | - | (7,772 | - | |||||
| Receivables | (61,050 | - | 50,047 | ||||||
| Prepayments | (9,487 | - | (6,801 | - | |||||
| Contract liabilities | (3,291 | - | (3,455 | - | |||||
| Trade payables, accrued expenses and other liabilities | 8,659 | (25,558 | - | ||||||
| Provisions | 50,369 | 65,536 | |||||||
| Cash flows generated from/(used in) operations | 287,095 | (15,440 | - | ||||||
| Finance income received | 9,347 | 7,603 | |||||||
| Finance expenses paid | (17,115 | - | (9,689 | - | |||||
| Income taxes received/(paid) | (5,366 | - | (4,128 | - | |||||
| Cash flows from/(used in) operating activities | 273,961 | (21,654 | - | ||||||
| Investing activities | |||||||||
| Payments received under finance leases | 1,341 | - | |||||||
| Acquisition of intangible assets and property, plant and equipment | (10,948 | - | (5,041 | - | |||||
| Cash flows from/(used in) investing activities | (9,607 | - | (5,041 | - | |||||
| Financing activities | |||||||||
| Repayment of borrowings | (16,720 | - | (8,553 | - | |||||
| Proceeds from exercise of warrants | 50,086 | 26,302 | |||||||
| Costs of capital increase | (125 | - | - | ||||||
| Acquisition of treasury shares | (103,412 | - | (17,396 | - | |||||
| Payment of withholding taxes under stock incentive programs | (12,781 | - | (11,396 | - | |||||
| Cash flows from/(used in) financing activities | (82,952 | - | (11,043 | - | |||||
| Increase/(decrease) in cash and cash equivalents | 181,402 | (37,738 | - | ||||||
| Cash and cash equivalents at January 1 | 616,041 | 559,543 | |||||||
| Effect of exchange rate changes on balances held in foreign currencies | 14,817 | (27,759 | - | ||||||
| Cash and cash equivalents at June 30 | 812,260 | 494,046 | |||||||
Non-IFRS Financial Measures
In addition to the financial information prepared in accordance with IFRS Accounting Standards ("IFRS") as issued by the International Accounting Standards Board and as adopted by the European Union, this press release contains certain non-IFRS financial measures, including Non-IFRS Operating Profit/(Loss), Non-IFRS Net Profit/(Loss), Non-IFRS operating profit/(loss) margin, and Non-IFRS diluted earnings per share ("Non-IFRS Diluted EPS"). These non-IFRS measures are provided as supplemental information and should be considered in addition to, and not as a substitute for or superior to, the comparable measures prepared in accordance with IFRS. Management believes these non-IFRS measures support management's, analysts' and investors' overall understanding of the Company's underlying financial performance and trends and facilitate comparisons among current and past periods.
Since non-IFRS measures do not have standardized definitions and meanings, they may differ from the non-IFRS measures used by other companies, which reduces their usefulness as comparative financial measures. Because of these limitations, you should consider these adjusted financial measures alongside other IFRS financial measures. Because these non-IFRS measures are not prepared in accordance with IFRS, they should not be viewed as superior to IFRS reported measures, nor should they be used on their own or as replacements for the IFRS financial information included in this press release. Additionally, our non-IFRS measures may differ from similarly labeled measures used by other companies due to variations in calculation methods or the size and nature of adjusted items. Investors should note that several of the items excluded from these non-IFRS measures have been recognized in prior periods and may continue to be recognized in future periods.
The Company reports Non-IFRS Operating Profit/(Loss), Non-IFRS Net Profit/(Loss), Non-IFRS operating profit/(loss) margin and Non-IFRS Diluted EPS as non-IFRS measures, which exclude the following specified items:
(i) Share-based compensation costs. Although share-based compensation is a recurring expense, the Company excludes it from non-IFRS measures because the amount and timing of recognition depend on the value of the underlying equity instruments, which can fluctuate based on factors unrelated to the Company's operating performance during the period.
(ii) Other operating income from sale of PRV. The Company excludes income recognized from the sale of its PRV because it does not reflect the Company's ongoing operating activities.
(iii) Share of (profit)/loss of associates. The Company excludes its share of the profit or loss of equity-method investees because these amounts are not within the control of the Company and do not reflect the Company's core operating performance.
(iv) Remeasurement (gain)/loss of derivative liabilities. The Company excludes the fair-value remeasurement of derivative liabilities associated with its convertible notes because these amounts depend on movements in the Company's share price and other market inputs and are not indicative of the Company's underlying operating performance.
(v) Remeasurement (gain)/loss of royalty funding liabilities. The Company excludes gains and losses arising from the remeasurement of royalty funding liabilities as these amounts are driven by changes in estimates of future royalty payment obligations under the Company's royalty funding agreements and do not reflect the Company's underlying operating performance.
(vi) Recognition of previously unrecognized deferred tax assets. The Company excludes the one-time recognition of previously unrecognized deferred tax assets because this item reflects a reassessment of the recoverability of historical tax attributes rather than the Company's current period operating performance.
Income taxes related to the foregoing items are adjusted accordingly, considering the individual impact of each item, the relevant tax jurisdiction, applicable tax rates, and the deductibility of the item.
For further details regarding valuation of derivative liabilities, and the recognition of previously unrecognized deferred tax assets, please refer to "Note 3 - Significant Accounting Judgements and
Estimates," contained in our Interim Report on Form 6-K, for the period ended June 30, 2026 and "Note 3 - Significant Accounting Judgements and Estimates," contained in our Annual Report on Form 20-F, for the year ended December 31, 2025.
The following table provides a reconciliation of the most directly comparable IFRS measures to Non-IFRS Operating Profit/(Loss), Non-IFRS Net Profit/(Loss) and Non-IFRS Diluted EPS.
| Reconciliation of unaudited IFRS to Non-IFRS Financial Information | ||||||||||||
| (in EUR'000s, except number of shares and per share data) | ||||||||||||
| Three Months Ended June 30, | Six Months Ended June 30, | |||||||||||
| 2026 | 2025 | 2026 | 2025 | |||||||||
| IFRS operating profit/(loss) | 220,465 | (52,951 | - | 245,277 | (157,164 | - | ||||||
| Share-based compensation costs | 29,608 | 30,022 | 59,964 | 55,580 | ||||||||
| Other operating income from sale of PRV | (158,067 | - | - | (158,067 | - | - | ||||||
| Total non-IFRS adjustments to operating profit/(loss) | (128,459 | - | 30,022 | (98,103 | - | 55,580 | ||||||
| Non-IFRS operating profit/(loss) | 92,006 | (22,929 | - | 147,174 | (101,584 | - | ||||||
| IFRS operating profit/(loss) margin (%)1 | 65.0 | - | (33.5 | %) | 41.9 | - | (60.7 | %) | ||||
| Non-IFRS operating profit/(loss) margin (%)1 | 27.1 | - | (14.5 | %) | 25.1 | - | (39.2 | %) | ||||
| IFRS Net profit/(loss) | 206,970 | (38,855 | - | 836,310 | (133,482 | - | ||||||
| Share-based compensation costs | 29,608 | 30,022 | 59,964 | 55,580 | ||||||||
| Other operating income from sale of PRV | (158,067 | - | - | (158,067 | - | - | ||||||
| Share of (profit)/loss of associates | (3,836 | - | 4,097 | 6,415 | (22,482 | - | ||||||
| Remeasurement (gain)/loss of derivative liabilities | (8,313 | - | 11,998 | 25,938 | 35,909 | |||||||
| Remeasurement (gain)/loss of royalty funding liabilities | - | (1,399 | - | - | (1,399 | - | ||||||
| Recognition of previously unrecognized deferred tax assets | (24,622 | - | - | (704,209 | - | - | ||||||
| Tax effects of adjustments | 19,524 | (1,641 | - | 11,901 | (3,281 | - | ||||||
| Total non-IFRS adjustments to net profit/(loss) | (145,706 | - | 43,077 | (758,058 | - | 64,327 | ||||||
| Non-IFRS net profit/(loss) | 61,264 | 4,222 | 78,252 | (69,155 | - | |||||||
| Net profit/(loss) per diluted share: | ||||||||||||
| IFRS adjusted for dilution effects (as reported)2 | 2.83 | (0.82 | - | 12.73 | (2.22 | - | ||||||
| IFRS excluding dilution effects | 3.03 | (0.61 | - | 12.73 | (2.22 | - | ||||||
| Diluted per share impact of total non-IFRS adjustments | (2.13 | - | 0.67 | (11.54 | - | 1.07 | ||||||
| Non-IFRS | 0.90 | 0.07 | 1.19 | (1.15 | - | |||||||
| Shares used in diluted per share calculation (IFRS and non-IFRS): | 68,320,412 | 63,911,374 | 65,678,245 | 60,237,774 | ||||||||
| 1 Defined as either IFRS or non-IFRS operating profit/(loss) divided by total revenue | ||||||||||||
| 2 Dilutive effects relate to impact from convertible notes (interests, foreign exchange gain/(loss), and fair value adjustments on derivative liabilities, net of tax) of €13.8 million and €13.5 million for the three months ended June 30, 2026 and 2025, respectively. There were no dilution impact for the six months ended June 30, 2026 and 2025. | ||||||||||||

