Lead, South Dakota--(Newsfile Corp. - September 10, 2026) - Dakota Gold Corp. (NYSE American: DC) ("Dakota Gold" or the "Company") is pleased to provide results from the Pre-Feasibility Study ("PFS") metallurgical test program for its Richmond Hill Oxide Heap Leach Gold Project ("Richmond Hill" or the "Project") in the Homestake District of South Dakota. Results were generated from a PFS dataset using 24 master-composite column tests that cover the principal lithologic, grade, and oxidation domains at crush sizes of 0.5-inch (12.7 millimeters) and 1-inch (25.4 millimeters) with column leach times varying from 21 to 47 days. These results confirm that Richmond Hill is amenable to heap leaching, with positive gold recoveries of up to 92.0% validating historical test work, and supporting the PFS that remains on track for completion in the fourth quarter of 2026.
Highlights from this Update Include:
- Oxide material recoveries: Twelve oxide column tests ranged in recoveries from 92.0% to 57.3%, with an unweighted arithmetic average of 74.2%. Breccia oxide material returned gold extraction of 92.0% to 90.7%. Oxide leach cycle times are consistently in the 30-to 40-day nominal range. At 0.5-inch crush size for oxide material, ultimate gold recoveries from heap leaching are expected to range from 90.3% to 70.0%, with an 80.4% unweighted paired domain mean.
Table 1. Modeled ultimate recoveries segregated by crush size1.
| Material / nominal P₈₀ | Domains | Gold Recovery Range | Mean Gold | Silver Recovery Range |
| Oxide / 0.5" | 8 | 90.3-70.0% | 80.4% | 43.3-9.0% |
| Oxide / 1" | 8 | 87.2-69.1% | 75.9% | 33.6-5.1% |
| ||||
Positive material characteristics: Testing to date has shown no discernible issues with compact permeability, clay material, preg-robbing concerns, or any other characteristics that would impede expected operational or metallurgical performance.
Additional drilling is underway: Dakota Gold has commenced a definition drill program in the central Project area of Richmond Hill targeting conversion of high recovery breccia-hosted oxide inferred resources to mineral reserves for the Feasibility Study ("FS"). The program is expected to complete approximately 11,000 meters (36,000 feet) of definition drilling during 2026-2027 and the results will support future mine sequencing and optimization opportunities. (See Figure 2)
Jack Henris, CEO, President and Director of Dakota Gold, said, "We are pleased to have completed our comprehensive metallurgical test program for our PFS, a key step in our process to systematically de-risk the Project through disciplined and detailed technical studies for the responsible development of Richmond Hill. The PFS metallurgical test program results support the conversion of Richmond Hill's geological variability into a practical recovery model for mine planning and process design. Separating oxide from transition material performance gives the Company a clearer basis for recovery assignment, mine sequencing, ore routing, and process optimization. The strong breccia-hosted material recovery response and the defined crush-size trade-offs are important inputs to selecting a technically-sound, capital-efficient, heap leach flowsheet."
PFS Metallurgical Test Program
The PFS metallurgical test program builds on historical test work and is designed to support PFS level definition of metallurgical variability. More than 100 holes drilled in 2025 were designed in whole or in part to collect metallurgical samples representative of the rock types, lithologies, and geological formations in the proposed mine plan (Figure 1). Representative material was selected to evaluate 24 to 28 potential geometallurgical domains. Forte Dynamics, Inc. (now part of SLR International Corporation) conducted the PFS metallurgical test program, which includes ore characterization, bottle-roll and column-leach testing, comminution and crushing studies, process optimization, deleterious-element characterization and environmental testing.
Based on these results, the definitions used to classify oxide and transition material, the Company does not expect a significant amount of transition material to be part of the mine plan. Additional work will be undertaken on transition material that may be encountered during the mining of oxides. Recovery information for transition material can be reviewed in the Appendix.
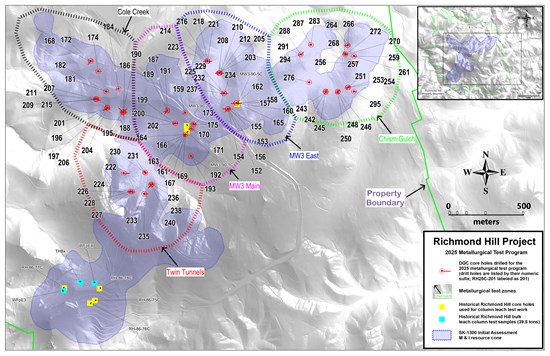
Figure 1. Richmond Hill 2025 metallurgical drill program and potential geometallurgical test zones. Red drill hole symbols identify 2025 metallurgical holes; the outlined areas show potential test domains over the S-K 1300 Initial Assessment resource footprint.
To view an enhanced version of this graphic, please visit:
https://images.newsfilecorp.com/files/8218/313768_b21b31fa04989b2b_002full.jpg
Master-Composite Column Results
A summary of the 12 completed oxide material master-composite column tests conducted for the PFS is shown in Table 2. The results for the 12 completed transition material master-composite column tests can be viewed in the Appendix. These results are laboratory extractions. Commercial recovery assumptions will require scale-up, solution-management modeling, and operating allowances which will be finalized in the FS metallurgical test work.
Table 2. Gold oxide material recovery ranges from the supplied master-composite column dataset. Arithmetic averages are descriptive only and are not weighted by grade, contained metal, or planned PFS tonnage.
| Domain | Tests | Gold Extraction |
| Breccia oxide | 2 | 92.0-90.7% |
| Tertiary intrusive oxide | 4 | 80.9-66.4% |
| Precambrian oxide | 2 | 80.6-74.4% |
| Deadwood oxide | 4 | 73.4-57.3% |
| Arithmetic mean Gold extraction: 74.2% | ||
Summary Table of Master-Composite Bottle-Roll and Column Results
Table 3. Oxide material bottle-roll ("BRT") (74 micron) and column test ("CLT") extractions from the master-composite column dataset.
| Extractions from Master-Composite Column Testing vs Bottle-Roll Testing | |||||||||
| Gold (Au) | Silver (Ag) | ||||||||
| Test ID | P80 | BRT Extracted % Au | CLT Extracted % Au | BRT Extracted g/t Au | CLT Extracted g/t Au | BRT Extracted % Ag | CLT Extracted % Ag | BRT Extracted g/t Ag | CLT Extracted g/t Ag |
| Breccia Oxide | 0.5" | 94.6 | 92.0 | 1.280 | 1.025 | 69.3 | 61.1 | 10.00 | 10.69 |
| Breccia Oxide | 1" | 94.6 | 90.7 | 1.280 | 1.237 | 69.3 | 46.8 | 10.00 | 6.96 |
| Tertiary Intrusives HG Oxide | 0.5" | 91.2 | 80.9 | 1.540 | 1.290 | 35.4 | 8.2 | 5.40 | 1.60 |
| Tertiary Intrusives LG Oxide | 0.5" | 86.9 | 79.2 | 0.330 | 0.242 | 38.8 | 9.1 | 2.20 | 0.54 |
| Tertiary Intrusives HG Oxide | 1" | 91.2 | 71.8 | 1.540 | 1.340 | 35.4 | 7.0 | 5.40 | 1.14 |
| Tertiary Intrusives LG Oxide | 1" | 86.9 | 66.4 | 0.330 | 0.220 | 38.8 | 4.6 | 2.20 | 0.29 |
| Precambrian Oxide | 0.5" | 82.5 | 80.6 | 0.500 | 0.433 | 39.3 | 12.0 | 2.40 | 0.90 |
| Precambrian Oxide | 1" | 82.5 | 74.4 | 0.500 | 0.423 | 39.3 | 8.2 | 2.40 | 0.71 |
| Deadwood LG Oxide | 1" | 88.0 | 73.4 | 0.260 | 0.226 | 37.8 | 8.3 | 3.40 | 0.74 |
| Deadwood HG Oxide | 0.5" | 88.5 | 65.0 | 1.210 | 0.843 | 62.3 | 16.7 | 24.90 | 3.75 |
| Deadwood HG Oxide | 1" | 88.5 | 59.2 | 1.210 | 0.897 | 62.3 | 13.5 | 24.90 | 3.38 |
| Deadwood LG Oxide | 0.5" | 88.0 | 57.3 | 0.260 | 0.262 | 37.8 | 8.9 | 3.40 | 0.92 |
Table 4. Approximate tonnage distribution in the deposit.
| Approximate Oxide Tonnes by Lithology / Formation | |
| Breccia | ~15% |
| Deadwood | ~49% |
| Precambrian | ~20% |
| Tertiary Intrusive | ~16% |
Current Analysis of Crush Size
The crush-size trade-off studies remain active, with the 0.5-inch modeled mean ultimate gold recovery of 80.4% for oxide material, approximately 4.5 percentage points higher than the corresponding 1-inch case. The benefit of the higher recovery will be evaluated against crushing, conveying, and operating costs. The mean modeled recovery at 1 inch is 75.9% for oxide material.
Interpretation and PFS Application
The oxide material provides the stronger overall heap leach gold response, with a 74.2% unweighted average column extraction. The higher modeled ultimate recovery mean is 80.4% at 0.5 inch, followed by 75.9% at 1 inch. Breccia oxide is the strongest performing material tested, followed by Tertiary intrusive and Precambrian oxide; Deadwood oxide is more variable and will require domain-specific recovery assignment, optimization, and sequencing controls. Oxide material is defined as having a CN/FA ratio >=0.82 and total sulfur content <=0.5%.
The ultimate recovery schedule will integrate the available column behavior, master- and sub composite bottle-roll results and domain-specific technical judgment. The PFS will reconcile these assignments against resource model tonnage, mine sequence, permeability, cyanide and lime consumption, solution chemistry and capital and operating cost trade-offs before establishing the production-weighted recovery assumptions used in the PFS economic model.
Next Steps for Advancing the FS
Complete remaining variability, optimization, load permeability, and environmental test work, including confirmation of recovery behavior in lower performing domains.
Finalize the geometallurgical domain model and reconcile sample coverage against the updated PFS resource and mine plan.
Complete crush-size and throughput trade-off studies and finalize the PFS to FS process design criteria.
Develop production-weighted gold and silver recovery assumptions, together with appropriate commercial scale-up and operating allowances, for the PFS financial model.
Complete additional detailed bottle-roll, column test work, and variability testing to inform the FS.
Follow-up Richmond Hill Metallurgical and Definition Drill Program
Following review of the metallurgical work, Dakota Gold plans to complete approximately 3,800 meters (~12,500 feet) of metallurgical drilling throughout the Project area, and 11,000 meters (~36,000 feet) of definition drilling in the central Project area of Richmond Hill (Figure 2). Mineralization in the central Project area is hosted primarily within breccia, Precambrian, and Tertiary intrusive rock units which have better oxide gold recoveries. The drill program commenced in the third quarter of 2026 and will continue into 2027. Both programs will be informing the FS expected to be published mid-2027.
The metallurgical holes will be drilled to provide material for new column test work. The definition program will have two principal objectives. First, it will target conversion of a significant amount of modeled inferred oxide breccia-hosted mineralized material to reserve category for initial mine sequencing as this type of material had a high recovery of up to 92.0% in the metallurgical test program. Second, the program will add geochemical information including cyanide-soluble gold and multi-element data to supplement the Company's drilling and historical gold assay drilling database in the area. These supplemented datasets, together with the ongoing metallurgical test results, will inform the recovery and resource model and subsequent mine planning work as the Company transitions to the FS.
Assay results from this program will be incorporated into the updated Richmond Hill resource model in advance of the FS. The expected result is a better defined, metallurgically informed central Project area, with additional resource category conversions where supported by drilling, assays, and geochemical characterization.
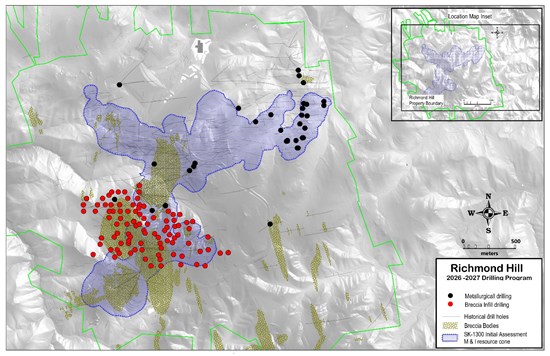
Figure 2. Plan map showing location of Richmond Hill planned metallurgical and definition drill program.
To view an enhanced version of this graphic, please visit:
https://images.newsfilecorp.com/files/8218/313768_b21b31fa04989b2b_003full.jpg
About Dakota Gold Corp.
Dakota Gold is a responsible exploration and development company advancing the Richmond Hill Gold Project toward production as soon as 2029, while continuing to define and expand the high-grade underground gold resource potential at the Maitland Gold Project. Both projects are located on private land within the historic Homestake District of South Dakota, one of the most prolific gold mining regions in the United States.
Subscribe to Dakota Gold's e-mail list at www.dakotagoldcorp.com to receive the latest news and other Company updates.
Shareholder and Investor Inquiries
For more information, please contact:
Jack Henris
CEO, President and Director
Tel: +1 605-717-2540
Shawn Campbell
Chief Financial and Development Officer
Tel: +1 778-655-9638
Carling Gaze
Director of Investor Relations
Tel: +1 605-679-7429
Email: info@dakotagoldcorp.com
Qualified Person and S-K 1300 Disclosure
Barry Carlson, SME Registered Member, Principal Engineer - SLR International Corporation, is the Company's designated qualified person, as defined in Subpart 1300 of Regulation S-K, for the metallurgical scientific and technical information in this news release and has reviewed and approved that information. The qualified person has verified the data underlying the disclosure by reviewing laboratory certificates, test procedures, metallurgical mass balances and the Company's quality-control records.
Metallurgical Test Work and Quality Assurance/Quality Control
Samples were selected from drill core and assembled into master- and sub composites to represent lithology, grade class and oxidation state within the potential geometallurgical domains. Metallurgical testing was performed by Forte Dynamics, Inc., a third party laboratory located in Fort Collins, CO. The program includes fire assay and cyanide-soluble head analyses, direct-leach bottle rolls, column-leach tests at nominal P₈₀ crush sizes of 12.7 mm and 25.4 mm, solution assays, residue assays and metallurgical balances. Column tests reported herein ran for 21 to 63 days. Sample custody, preparation, analytical procedures, quality assurance/quality control (QA/QC), and data validation were conducted in accordance with established industry best practices. The laboratory procedures incorporate appropriate sample tracking and chain of custody controls typical of accredited operations, documented sample preparation and analytical protocols, and the use of standards, blanks, and duplicate samples, as applicable. Check assays and review of analytical results are performed as appropriate to verify data quality and consistency. Laboratory procedures and QA/QC practices are designed to meet or exceed generally accepted industry practices for metallurgical test work and to provide reliable and reproducible results.
Forward-Looking Statements
This communication contains forward-looking statements within the meaning of Section 27A of the Securities Act of 1933, as amended, and Section 21E of the Securities Exchange Act of 1934, as amended. When used in this communication, the words "plan," "target," "anticipate," "believe," "estimate," "intend," "potential," "will" and "expect" and similar expressions are intended to identify such forward-looking statements. Any express or implied statements contained in this communication that are not statements of historical fact may be deemed to be forward-looking statements, including, without limitation: completion and timing of the PFS and feasibility study; expected metallurgical recoveries and the conversion of laboratory extraction or modeled ultimate recovery into commercial performance; project economics, development and potential production, our expectations regarding additional drilling, metallurgy and modeling; our expectations for the improvement and growth of the mineral resources and potential for conversion of mineral resources into reserves; completion of, permitting; and our overall expectation for the possibility of near-term production at the Richmond Hill project. These forward-looking statements are based on assumptions and expectations that may not be realized and are inherently subject to numerous risks and uncertainties, which could cause actual results to differ materially from these statements. These risks and uncertainties include, among others: the execution and timing of our planned exploration activities; our use and evaluation of historic data; our ability to achieve our strategic goals; the state of the economy and financial markets generally and the effect on our industry; and the market for our common stock. The foregoing list is not exhaustive. For additional information regarding factors that may cause actual results to differ materially from those indicated in our forward-looking statements, we refer you to the risk factors included in Item 1A of the Company's Annual Report on Form 10-K for the fiscal year ended December 31, 2025, as updated by annual, quarterly and current reports that we file with the SEC, which are available at www.sec.gov. We caution investors not to place undue reliance on the forward-looking statements contained in this communication. These statements speak only as of the date of this communication, and we undertake no obligation to update or revise these statements, whether as a result of new information, future events or otherwise, except as may be required by law. We do not give any assurance that we will achieve our expectations.
All references to "$" in this communication are to U.S. dollars unless otherwise stated.
Appendix
Silver Recovery
Silver remains a co-product credit under evaluation. The oxide column silver extraction reached 61.1% and ranged from 61.1% to 4.6%. Modeled recovery assumptions remain segregated by oxidation class.
Transition Material Recovery
Twelve column tests for transition material returned gold extraction up to 83.7%, ranging from 83.7% to 60.1%, with an unweighted arithmetic average of 67.1%. Breccia transition material returned 83.7%. At 0.5-inch crush size for transition material, ultimate gold recoveries from heap leaching for this material would be expected to range from 84.8% to 65.6%, with a 74.4% unweighted paired-domain mean. Breccia transition material performed strongest, followed by Tertiary intrusive, Deadwood and Precambrian transition material-composites.
The PFS will preserve separate transition material recovery domains and evaluate blending, sequencing, crush-size and potential acid generating (PAG) controls rather than applying an oxide-derived recovery assumption. Transition material is defined as having a CN/FA ratio >=0.70 and total sulfur content between 0.5% and 1.1%.
Master-Composite Column Results for Oxide and Transition Material
A summary of the 24 completed master-composite column tests conducted for the PFS is shown in Table 5. Results are laboratory extractions and should not be read as commercial heap leach recovery forecasts. Commercial recovery assumptions require scale-up, solution-management and operating allowances.
Table 5. Oxide and transition material ranges from the supplied master-composite column dataset. Arithmetic averages are descriptive only and are not weighted by grade, contained metal, or planned PFS tonnage.
| Domain | Tests | Gold (Au) Extraction | Silver (Ag) Extraction |
| OXIDE MATERIAL | 12 | ||
| Breccia oxide | 2 | 92.0-90.7% | 61.1-46.8% |
| Tertiary intrusive oxide | 4 | 80.9-66.4% | 9.1-4.6% |
| Precambrian oxide | 2 | 80.6-74.4% | 12.0-8.2% |
| Deadwood oxide | 4 | 73.4-57.3% | 16.7-8.3% |
| Arithmetic mean Gold (Au) extraction: 74.2% | |||
| TRANSITION MATERIAL | 12 | ||
| Breccia transition | 1 | 83.7% | 16.5% |
| Tertiary intrusive transition | 3 | 77.0-65.6% | 13.4-6.3% |
| Deadwood transition | 4 | 68.7-60.5% | 17.8-12.5% |
| Precambrian transition | 4 | 66.3-60.1% | 17.6-9.5% |
| Arithmetic mean Gold (Au) extraction: 67.1% | |||
Table 6. Master-composite column test data.
| Master-Composite Column Test Data | ||||||||||||
| Gold (Au) | Silver (Ag) | |||||||||||
| Test ID | P80 | Days of Extraction | Extraction % Au | Extracted Au | Tail Assay Au | Calc'd Head Au | Head Assay Au | Extraction % Ag | Extracted Ag | Tail Assay Ag | Calc'd Head Ag | Head Assay Ag |
| Breccia Oxide | 0.5" | 43 | 92.0 | 1.025 | 0.089 | 1.114 | 1.097 | 61.1 | 10.69 | 6.8 | 17.5 | 12.8 |
| Breccia Oxide | 1" | 47 | 90.7 | 1.237 | 0.127 | 1.364 | 1.097 | 46.8 | 6.96 | 7.9 | 14.9 | 12.8 |
| Tertiary Intrusives HG Oxide | 0.5" | 40 | 80.9 | 1.29 | 0.304 | 1.592 | 1.586 | 8.2 | 1.6 | 17.9 | 19.5 | 14.3 |
| Tertiary Intrusives LG Oxide | 0.5" | 30 | 79.2 | 0.242 | 0.064 | 0.305 | 0.396 | 9.1 | 0.54 | 5.4 | 5.9 | 5.3 |
| Tertiary Intrusives HG Oxide | 1" | 40 | 71.8 | 1.34 | 0.528 | 1.869 | 1.586 | 7.0 | 1.14 | 15.2 | 16.3 | 14.3 |
| Tertiary Intrusives LG Oxide | 1" | 30 | 66.4 | 0.22 | 0.112 | 0.332 | 0.396 | 4.6 | 0.28 | 6.0 | 6.2 | 5.3 |
| Precambrian Oxide | 0.5" | 36 | 80.6 | 0.433 | 0.105 | 0.538 | 0.575 | 12.0 | 0.9 | 6.6 | 7.5 | 6.0 |
| Precambrian Oxide | 1" | 39 | 74.4 | 0.423 | 0.146 | 0.568 | 0.575 | 8.2 | 0.71 | 8.0 | 8.7 | 6.0 |
| Deadwood LG Oxide | 1" | 21 | 73.4 | 0.226 | 0.082 | 0.308 | 0.263 | 8.3 | 0.74 | 8.1 | 8.8 | 7.1 |
| Deadwood HG Oxide | 0.5" | 21 | 65.0 | 0.843 | 0.454 | 1.297 | 1.272 | 16.7 | 3.75 | 18.7 | 22.4 | 29.7 |
| Deadwood HG Oxide | 1" | 27 | 59.2 | 0.897 | 0.619 | 1.516 | 1.272 | 13.5 | 3.38 | 21.7 | 25.1 | 29.7 |
| Deadwood LG Oxide | 0.5" | 21 | 57.3 | 0.262 | 0.196 | 0.458 | 0.263 | 8.9 | 0.92 | 9.4 | 10.3 | 7.1 |
Current Modeled Ultimate Recovery Ranges for Oxide and Transition Material
Table 7. Draft modeled ultimate recoveries segregated by oxidation class and crush size. Means are unweighted across eight domains within each material and do not represent planned production weighted recovery.
| Material / nominal P₈₀ | Domains | Gold recovery range | Mean Gold | Silver recovery range |
| Oxide / 0.5" | 8 | 90.3-70.0% | 80.4% | 43.3-9.0% |
| Oxide / 1" | 8 | 87.2-69.1% | 75.9% | 33.6-5.1% |
| Transition / 0.5" | 8 | 84.8-65.6% | 74.4% | 23.2-8.4% |
| Transition / 1" | 8 | 81.0-61.2% | 70.3% | 18.9-6.9% |

To view the source version of this press release, please visit https://www.newsfilecorp.com/release/313768