


VANCOUVER, British Columbia, April 13, 2026 (GLOBE NEWSWIRE) -- West Red Lake Gold Mines Ltd. ("West Red Lake Gold" or "WRLG" or the "Company") (TSXV: WRLG) (OTCQB: WRLGF) is pleased to report drill results from its 100% owned Madsen Mine located in the Red Lake Gold District of Northwestern Ontario, Canada.
Will Robinson, Vice President of Exploration, stated, "The 904 Complex in lower Austin is steadily growing into a very important part of the future at Madsen. Having only just gained access to this area for drilling in late 2025, the results received to date are highly encouraging. For historic comparison, the High-Grade Zone discovery by Goldcorp Inc. in Red Lake was initially established on nine holes with a weighted average grade of 311 grams per tonne gold, uncapped, over 2.3 metres1 - we already have multiple results received to date out of 904 that exceed these grades and thicknesses."
"Additionally, our definition drills have only begun testing the upper 30 metres of the currently modeled 200 metre by 200 metre mineralized panel in 904 - which is believed to be fully intact and has had no historic mining. This allows for our geologists to observe complete cross sections of the Austin zone in drill core which is also adding to our understanding of structural controls on gold deposition. In a way, we are seeing this area of the Madsen deposit for the first time which is quite exciting and informative. We see growth potential at depth in the 904 area and will continue to drill and define this area throughout 2026."
The results from Austin 904 Complex presented in this update were all drilled from the 13 Level of the Madsen Mine at approximately 650m depth. These results are in addition to those recently announced on February 25, 2026 which highlighted 219.73 grams per tonne ("g/t") gold ("Au") over 4.8 metres ("m") 148.36 g/t Au over 3m and 133.13 g/t Au over 2.5m
The Austin 904 presents a unique opportunity in Madsen as a completely intact panel of gold mineralization approximately 200m by 200m in size. This area of the deposit was not historically mined which is rare for the Madsen deposit and places WRLG in a favorable position to have full access to the entire mineralized zone for mining - this is expected to result in larger stopes and increased efficiency during design and extraction
Recent drilling success from the Austin 904 demonstrates the potential for discovery of additional high-grade lenses of gold mineralization in the main Austin Zone very similar to those that have already been delineated in the South Austin 4447 area during the 2025 campaign (see press releases for South Austin dated August 12, 2025, May 27, 2025 and February 26, 2025). It is anticipated that the 904 Complex will continue to be a primary focus of drilling at Madsen for the remainder of 2026 with initial production from this area expected in H1 2027.
AUSTIN 904 COMPLEX HIGHLIGHTS:
- Hole MM26D-13-4881-031 intersected 5.35m @ 215.46 g/t Au, from 135.10m to 140.45m, including 2.95m @ 388.90 g/t Au, from 136.00m to 138.95m. This intercept was complemented by multiple occurrences of visible gold spatially associated with quartz veining and strong silicification (Figure 1).
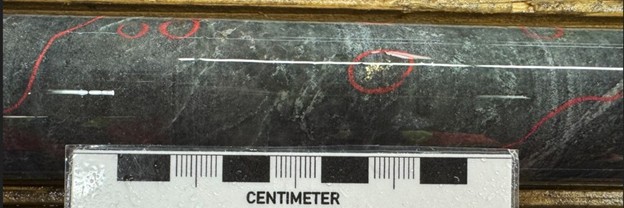
FIGURE 1. Visible gold showing in hole MM26D-13-4881-031 at 138.65m downhole depth.
- Hole MM26D-13-4881-034 intersected 4.05m @ 50.34 g/t Au, from 135.5m to 139.55m, including 0.5m @ 390.36 g/t Au, from 137.05m to 137.55m. This intercept was complemented by multiple occurrences of visible gold spatially associated with quartz veining and strong silicification (Figure 2).
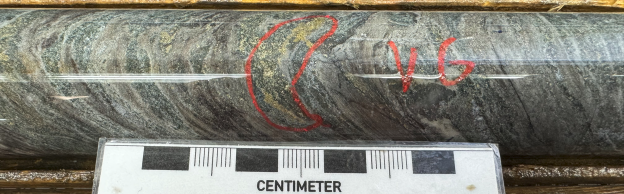
FIGURE 2. Visible gold showing in hole MM26D-13-4881-034 at 137.3m downhole depth.
- Hole MM26D-13-4881-018 intersected 3m @ 61.70 g/t Au, from 122.5m to 125.5m, including 0.5m @ 61.70 g/t Au, from 123.5m to 124.0m. This intercept was complemented by multiple occurrences of visible gold spatially associated with quartz veining and strong silicification (Figure 3). This hole also intersected 11m @ 4.09 g/t Au, from 100m to 111m, including 0.55m @ 28.56 g/t Au, from 100.95m to 101.50m.
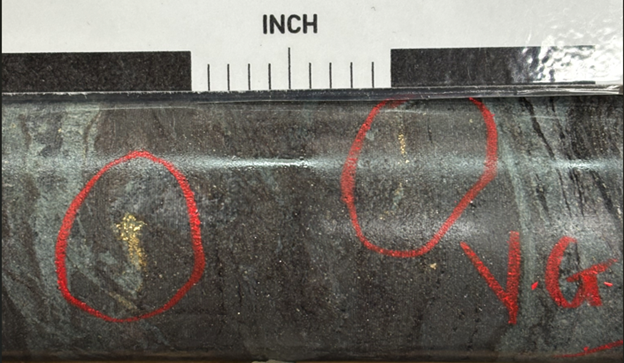
FIGURE 3. Visible gold showing in hole MM26D-13-4881-018 at 123.7m downhole depth.
- Hole MM26D-13-4881-026 intersected 8.65m @ 13.25 g/t Au, from 122.35m to 131.00m, including 0.95m @ 42.63 g/t Au, from 123.00m to 123.95m; also including 4m @ 17.64 g/t Au, from 125m to 129m.
- Hole MM26D-13-4881-010 intersected 7.05m @ 11.56 g/t Au, from 101.50m to 108.55m, including 0.5m @ 121.41 g/t Au, from 102.0m to 102.5m.
- Hole MM26D-13-4881-020 intersected 2m @ 34.35 g/t Au, from 101.75m to 103.75m, including 0.5m @ 126.05 g/t Au, from 102.25m to 102.75m. This intercept was complemented by a narrow band of visible gold spatially associated with quartz veining and strong silicification (Figure 4).
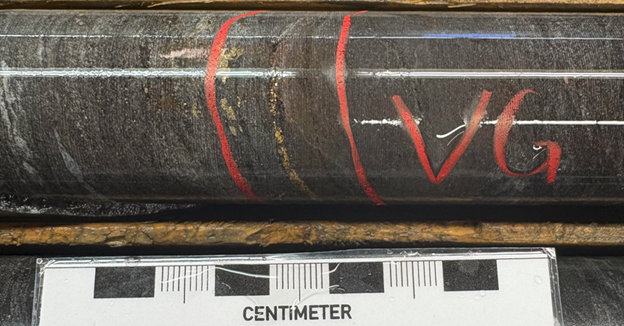
FIGURE 4. Visible gold showing in hole MM26D-13-4881-020 at 102.5m downhole depth.
- Hole MM26D-13-4881-015 intersected 12.35m @ 5.47 g/t Au, from 116.40m to 128.75m, including 2.3m @ 16.00 g/t Au, from 121.7m to 124.0m.
- Hole MM26D-13-4881-019 intersected 10.6m @ 4.87 g/t Au, from 101.15m to 111.75m, including 0.5m @ 25.71 g/t Au, from 102.5m to 103.0m; also including 1m @ 14.64 g/t Au, from 104m to 105m.
- Hole MM26D-13-4881-025 intersected 15.15m @ 3.35 g/t Au, from 120.55m to 135.70m, including 0.8m @ 29.28 g/t Au, from 123.45m to 124.25m.
TABLE 1. Significant intercepts (>3 g/t Au) from drilling at Austin 904 Complex.
| Hole ID | Target | From (m) | To (m) | Length (m)* | Au (g/t) |
| MM26D-13-4881-001 | Austin - 904 | 117.60 | 119.60 | 2.00 | 3.20 |
| MM26D-13-4881-002 | Austin - 904 | 105.25 | 111.00 | 5.75 | 5.04 |
| Incl. | 105.25 | 106.25 | 1.00 | 17.65 | |
| AND | Austin - 904 | 131.80 | 133.15 | 1.35 | 4.08 |
| MM26D-13-4881-003 | Austin - 904 | No Significant Assays > 3 g/t Au | |||
| MM26D-13-4881-004 | Austin - 904 | No Significant Assays > 3 g/t Au | |||
| MM26D-13-4881-005 | Austin - 904 | No Significant Assays > 3 g/t Au | |||
| MM26D-13-4881-006 | Austin - 904 | No Significant Assays > 3 g/t Au | |||
| MM26D-13-4881-007 | Austin - 904 | No Significant Assays > 3 g/t Au | |||
| MM26D-13-4881-008 | Austin - 904 | No Significant Assays > 3 g/t Au | |||
| MM26D-13-4881-009 | Austin - 904 | 75.30 | 76.30 | 1.00 | 9.04 |
| MM26D-13-4881-010 | Austin - 904 | 101.50 | 108.55 | 7.05 | 11.56 |
| Incl. | 102.00 | 102.50 | 0.50 | 121.41 | |
| AND | Austin - 904 | 154.50 | 155.50 | 1.00 | 7.57 |
| MM26D-13-4881-011 | Austin - 904 | 107.20 | 110.00 | 2.80 | 3.11 |
| MM26D-13-4881-012 | Austin - 904 | No Significant Assays > 3 g/t Au | |||
| MM26D-13-4881-013 | Austin - 904 | 111.50 | 113.60 | 2.10 | 5.37 |
| AND | Austin - 904 | 118.95 | 120.50 | 1.55 | 3.45 |
| AND | Austin - 904 | 120.50 | 121.00 | 0.50 | 3.62 |
| AND | Austin - 904 | 122.00 | 122.50 | 0.50 | 3.71 |
| AND | Austin - 904 | 124.35 | 126.50 | 2.15 | 3.66 |
| AND | Austin - 904 | 130.75 | 131.40 | 0.65 | 3.21 |
| MM26D-13-4881-014 | Austin - 904 | 117.00 | 117.50 | 0.50 | 3.83 |
| AND | Austin - 904 | 118.00 | 119.00 | 1.00 | 3.53 |
| AND | Austin - 904 | 120.50 | 123.00 | 2.50 | 3.84 |
| MM26D-13-4881-015 | Austin - 904 | 102.80 | 103.35 | 0.55 | 8.27 |
| AND | Austin - 904 | 116.40 | 128.75 | 12.35 | 5.47 |
| Incl. | 121.70 | 124.00 | 2.30 | 16.00 | |
| MM26D-13-4881-016 | Austin - 904 | 119.00 | 123.00 | 4.00 | 7.55 |
| Incl. | 120.20 | 121.00 | 0.80 | 29.88 | |
| AND | Austin - 904 | 125.70 | 128.00 | 2.30 | 4.39 |
| AND | Austin - 904 | 129.50 | 131.50 | 2.00 | 3.81 |
| MM26D-13-4881-017 | Austin - 904 | 128.10 | 128.60 | 0.50 | 3.39 |
| MM26D-13-4881-018 | Austin - 904 | 100.00 | 111.00 | 11.00 | 4.09 |
| Incl. | 100.95 | 101.50 | 0.55 | 28.56 | |
| AND | Austin - 904 | 122.50 | 125.50 | 3.00 | 61.70 |
| Incl. | 123.50 | 124.00 | 0.50 | 359.23 | |
| MM26D-13-4881-019 | Austin - 904 | 91.00 | 92.00 | 1.00 | 8.17 |
| AND | Austin - 904 | 101.15 | 111.75 | 10.60 | 4.87 |
| Incl. | 102.50 | 103.00 | 0.50 | 25.71 | |
| Also Incl. | 104.00 | 105.00 | 1.00 | 14.64 | |
| MM26D-13-4881-020 | Austin - 904 | 90.30 | 92.00 | 1.70 | 3.83 |
| AND | Austin - 904 | 101.75 | 103.75 | 2.00 | 34.35 |
| Incl. | 102.25 | 102.75 | 0.50 | 126.05 | |
| AND | Austin - 904 | 108.00 | 109.00 | 1.00 | 4.07 |
| AND | Austin - 904 | 114.50 | 115.50 | 1.00 | 3.04 |
| AND | Austin - 904 | 117.00 | 118.05 | 1.05 | 3.41 |
| AND | Austin - 904 | 124.00 | 126.10 | 2.10 | 12.51 |
| Incl. | 125.60 | 126.10 | 0.50 | 50.23 | |
| MM26D-13-4881-021 | Austin - 904 | No Significant Assays > 3 g/t Au | |||
| MM26D-13-4881-022 | Austin - 904 | 115.00 | 122.40 | 7.40 | 4.32 |
| Incl. | 119.65 | 120.90 | 1.25 | 17.18 | |
| MM26D-13-4881-023 | Austin - 904 | No Significant Assays > 3 g/t Au | |||
| MM26D-13-4881-024 | Austin - 904 | No Significant Assays > 3 g/t Au | |||
| MM26D-13-4881-025 | Austin - 904 | 120.55 | 135.70 | 15.15 | 3.35 |
| Incl. | 123.45 | 124.25 | 0.80 | 29.28 | |
| MM26D-13-4881-026 | Austin - 904 | 90.00 | 92.00 | 2.00 | 7.40 |
| AND | Austin - 904 | 122.35 | 131.00 | 8.65 | 13.25 |
| Incl. | 123.00 | 123.95 | 0.95 | 42.63 | |
| Also Incl. | 125.00 | 129.00 | 4.00 | 17.63 | |
| MM26D-13-4881-027 | Austin - 904 | No Significant Assays > 3 g/t Au | |||
| MM26D-13-4881-028 | Austin - 904 | 130.85 | 133.55 | 2.70 | 3.16 |
| AND | Austin - 904 | 150.20 | 152.70 | 2.50 | 3.23 |
| MM26D-13-4881-029 | Austin - 904 | No Significant Assays > 3 g/t Au | |||
| MM26D-13-4881-030 | Austin - 904 | 92.65 | 96.10 | 3.45 | 5.76 |
| MM26D-13-4881-031 | Austin - 904 | 135.10 | 140.45 | 5.35 | 215.46 |
| Incl. | 136.00 | 138.95 | 2.95 | 388.90 | |
| MM26D-13-4881-032 | Austin - 904 | 120.70 | 121.20 | 0.50 | 3.72 |
| AND | Austin - 904 | 129.35 | 130.35 | 1.00 | 3.63 |
| AND | Austin - 904 | 134.50 | 136.00 | 1.50 | 3.60 |
| MM26D-13-4881-033 | Austin - 904 | 111.75 | 116.25 | 4.50 | 3.58 |
| Incl. | 112.90 | 113.75 | 0.85 | 10.63 | |
| MM26D-13-4881-034 | Austin - 904 | 119.00 | 123.30 | 4.30 | 3.43 |
| AND | Austin - 904 | 135.50 | 139.55 | 4.05 | 50.34 |
| Incl. | 137.05 | 137.55 | 0.50 | 390.36 | |
*The "From-To" intervals in Table 1 are denoting overall downhole length of the intercept. The gold assay results presented are uncapped values. True thickness has not been calculated for these intercepts but is expected to be = 70% of downhole length based on intercept angles observed in the drill core. Internal dilution for composite intervals does not exceed 1m for samples grading <0.1 g/t Au.
TABLE 2: Drill collar summary for holes reported in this News Release.
| Hole ID | Target | Easting | Northing | Elev (m) | Length (m) | Azimuth | Dip |
| MM26D-13-4881-001 | Austin - 904 | 435845 | 5646750 | -212 | 119.6 | 127 | -6 |
| MM26D-13-4881-002 | Austin - 904 | 435845 | 5646750 | -212 | 150.0 | 127 | 1 |
| MM26D-13-4881-003 | Austin - 904 | 435846 | 5646751 | -212 | 103.2 | 129 | 6 |
| MM26D-13-4881-004 | Austin - 904 | 435845 | 5646750 | -212 | 147.0 | 129 | -1 |
| MM26D-13-4881-005 | Austin - 904 | 435846 | 5646752 | -212 | 115.3 | 129 | -4 |
| MM26D-13-4881-006 | Austin - 904 | 435845 | 5646750 | -211 | 107.1 | 133 | 6 |
| MM26D-13-4881-007 | Austin - 904 | 435845 | 5646750 | -211 | 107.3 | 135 | 9 |
| MM26D-13-4881-008 | Austin - 904 | 435845 | 5646750 | -211 | 110.7 | 138 | 6 |
| MM26D-13-4881-009 | Austin - 904 | 435845 | 5646750 | -211 | 113.3 | 141 | 9 |
| MM26D-13-4881-010 | Austin - 904 | 435846 | 5646752 | -211 | 165.0 | 109 | 6 |
| MM26D-13-4881-011 | Austin - 904 | 435846 | 5646752 | -212 | 150.0 | 109 | 1 |
| MM26D-13-4881-012 | Austin - 904 | 435846 | 5646752 | -212 | 111.8 | 109 | -6 |
| MM26D-13-4881-013 | Austin - 904 | 435846 | 5646752 | -212 | 150.0 | 112 | -6 |
| MM26D-13-4881-014 | Austin - 904 | 435846 | 5646751 | -212 | 150.0 | 115 | -5 |
| MM26D-13-4881-015 | Austin - 904 | 435846 | 5646752 | -212 | 150.0 | 118 | -4 |
| MM26D-13-4881-016 | Austin - 904 | 435846 | 5646752 | -212 | 150.0 | 120 | -6 |
| MM26D-13-4881-017 | Austin - 904 | 435846 | 5646751 | -212 | 150.0 | 124 | -5 |
| MM26D-13-4881-018 | Austin - 904 | 435846 | 5646752 | -211 | 150.0 | 112 | 5 |
| MM26D-13-4881-019 | Austin - 904 | 435846 | 5646752 | -211 | 150.0 | 114 | 2 |
| MM26D-13-4881-020 | Austin - 904 | 435846 | 5646752 | -211 | 150.0 | 117 | 2 |
| MM26D-13-4881-021 | Austin - 904 | 435845 | 5646750 | -211 | 101.2 | 125 | 6 |
| MM26D-13-4881-022 | Austin - 904 | 435845 | 5646750 | -211 | 144.0 | 124 | 3 |
| MM26D-13-4881-023 | Austin - 904 | 435845 | 5646751 | -212 | 112.5 | 117 | -7 |
| MM26D-13-4881-024 | Austin - 904 | 435845 | 5646751 | -212 | 70.4 | 108 | -11 |
| MM26D-13-4881-025 | Austin - 904 | 435845 | 5646750 | -212 | 156.0 | 126 | -11 |
| MM26D-13-4881-026 | Austin - 904 | 435845 | 5646750 | -212 | 150.0 | 130 | -12 |
| MM26D-13-4881-027 | Austin - 904 | 435845 | 5646750 | -212 | 150.0 | 134 | -11 |
| MM26D-13-4881-028 | Austin - 904 | 435845 | 5646750 | -212 | 156.0 | 141 | -10 |
| MM26D-13-4881-029 | Austin - 904 | 435845 | 5646751 | -212 | 164.2 | 129 | -17 |
| MM26D-13-4881-030 | Austin - 904 | 435845 | 5646750 | -212 | 156.0 | 124 | -16 |
| MM26D-13-4881-031 | Austin - 904 | 435845 | 5646750 | -212 | 162.0 | 124 | -18 |
| MM26D-13-4881-032 | Austin - 904 | 435846 | 5646751 | -212 | 139.0 | 113 | -4 |
| MM26D-13-4881-033 | Austin - 904 | 435845 | 5646751 | -212 | 144.0 | 107 | -4 |
| MM26D-13-4881-034 | Austin - 904 | 435845 | 5646751 | -212 | 150.0 | 108 | -10 |
DISCUSSION
Like the other mineralized domains that comprise the Madsen Mine, the Austin structures are hosted within broad, kilometre-scale planar alteration and deformation corridors that have been repeatedly reactivated during gold mineralization and subsequent deformation and metamorphism.
At the deposit scale the Austin, South Austin, North Austin, and McVeigh Zones are locally folded and structurally dismembered by transposition and rotation into the penetrative S2 Foliation. In addition to this intense deformation overprint, the mineralized veins and alteration have been subjected to the relatively high temperatures of amphibolite facies metamorphism, which led to extensive recrystallization and growth of the skarn-like replacement mineral assemblage of diopside-amphibole-quartz-biotite.
All significant gold mineralization on the mine property is demonstrably early relative to the most significant, penetrative deformation (D2) and metamorphic events. The North Austin Zone displays 'mine-style' alteration and mineralization and consists of multiple mineralized domains defined over a strike length of 0.5km. Mineralization remains open at depth and along strike to the northeast.
In drill core, or at underground face exposures, gold-bearing zones at the Madsen Mine are best identified visually by fine (sub-millimetre) grains of free gold within strong alteration and veining. All high-grade intervals generally contain visible gold on drill core exteriors, although numerous examples exist of high-grade assays where visible gold was only identified within the interior (cut surface) of the core samples. Apart from the presence of free gold, pervasive silicification (locally accompanied by discrete quartz veining) and quartz-carbonate or diopside veining are the best indicators that a given interval is within a high-grade zone along/within the mineralized structure.
The current underground drilling program at the Madsen Mine is focused on further definition of near-term mining inventory, as well as growth of the current mineral resource. Drilling has been focused on the more continuous and higher-grade portions of the Austin and South Austin Zones. It is anticipated that this will continue to be the strategy through 2026.
High resolution versions of all the figures contained in this press release can be found at the following web link: WRLG - News Release April 13 2026 - Figures.
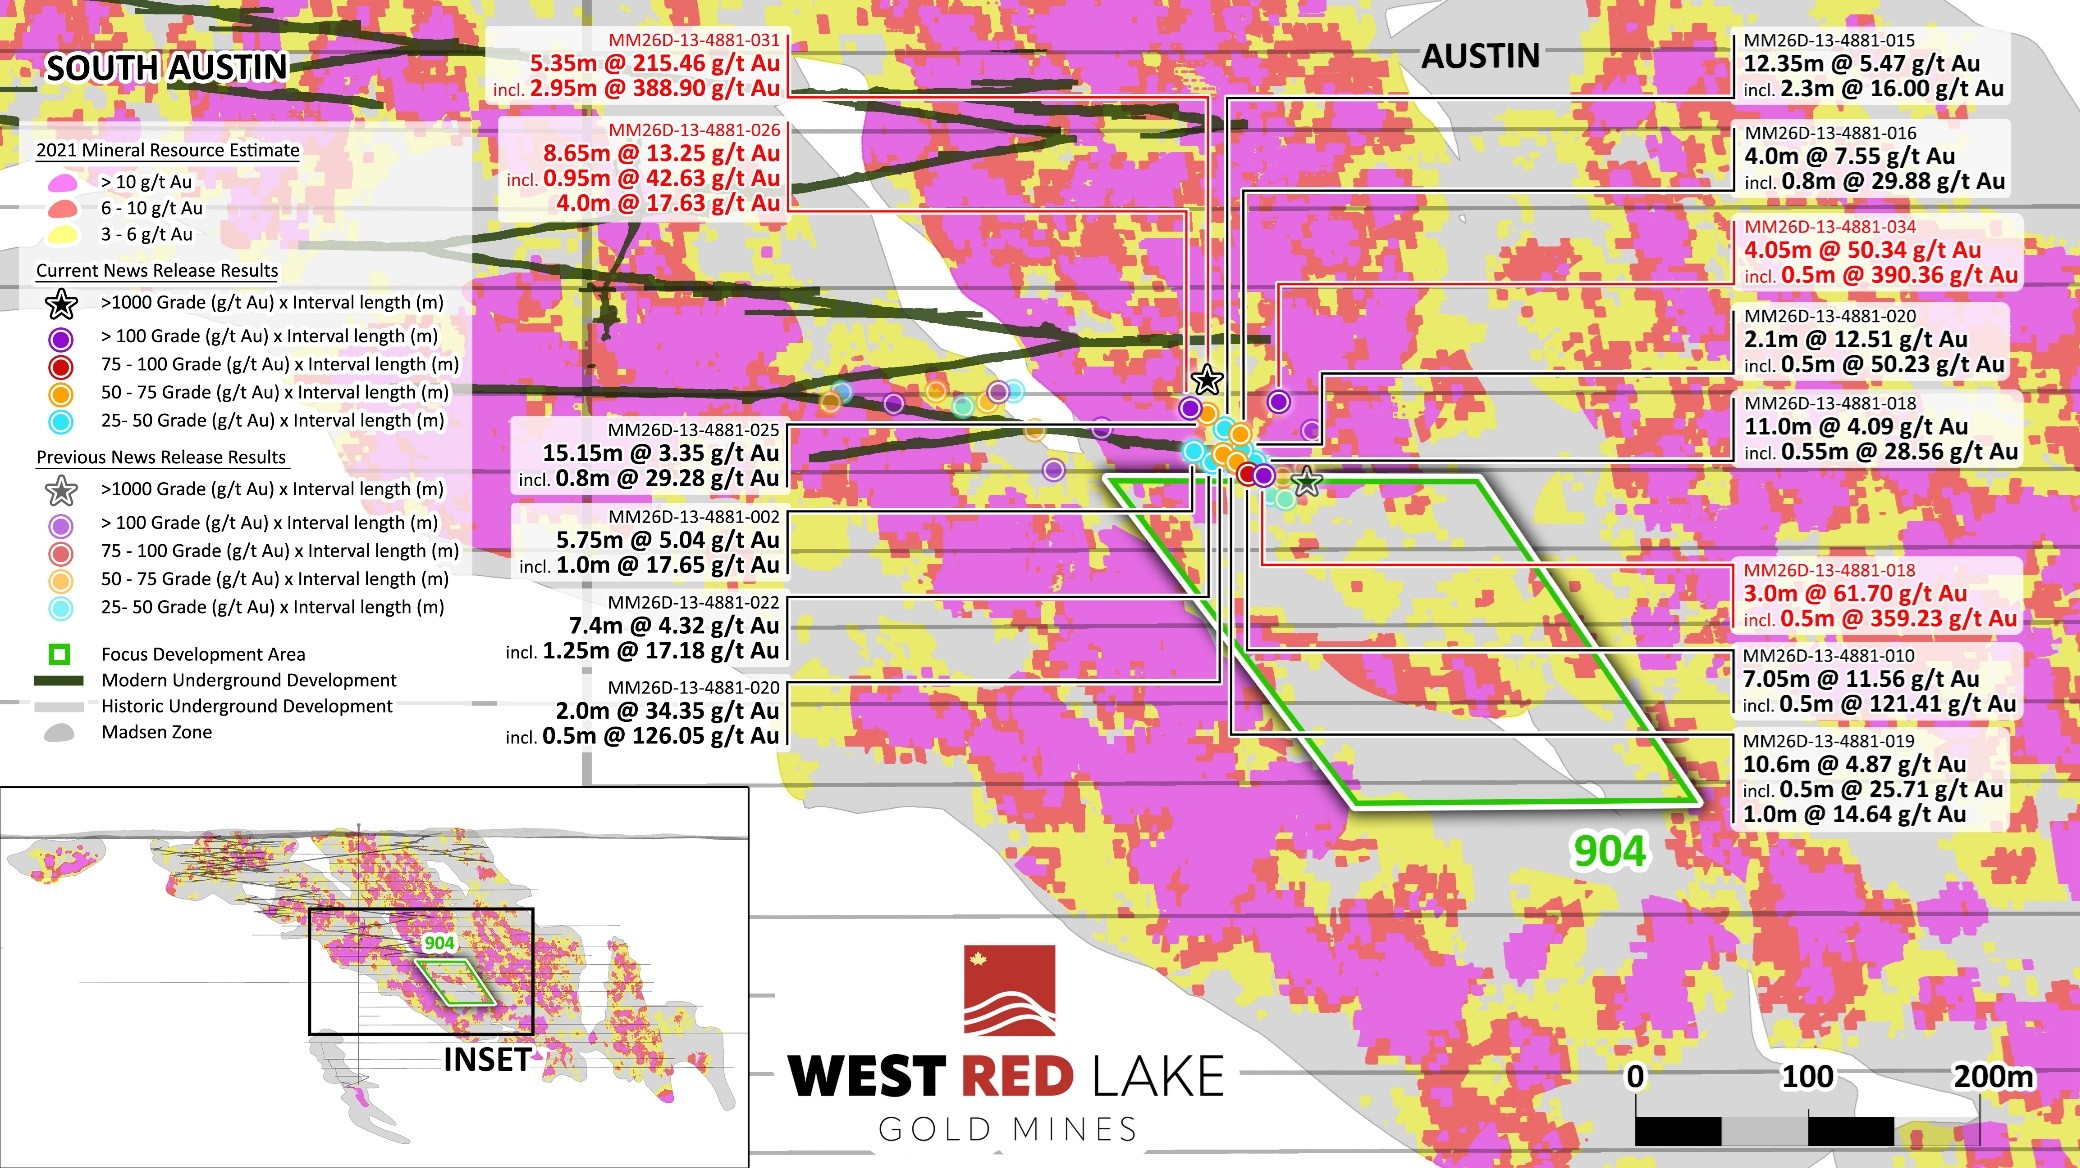
FIGURE 5. Long Section showing drill highlights from current press release in Austin 904 Complex with (grade x thickness) at = 25 (g/t Au x m). Interval length denotes downhole core length. True thickness has not been calculated, but is expected to be = 70% of downhole length based on intercept angles observed in the drill core.2
QUALITY ASSURANCE/QUALITY CONTROL
Drilling completed underground at the Madsen Mine consists of BQ-sized diamond drill core for definition drill programs and oriented NQ-sized diamond drill core for exploration focused drilling. All drill holes are systematically logged, photographed, and sampled by a trained geologist at the Madsen Mine core processing facility. Minimum allowable sample length is 0.5m. Maximum allowable sample length is 1.5m. Control samples (certified standards and uncertified blanks), along duplicates, are inserted at a target 5% insertion rate. Results are assessed for accuracy, precision, and contamination on an ongoing basis. The BQ-sized drill core is whole core sampled. The NQ-sized drill core is then cut lengthwise utilizing a diamond blade core saw along a line pre-selected by the geologist. To reduce sampling bias, the same side of drill core is sampled consistently utilizing the orientation line as reference. For those samples containing visible gold ("VG"), a trained geologist supervises the cutting/bagging of those samples, and ensures the core saw blade is 'cleaned' with a dressing stone following the VG sample interval. Bagged samples are then sealed with zip ties and transported by Madsen Mine personnel directly to SGS Natural Resources' Facility in Red Lake, Ontario for assay.
Samples are then prepped by SGS, which consists of drying at 105°C and crushing to 75% passing 2mm. A riffle splitter is then utilized to produce a 500g course reject for archive. The remainder of the sample is then pulverized to 85% passing 75 microns from which 50g is analyzed by fire assay and an atomic absorption spectroscopy (AAS) finish (SGS Code GO-FAA50V10). Samples returning gold values > 100 g/t Au are reanalyzed by fire assay with a gravimetric finish on a 50g sample (SGS Code GO_FAG50V). Samples with visible gold are also analyzed via metallic screen analysis (SGS code: GO_FAS50M). For multi-element analysis, samples are sent to SGS's facility in Burnaby, British Columbia and analyzed via four-acid digest with an atomic emission spectroscopy (ICP-AES) finish for 33-element analysis on 0.25g sample pulps (SGS code: GE_ICP40Q12). SGS Natural Resources analytical laboratories operate under a Quality Management System that complies with ISO/IEC 17025.
The Madsen Mine deposit presently hosts a National Instrument 43-101 - Standards of Disclosure for Mineral Projects ("NI 43-101") Indicated resource of 1.65 million ounces ("Moz") of gold grading 7.4 g/t Au within 6.9 Mt, and an Inferred resource of 0.37 Moz of gold grading 6.3 g/t Au within 1.8 Mt. Mineral resources are estimated at a cut-off grade of 3.38 g/t Au and a gold price of US$1,800/oz. Mineral resources as stated are inclusive of mineral reserves. Mineral resources that are not mineral reserves do not have demonstrated economic viability. The Madsen Mine also contains Probable reserves of 478 thousand ounces ("koz") of gold grading 8.16 g/t Au within 1.87 Mt. Mineral reserve estimates are based on a gold price of US$1,680/oz. Please refer to the Madsen Report. The Madsen Resource Estimate has an effective date of December 31, 2021, and excludes depletion of mining activity during the period from January 1, 2022, to the mine closure on October 24, 2022, as it has been deemed immaterial and not relevant for the purpose of the Madsen Report. A full copy of the Madsen Report is available on the Company's website and on SEDAR+ at www.sedarplus.ca.
The technical information presented in this news release has been reviewed and approved by Will Robinson, P.Geo., Vice President of Exploration for West Red Lake Gold and the Qualified Person for exploration at the West Red Lake Project, as defined by NI 43-101.
ABOUT WEST RED LAKE GOLD MINES
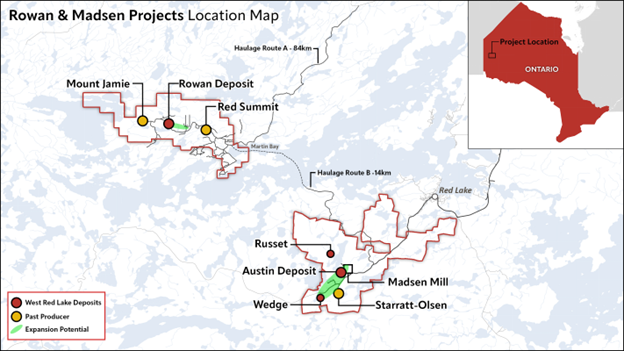
West Red Lake Gold Mines Ltd. is a mineral exploration company that is publicly traded and focused on advancing and developing its flagship Madsen Gold Mine and the associated 47 km2 highly prospective land package in the Red Lake district of Ontario. The highly productive Red Lake Gold District of Northwest Ontario, Canada has yielded over 20 million ounces of gold from high-grade zones and hosts some of the world's richest gold deposits3. WRLG also holds the wholly owned Rowan Property in Red Lake, with an expansive property position covering 31 km2 including three past producing gold mines - Rowan, Mount Jamie, and Red Summit.
ON BEHALF OF WEST RED LAKE GOLD MINES LTD.
"Shane Williams"
Shane Williams
President & Chief Executive Officer
FOR FURTHER INFORMATION, PLEASE CONTACT:
Jaclyn Ruptash
V.P. Corporate Communications and Investor Relations
Tel: (604) 805-0902
Email: investors@wrlgold.com or visit the Company's website at https://www.westredlakegold.com
Neither the TSX Venture Exchange nor its Regulation Services Provider (as that term is defined in the policies of the TSX Venture Exchange) accepts responsibility for the adequacy or accuracy of this release.
CAUTIONARY STATEMENT AND FORWARD-LOOKING INFORMATION
Certain statements contained in this news release may constitute "forward-looking information" within the meaning of applicable securities laws. Forward-looking information generally can be identified by words such as "anticipate", "expect", "estimate", "forecast", "planned", and similar expressions suggesting future outcomes or events. Forward-looking information is based on current expectations of management; however, it is subject to known and unknown risks, uncertainties and other factors that may cause actual results to differ materially from the forward-looking information in this news release and include without limitation, statements relating to the anticipated impact of the drilling results on actual production at the Madsen Mine; the expectations of results in larger stopes and efficiency at the Madsen Mine; the potential production of mining operations at the Madsen Mine; the further anticipated drilling to occur at Madsen for the remainder of 2026; any untapped growth potential in the Madsen deposit; and the Company's future objectives and plans. Readers are cautioned not to place undue reliance on forward-looking information.
Forward-looking information involves numerous risks and uncertainties and actual results might differ materially from results suggested in any forward-looking information. These risks and uncertainties include, among other things, market volatility; the state of the financial markets for the Company's securities; fluctuations in commodity prices; and changes in the Company's business plans. Forward-looking information is based on a number of key expectations and assumptions, including without limitation, that the Company will continue with its stated business objectives and its ability to raise additional capital to proceed. Although management of the Company has attempted to identify important factors that could cause actual results to differ materially from those contained in forward-looking information, there may be other factors that cause results not to be as anticipated, estimated or intended. There can be no assurance that such forward-looking information will prove to be accurate, as actual results and future events could differ materially from those anticipated in such forward-looking information. Accordingly, readers should not place undue reliance on forward-looking information. Readers are cautioned that reliance on such information may not be appropriate for other purposes. Additional information about risks and uncertainties is contained in the Company's management's discussion and analysis for the year ended December 31, 2024, and the Company's annual information form for the year ended December 31, 2024, copies of which are available on SEDAR+ at www.sedarplus.ca.
The forward-looking information contained herein is expressly qualified in its entirety by this cautionary statement. Forward-looking information reflects management's current beliefs and is based on information currently available to the Company. The forward-looking information is made as of the date of this news release and the Company assumes no obligation to update or revise such information to reflect new events or circumstances, except as may be required by applicable law.
For more information on the Company, investors should review the Company's continuous disclosure filings that are available on SEDAR+ at www.sedarplus.ca.
_____________________________________
1 Twomey, T. and McGibbon, S. Red Lake Mine, Goldcorp Inc. (2022). "The Geological Setting and Estimation of Gold Grade of the High-Grade Zone, Red Lake Mine." Exploration Mining Geology, Vol. 10, Nos. 1-2, pp. 19-34. Canadian Institute of Mining, Metallurgy and Petroleum ("CIM"). Reference to the High-Grade Zone as described by Twomey and McGibbon is only provided as historical comparison and should not be relied upon to indicate or suggest resource size potential or quality of mineralization at Madsen.
2 Mineral resources are estimated at a cut-off grade of 3.38 g/t Au and a gold price of US1,800/oz. Please refer to the technical report entitled "NI 43-101 Technical Report and Prefeasibility Study for the Madsen Mine, Ontario, Canada", prepared by SRK Consulting (Canada) Inc. and dated January 7, 2025 (the "Madsen Report"). A full copy of the Madsen Report is available on the Company's website and on SEDAR+ at www.sedarplus.ca.
3 Twomey, T. and McGibbon, S. Red Lake Mine, Goldcorp Inc. (2022). "The Geological Setting and Estimation of Gold Grade of the High-Grade Zone, Red Lake Mine." Exploration Mining Geology, Vol. 10, Nos. 1-2, pp. 19-34. Canadian Institute of Mining, Metallurgy and Petroleum ("CIM"). Reference to the High-Grade Zone as described by Twomey and McGibbon is only provided as historical comparison and should not be relied upon to indicate or suggest resource size potential or quality of mineralization at Madsen-
Photos accompanying this announcement are available at
https://www.globenewswire.com/NewsRoom/AttachmentNg/7126be4d-64d0-4490-a3c0-19322adcbe71
https://www.globenewswire.com/NewsRoom/AttachmentNg/846e7142-6f3b-4042-8530-62ed60e0159c
https://www.globenewswire.com/NewsRoom/AttachmentNg/52278414-049b-4b2a-938f-7209be71cf06
https://www.globenewswire.com/NewsRoom/AttachmentNg/70446f11-fb8c-4be9-b9ee-4a6e4202739a
https://www.globenewswire.com/NewsRoom/AttachmentNg/4f4a86f9-31de-442a-b2ec-4b378ec5ce3d
https://www.globenewswire.com/NewsRoom/AttachmentNg/6964afba-a537-4044-a119-0fe2009e7f4a

