
QPR SOFTWARE PLC STOCK EXCHANGE RELEASE 14 August 2026, AT 9.00 AM EEST
QPR Software Plc Half-Year Report January-June 2026: Revenue increased by 7% and software revenue by 19%, SaaS revenue decreased by 3%. Profitability and cash flow from operating activities improved significantly, and QPR secured a major new public sector customer in North America.
FINANCIAL DEVELOPMENT BRIEFLY
APRIL-JUNE 2026
- SaaS revenue decreased by 10%.
- QPR ProcessAnalyzer SaaS revenue decreased year-on-year due to the termination of a single customer contract. Development in the rest of the customer base was positive.
- Software revenue decreased by 7%. The decrease was mainly due to lower renewable license and maintenance revenue, as well as the termination of a few SaaS customer contracts. Revenue from perpetual licenses, however, increased.
- The sale of regional intellectual property rights to the QPR Metrics software to Leaders Solutions affects the comparability of net sales: the comparison period included license and maintenance net sales related to the transaction, which are no longer recognized in 2026.
- Revenue amounted to EUR 1,146 thousand, a decrease of 17% from the comparison period (1,382).
- EBITDA was EUR 19 thousand (-223), improving by EUR 241 thousand from the comparison period.
- Operating result was EUR -164 thousand (-469), improving by EUR 304 thousand from the comparison period.
- Result before taxes was EUR -174 thousand (-489), improving by EUR 314 thousand from the comparison period.
- Result for the review period was EUR -174 thousand (-454), improving by EUR 280 thousand from the comparison period.
- Earnings per share were EUR -0.009 (-0.023).
- Cash flow from operating activities was EUR -229 thousand (-779), improving by EUR 550 thousand from the comparison period.
JANUARY-JUNE 2026
- SaaS revenue decreased by 3%.
- QPR ProcessAnalyzer SaaS revenue decreased year-on-year due to the termination of a single customer contract. Development in the rest of the customer base was positive.
- Software revenue increased by 19%, mainly due to the sale of regional intellectual property rights to the QPR Metrics software completed during the first quarter.
- The sale of regional intellectual property rights to the QPR Metrics software to Leaders Solutions affects the comparability of net sales: one-off software net sales from the transaction were recognized in the first quarter of 2026, while the comparison period included license and maintenance net sales related to the transaction, which are no longer recognized in 2026.
- Revenue amounted to EUR 3,093 thousand (2,901), an increase of 7% from the comparison period.
- EBITDA was EUR 533 thousand (-216), improving by EUR 749 thousand from the comparison period.
- Operating result was EUR 170 thousand (-710), improving by EUR 880 thousand from the comparison period.
- Result before taxes was EUR 146 thousand (-749), improving by EUR 895 thousand from the comparison period.
- Result for the review period was EUR 146 thousand (-720), improving by EUR 866 thousand from the comparison period.
- Earnings per share were EUR 0.007 (-0.037).
- Cash flow from operating activities was EUR 1,122 thousand (-557), improving by EUR 1,679 thousand from the comparison period.
OUTLOOK FOR 2026 (Updated on 4 August 2026)
Based on the current contract portfolio and market outlook, the company estimates that its SaaS revenue for the 2026 financial year will be lower than in the previous financial year. The company estimates that SaaS revenue from QPR ProcessAnalyzer will remain at the level of the previous financial year.
The company expects EBITDA to be positive and higher than in the previous financial year.
Due to the nature of the business and long sales cycles, quarterly variations may be significant.
The company expects its operating environment to vary by region during the 2026 financial year, with economic growth forecast to remain moderate in several markets. Geopolitical tensions, trade policy risks, and political uncertainty increase uncertainty in the international business environment.
CEO REVIEW
Business development
During the second quarter of 2026, we continued to sharpen our commercial focus, strengthen our partner network, and further develop QPR ProcessAnalyzer as an integral part of organizations' AI and automation initiatives.
The market environment remained challenging, and customer decision-making continued to be slow. The process intelligence market is highly competitive, with several large international technology companies operating in the field. Net sales decreased year-on-year, but our profitability improved significantly as a result of changes in our cost structure and increased operational efficiency. Our key growth metric, QPR ProcessAnalyzer SaaS net sales, declined year-on-year due to a previous customer churn, but increased compared to the previous quarter.
At the same time, we continued to build the foundations for future growth. During the review period, we secured, among other things, a significant new customer in North America, established new partnerships, and made further progress in bringing process intelligence into the use of AI agents.
Development of the partner network and commercial model
We continued to strengthen our partner network and entered into new cooperation agreements in Europe and North America. Through these partnerships, we are expanding our local sales and delivery capabilities and supporting the adoption of QPR ProcessAnalyzer across different industries and markets.
In June, one of the largest public sector organizations in the United States selected QPR ProcessAnalyzer to analyze and improve its high-volume core processes. The implementation will be carried out together with our North American partner, Cognitio Analytics. The agreement represents an important customer reference for us and provides concrete evidence of the potential of our partner-led operating model.
We also launched an operating model that combines the process intelligence, ready-made integrations, and AI capabilities of QPR ProcessAnalyzer with our partners' industry and process expertise. Our aim is to develop repeatable and scalable solutions for selected industries and use cases.
Snowflake and development of AI capabilities
The Snowflake-native implementation is a key part of the technological positioning and commercial model of QPR ProcessAnalyzer. The solution runs directly within the customer's own Snowflake environment without unnecessary data movement or replication. This supports scalability, data governance, and security, while enabling process intelligence to be integrated directly into customers' data and AI architectures.
The MCP interface we announced in April has received a promising response. The capability is already in use by several customers, and discussions regarding its adoption are currently ongoing with new customer organizations as well. It enables AI agents to utilize customers' process data and answer natural-language questions about, for example, process flows, deviations, and bottlenecks.
QPR ProcessAnalyzer serves as a source of the operational context required by AI, bringing the reality of how an organization operates into AI-driven decision-making. We see process intelligence as a critical component of enterprise AI infrastructure and of the governed and scalable adoption of AI.
Market position and customer collaboration
In May, QPR Software was named a Visionary for the fourth consecutive year in the 2026 Gartner® Magic Quadrant for Process Intelligence Platforms. In the accompanying Gartner® Critical Capabilities for Process Intelligence Platforms assessment, QPR ranked second globally in the Process Mining Use Case. We believe these recognitions demonstrate the strong technological competitiveness of QPR ProcessAnalyzer and support our customers' technology decisions, our sales efforts, and the development of our partnerships.
In June, we organized the QPR Summit customer and partner event, which was one of the largest in QPR's history in terms of participation. At the event, our customers shared practical experiences of using process intelligence, data, and AI, while QPR presented its latest innovations. The strong participation and discussions during the event demonstrated growing interest in combining process intelligence and AI.
Priorities for the remainder of the year
During the remainder of the year, we will focus on driving new sales, developing customer relationships, and strengthening our partner-led commercial model. At the same time, we will continue to improve our cost efficiency and develop QPR ProcessAnalyzer, particularly in the areas of AI capabilities, product enhancements that support customer value, and opportunities offered by the Snowflake ecosystem.
The market environment and customer decision-making remain uncertain, and long sales cycles may cause significant variation between quarters. However, new customer wins, a strengthened partner network, and growing interest in combining process intelligence and AI support the execution of our strategy.
I would like to thank our customers and partners for their trust and strong cooperation. I would also like to thank our shareholders for their continued support and our employees for their commitment, expertise, and determined work in developing the company.
Matti Erkheikki
Chief Executive Officer
KEY FIGURES
| EUR in thousands, unless otherwise indicated | April-June, 2026 | April-June, 2025 | Change, % | Jan-June, 2026 | Jan-June, 2025 | Change, % | Jan-Dec, 2025 |
| Net sales | 1,146 | 1,382 | -17 | 3,093 | 2,901 | 7 | 5,619 |
| EBITDA | 19 | -223 | 108 | 533 | -216 | 347 | 75 |
| % of net sales | 1.7 | -16.1 | 17.2 | -7.4 | 1.3 | ||
| Operating result | -164 | -469 | 65 | 170 | -710 | 124 | -813 |
| % of net sales | -14.3 | -33.9 | 5.5 | -24.5 | -14.5 | ||
| Result before tax | -174 | -489 | 64 | 146 | -749 | 120 | -862 |
| Result for the period | -174 | -454 | 62 | 146 | -720 | 120 | -1,050 |
| % of net sales | -15.2 | -32.8 | 4.7 | -24.8 | -18.7 | ||
| Earnings per share, EUR (basic and diluted) | -0.009 | -0.023 | 62 | 0.007 | -0.037 | 120 | -0.054 |
| Equity per share, EUR | 0.071 | 0.071 | 0 | 0.071 | 0.071 | -1 | 0.060 |
| Cash flow from operating activities | -229 | -779 | 71 | 1,122 | -557 | 301 | -855 |
| Cash and cash equivalents | 1,403 | 1,180 | 19 | 1,403 | 1,180 | 19 | 621 |
| Net borrowings | -802 | -295 | -172 | -802 | -295 | -172 | 248 |
| Gearing, % | -57.6 | -21.0 | -174 | -57.6 | -21.0 | -174 | 21.0 |
| Equity ratio, % | 48.2 | 36.9 | 31 | 48.2 | 36.9 | 31 | 26.5 |
| Return on equity, % | -47.8 | -113.1 | 58 | 22.7 | -159.8 | 114 | -132.8 |
| Return on investment, % | -33.8 | -91.7 | 63 | 14.4 | -74.2 | 119 | -51.9 |
REPORTING AND BUSINESS OPERATIONS
QPR Software Plc develops and delivers solutions for analysing, monitoring, modelling and improving business processes. The company's solutions are based on process intelligence, process mining and Digital Twin of an Organization (DTO) technology.
QPR develops and delivers software that enables organisations to analyse, monitor and model their operations. The company also provides consulting services to support customers in utilising the software and the related methodologies.
QPR reports one business segment, Organisational Development. In addition, the company presents its revenue divided into the following categories: software licences, renewable software licences, software maintenance services, SaaS (Software as a Service) and consulting.
The recurring revenue reported by the company consists of SaaS revenue and revenue from renewable software licences and software maintenance services.
Software licences are sold to customers either for an unlimited period or for a predetermined fixed term. Renewable software licences grant customers the right to use the software under an agreement valid until further notice. The agreement is renewed at the end of the service period, typically one year, unless terminated in accordance with the contractual notice period. Licence revenue is recognised at a point in time at the beginning of the invoicing period, but no earlier than upon delivery of the licence. Revenue from SaaS and maintenance services is recognised monthly over the contract period as recurring revenue.
The geographical regions reported by the company are Finland, the rest of Europe, including Turkey, and the rest of the world. Revenue is allocated to geographical regions based on the location of the customer's headquarters.
NET SALES DEVELOPMENT
NET SALES BY PRODUCT GROUP
| EUR in thousands | April-June, 2026 | April-June, 2025 | Change, % | Jan-June, 2026 | Jan-June, 2025 | Change, % | Jan-Dec, 2025 |
| Software licenses | 77 | 27 | 191 | 744 | 106 | 605 | 334 |
| Renewable software licenses | 35 | 43 | -19 | 229 | 212 | 8 | 314 |
| Software maintenance services | 275 | 326 | -16 | 558 | 715 | -22 | 1,330 |
| SaaS | 644 | 713 | -10 | 1,318 | 1,365 | -3 | 2,769 |
| Consulting | 114 | 274 | -58 | 245 | 503 | -51 | 873 |
| Total | 1,146 | 1,382 | -17 | 3,093 | 2,901 | 7 | 5,619 |
NET SALES BY GEOGRAPHIC AREA
| EUR in thousands | April-June, 2026 | April-June, 2025 | Change, % | Jan-June, 2026 | Jan-June, 2025 | Change, % | Jan-Dec, 2025 |
| Finland | 414 | 563 | -27 | 952 | 1,148 | -17 | 2,179 |
| Europe incl. Turkey | 535 | 637 | -16 | 1,114 | 1,343 | -17 | 2,668 |
| Rest of the world | 197 | 181 | 8 | 1,027 | 410 | 150 | 773 |
| Total | 1,146 | 1,382 | -17 | 3,093 | 2,901 | 7 | 5,619 |
APRIL-JUNE 2026
Net sales for April-June amounted to EUR 1,146 thousand (1,382), representing a decrease of 17% from the comparison period. The decline in net sales was particularly affected by lower consulting net sales, renewable software license net sales and maintenance net sales, as well as the termination of a few SaaS customer contracts. Recurring net sales accounted for 83% (78) of total net sales.
SaaS net sales, which are at the core of the company's strategy, decreased by 10% to EUR 644 thousand (713). The termination of a few SaaS customer contracts had a negative impact on SaaS net sales during the second quarter. QPR ProcessAnalyzer SaaS net sales decreased from the comparison period due to the termination of a single customer contract, while development in the rest of the customer base was positive. SaaS net sales from the company's legacy software products also decreased from the comparison period.
Software net sales decreased by 7% from the comparison period. Software license net sales amounted to EUR 77 thousand (27), representing an increase of 191% from the comparison period. The increase was driven by new customer acquisition.
Renewable software license net sales amounted to EUR 35 thousand (43), representing a decrease of 19% from the comparison period. The decrease was affected by the partial termination of license agreements with certain customers.
Software maintenance service net sales amounted to EUR 275 thousand (326). Net sales were negatively affected in particular by the transition of a few customers to the SaaS business model and the termination of certain customer relationships.
Consulting net sales amounted to EUR 114 thousand (274), representing a decrease of 58% from the comparison period. Consulting resources have been reduced partly as a result of the sale of regional intellectual property rights to the QPR Metrics software.
Of the Group's net sales, 36% (41) were generated in Finland, 47% (46) elsewhere in Europe, including Turkey, and 17% (13) in the rest of the world.
JANUARY-JUNE 2026
Net sales for January-June amounted to EUR 3,093 thousand (2,901), representing an increase of 7% from the comparison period. The increase was mainly driven by the sale of regional intellectual property rights to the QPR Metrics software to Leaders Solutions during the first quarter. Recurring net sales accounted for 68% (79) of total net sales.
SaaS net sales, which are at the core of the company's strategy, decreased by 3% to EUR 1,318 thousand (1,365). QPR ProcessAnalyzer SaaS net sales decreased from the comparison period due to the termination of a single customer contract, while development in the rest of the customer base was positive. Software net sales increased by 19% from the comparison period.
Software license net sales amounted to EUR 744 thousand (106), representing an increase of 605% from the comparison period. The increase was mainly due to the one-off sale of regional intellectual property rights to the QPR Metrics software.
Development in renewable software licenses was positive. Net sales from renewable software licenses amounted to EUR 229 thousand (212), representing an increase of 8% from the comparison period.
Software maintenance service net sales amounted to EUR 558 thousand (715). Net sales were negatively affected by an adjustment made during the second quarter related to the transition of a few larger customers to the SaaS business model. In addition, the termination of certain customer relationships reduced net sales. These impacts were partly offset by new customer acquisition.
Consulting net sales amounted to EUR 245 thousand (503), representing a decrease of 51% from the comparison period. Consulting resources have been reduced partly as a result of the sale of regional intellectual property rights to the QPR Metrics software.
Of the Group's net sales, 31% (40) were generated in Finland, 36% (46) elsewhere in Europe, including Turkey, and 33% (14) in the rest of the world.
FINANCIAL DEVELOPMENT
APRIL-JUNE 2026
The Group's EBITDA for April-June was EUR 19 thousand (-223), representing an improvement of EUR 241 thousand from the comparison period. Operating result was EUR -164 thousand (-469), representing an improvement of EUR 304 thousand from the comparison period. The result for the period was EUR -174 thousand (-454).
The development of the operating result was also supported by lower amortization of capitalized product development expenditure. The company currently capitalizes significantly less product development expenditure than is amortized from previously capitalized product development expenditure. As a result, the level of amortization of capitalized product development expenditure is expected to gradually decrease, supporting the development of the operating result also in future review periods.
The Group's variable costs amounted to EUR 217 thousand (241). The decrease in costs was mainly due to lower use of subcontracting.
The company's fixed costs amounted to EUR 962 thousand (1,364), representing a decrease of 29% from the comparison period. The decrease in personnel expenses was mainly due to a reduction in the number of employees. Personnel expenses were also reduced by the impact of option rights returned in connection with the termination of the former CEO's employment.
Other operating expenses decreased from the comparison period mainly because growth investments were higher during the comparison period.
The company continued to systematically implement its cost-saving program targeting personnel expenses and other operating expenses. During the comparison period, the company launched a cost-saving program for administrative services, under which outsourced financial administration services were replaced with internal personnel resources. The savings generated by the program were reflected in the result for the review period.
Earnings per share were EUR -0.009 (-0.023).
JANUARY-JUNE 2026
The Group's EBITDA for January-June was EUR 533 thousand (-216), representing an improvement of EUR 748 thousand from the comparison period. Operating result was EUR 169 thousand (-710), representing an improvement of EUR 878 thousand from the comparison period. The result for the review period was EUR 146 thousand (-720).
The development of the operating result was also supported by lower amortization of capitalized product development expenditure. The company currently capitalizes significantly less product development expenditure than is amortized from previously capitalized product development expenditure. As a result, the level of amortization of capitalized product development expenditure is expected to gradually decrease, supporting the development of the operating result also in future review periods.
The Group's variable costs amounted to EUR 454 thousand (511). The decrease in costs was mainly due to reduced use of subcontractors.
The company's fixed costs amounted to EUR 2,158 thousand (2,607), representing a decrease of 17% from the comparison period. Personnel expenses decreased mainly as a result of the reduction in the number of employees.
Personnel expenses for the first quarter included a one-off item of EUR 134 thousand related to a change in the company's management. During the second quarter, personnel expenses were reduced by the impact of option rights returned in connection with the termination of the former CEO's employment.
Other operating expenses decreased from the comparison period mainly because growth investments were higher during the comparison period.
Earnings per share were EUR 0.007 (-0.037).
FINANCE AND INVESTMENTS
During the review period, the company's free cash flow, which includes cash flow from operating and investing activities as well as lease payments for premises, amounted to EUR 1,033 thousand (-769). Free cash flow improved significantly from the comparison period, mainly due to changes in working capital and the QPR Metrics transaction with Leaders Solutions completed during the first quarter.
Cash flow from operating activities during the review period was EUR 1,122 thousand (-557). The improvement in cash flow compared with the comparison period was mainly due to the higher result for the review period.
Net financial expenses amounted to EUR 24 thousand (39), including foreign exchange losses of EUR 8 thousand (7).
Investments amounted to EUR 80 thousand (191) and consisted mainly of product development investments.
Net cash flow from financing activities was EUR -275 thousand (1,103). The change from the comparison period was mainly due to the share issue carried out during the comparison period.
The Group's financial position is stable. At the end of the review period, cash and cash equivalents amounted to EUR 1,403 thousand (1,180), and current trade receivables amounted to EUR 568 thousand (945).
Of trade receivables, 72% were denominated in euros, and 89% of invoices were not yet due. Of the total amount of current trade receivables, approximately 1% was overdue by 1-30 days, 0% by 30-60 days, and 10% by more than 60 days.
The Group has access to a EUR 500,000 credit facility, which was undrawn at the end of the review period.
At the end of the review period, the Group had EUR 250,000 in bank loans, which were classified entirely as current liabilities. The loan matures in December 2026 and is no longer subject to covenant terms.
The Group's equity ratio increased to 48.2% (36.9%). The increase was mainly attributable to a decrease in interest-bearing debt and improved earnings compared with the corresponding period.
PRODUCT DEVELOPMENT
QPR develops process intelligence and Digital Twin of an Organization (DTO) solutions that enable organizations to analyze, measure, and model their operations. The company's software products include QPR ProcessAnalyzer, QPR EnterpriseArchitect, QPR ProcessDesigner, and QPR Metrics.
Product development expenses for the second quarter amounted to EUR 223 thousand (228), and EUR 28 thousand (80) of product development expenditure was capitalized on the balance sheet. Amortization of capitalized product development expenditure amounted to EUR 165 thousand (228).
During January-June, product development expenses amounted to EUR 432 thousand (465), and EUR 65 thousand (191) of product development expenditure was capitalized on the balance sheet. Amortization of capitalized product development expenditure amounted to EUR 327 thousand (459). Capitalized product development expenditure is amortized over four years.
Product development focused particularly on enhancing QPR ProcessAnalyzer's AI capabilities, MCP interface, object-centric process mining, and Snowflake-native implementation. The development work aims to enable process intelligence to be utilized directly by AI agents and as part of customers' data and AI architectures. This supports QPR's positioning as a provider of the operational context required by enterprise AI.
PERSONNEL
At the end of the review period, the Group employed 24 people (32). The average number of employees during January-June was 27 (32).
The average age of employees was 46 years (45). Of the personnel, 30% were women (28) and 70% men (72). Of the personnel, 19% worked in sales and marketing (22), 22% in consulting and customer service (28), 50% in product development (37), and 9% in administration (13).
Personnel expenses amounted to EUR 1,503 thousand (1,708), of which wages and salaries accounted for EUR 1,290 thousand (1,497).
The company has a bonus program covering all employees. The short-term remuneration of senior management consists of a fixed salary, fringe benefits, and a possible annual bonus, which is determined mainly on the basis of the development of the Group's net sales and result. In addition, the company has a stock option program for key personnel.
SHARES AND SHAREHOLDERS
| Trading of shares | Jan-June, 2026 | Jan-June, 2025 | Change, % | Jan-Dec, 2024 |
| Shares traded, pcs | 1,113,946 | 2,365,522 | -53 | 4,862,073 |
| Volume, EUR | 754,303 | 2,355,078 | -68 | 4,004,913 |
| % of shares | 5.6 | 12.1 | -53 | 24.7 |
| Average trading price, EUR | 0.68 | 1.00 | -32 | 0.82 |
| Average trading value per day, EUR | 6,183 | 19,304 | -68 | 16,020 |
| Treasury shares acquired during the year, pcs | 0 | 0 | 0 | 0 |
| Shares and market capitalization | Jan-June, 2026 | Jan-June, 2025 | Change, % | Dec 31, 2025 |
| Total number of shares, pcs | 19,850,578 | 19,850,578 | 0 | 19,850,578 |
| Treasury shares, pcs | 120,158 | 256,849 | -53 | 190,911 |
| Book counter value, EUR | 0.11 | 0.11 | - | 0.11 |
| Outstanding shares, pcs | 19,730,420 | 19,593,729 | 1 | 19,659,667 |
| Number of shareholders | 2,618 | 2,524 | 4 | 2,635 |
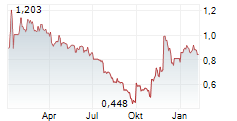
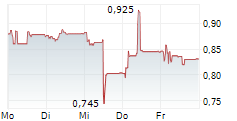
| Closing price, EUR | 0.59 | 0.81 | -28 | 0.83 |
| Market capitalization, EUR | 11,562,026 | 15,870,920 | -27 | 16,317,524 |
| Book counter value of all treasury shares, EUR | 13,217 | 28,253 | -53 | 21,000 |
| Total purchase value of all treasury shares, EUR | 111,058 | 244,349 | -55 | 177,027 |
| Treasury shares, % of all shares | 0.6 | 1.3 | -53 | 1.0 |
GOVERNANCE
The Annual General Meeting of QPR Software Plc was held today on June 17, 2026 in Espoo. The General Meeting adopted the Company's financial statements for the financial year 2025 and discharged the members of the Board of Directors and the CEO from liability. The General Meeting resolved that no dividend be paid based on the balance sheet adopted for the financial year ended on December 31, 2025, and adopted the Company's Remuneration Report. Further, the General Meeting resolved to authorise the Board of Directors to decide on share issues and on the issues of special rights entitling to shares as well as on the acquisition of own shares.
Annual accounts and the use of the profit shown on the balance sheet
The General Meeting adopted the Company's financial statements and discharged the members of the Board of Directors and the CEO from liability for the financial period January 1 - December 31, 2025. The General Meeting resolved that no dividend be paid based on the balance sheet adopted for the financial year ended on December 31, 2025.
Remuneration of the members of the Board of Directors and the Auditor
The General Meeting resolved that the Chairman of the Board of Directors be paid EUR 45,000 per year and the other members of the Board of Directors EUR 25,000 per year. Approximately 40 percent of the remuneration will be paid in shares and 60 percent in cash. The shares will be transferred at the earliest after the General Meeting election and in accordance with the insider trading regulations. The members of the Board of Directors will also be reimbursed for travel and other expenses incurred while they are managing the Company's affairs.
The remuneration of the auditor will be paid according to a reasonable invoice.
Board of Directors and Auditor
The General Meeting confirmed that the number of Board members is four (4). Pertti Ervi was re-elected as the Chairman of the Board of Directors and Antti Koskela and Maija Hovila were re-elected as members of the Board of Directors. Patrik Sallner was elected as a new member of the Board of Directors.
Authorised Public Accountants Ernst & Young Oy was elected as the Company's auditor. Ernst & Young Oy has announced that Maria Onniselkä, Authorised Public Accountant, will act as the principal auditor.
Authorisation of the Board of Directors to decide on share issues and on the issues of special rights entitling to shares
The General Meeting resolved to authorise the Board of Directors to decide on issuances of new shares and conveyances of own shares held by the Company (share issue) either in one or more instalments. The share issues can be carried out against payment or without consideration on terms to be determined by the Board of Directors. The authorisation also includes the right to issue special rights referred to in Chapter 10, Section 1 of the Finnish Companies Act, which entitle to the Company's new shares or own shares held by the Company against consideration. Based on the authorisation, the maximum number of new shares that may be issued and own shares held by the Company that may be conveyed in share issues and/or on the basis of special rights is 1,985,057 shares. The authorisation includes the right to deviate from the shareholders' pre-emptive subscription right. The authorisation is in force until the next Annual General Meeting.
Authorisation of the Board of Directors to decide on the acquisition of own shares
The General Meeting resolved to authorise the Board of Directors to decide on the acquisition of the Company's own shares. Based on the authorisation, an aggregate maximum amount of 500,000 own shares may be acquired, either in one or more instalments. The authorisation includes the right to acquire own shares in public trading otherwise than in proportion to the existing shareholdings of the Company's shareholders, using the Company's non-restricted shareholders' equity. The authorisation is in force until the next Annual General Meeting.
NEAR-TERM RISKS AND UNCERTAINTIES
The objective of QPR's internal control and risk management is to ensure that the company's operations are efficient and effective, information is reliable, applicable regulations and operating principles are complied with, the company's strategic objectives are achieved, the company responds appropriately to changes in the market and operating environment, and business continuity is safeguarded while taking the company's financial position into account.
The company has identified the following three categories of risks related to its operations: business risks (country, customer, personnel, and legal risks), information and product-related risks (product, intellectual property, data protection, and security risks), and financial and liquidity risks (foreign exchange risk and risks related to short-term cash flow). The company has insured its property, business interruption, and liability risks.
The company's financial risks include a moderate credit loss risk related to individual business partners, which is inherent in international business. The company seeks to limit this risk through continuous monitoring of standard payment terms, receivables, and credit limits.
The company has described its risk factors in more detail in its 2025 Financial Statements and Report of the Board of Directors.
At the end of the review period, 72% of the Group's trade receivables were denominated in euros (55). The company's non-euro-denominated trade receivables were not hedged at the end of the quarter.
EVENTS AFTER THE REVIEW PERIOD
On August 4, 2026, QPR Software issued a profit warning and lowered its guidance for SaaS net sales for 2026. The change in guidance is due to the termination of two SaaS customer contracts. One of the contracts being terminated concerns the company's legacy product.
The termination of the contracts will have a significant impact on SaaS net sales during the second half of 2026, and the company does not expect to be able to fully offset their impact during 2026. The guidance for EBITDA remained unchanged.
According to the updated guidance, QPR Software estimates that its SaaS net sales will decrease in 2026 compared with the previous year. The company estimates that its EBITDA will improve from 2025.
FINANCIAL REPORTING IN 2026
During 2026, QPR will publish the following financial report:
- The Business Review for January-September 2026 will be published on October 30, 2026.
QPR's Annual Report 2025 was published on March 27, 2026, and QPR's Annual General Meeting 2026 was held in Espoo on June 17, 2026.
The Annual Report 2025 and the resolutions of the Annual General Meeting are available in the Investors section of the company's website.
QPR SOFTWARE PLC
BOARD OF DIRECTORS
For further information:
QPR Software Plc
Matti Erkheikki
Chief Executive Officer
Tel. +358 40 717 2570
QPR Software in Brief
QPR Software (Nasdaq Helsinki) is a leading player in the Digital Twin of an Organization (DTO) use case and one of the most advanced process mining software companies in the world. The company innovates, develops, and delivers software for analyzing, monitoring, and modeling organizational operations. Additionally, QPR provides consulting services to ensure its customers derive full benefits from the software and associated methodologies.
www.qpr.com
DISTRIBUTION
Nasdaq Helsinki
Key medias
www.qpr.com
HALF-YEAR FINANCIAL REPORT JANUARY-JUNE 2026
The Board of Directors of QPR Software Plc has approved this Half-Year Report for the period January 1-June 30, 2026 for publication.
The figures presented in the financial section for the full financial year 2025 have been audited. The interim figures presented in this Half-Year Report are unaudited.
FINANCIAL STATEMENT INFORMATION
CONSOLIDATED COMPREHENSIVE INCOME STATEMENT
| Restated | Restated | ||||||
| EUR in thousands, unless otherwise indicated | April-June, 2026 | April-June, 2025 | Change, % | Jan-June, 2026 | Jan-June, 2025 | Change, % | Jan-Dec, 2025 |
| Net sales | 1,146 | 1,382 | -17 | 3,093 | 2,901 | 7 | 5,619 |
| Other operating income | 52 | - | - | 52 | - | - | 1 |
| Materials and services | 217 | 241 | -10 | 454 | 511 | -11 | 933 |
| Employee benefit expenses | 650 | 854 | -24 | 1,503 | 1,708 | -12 | 3,044 |
| Other operating expenses | 312 | 509 | -39 | 655 | 898 | -27 | 1,569 |
| EBITDA | 19 | -223 | 108 | 533 | -216 | 347 | 75 |
| Depreciation and amortization | 183 | 246 | -26 | 363 | 493 | -26 | 887 |
| Operating result | -164 | -469 | 65 | 170 | -710 | 124 | -813 |
| Financial income and expenses | -10 | -20 | -50 | -24 | -39 | -40 | -50 |
| Result before tax | -174 | -489 | 64 | 146 | -749 | 120 | -862 |
| Income taxes | - | 35 | -100 | 0 | 29 | -100 | -187 |
| Result for the period | -174 | -454 | 62 | 146 | -720 | 120 | -1,050 |
| Profit for the period attributable: | |||||||
| To the Owners' of the Parent Company | -174 | -454 | 146 | -720 | -1,050 | ||
| Earnings per share, EUR (basic and diluted) | -0.009 | -0.023 | 62 | 0.007 | -0.037 | 120 | -0.054 |
| Consolidated statement of comprehensive income: | |||||||
| Result for the period | -174 | -454 | 62 | 146 | -720 | 120 | -1,050 |
| Exchange differences on translating foreign operations | 1 | 9 | -87 | 2 | 3 | -32 | 2 |
| Total comprehensive income | -173 | -445 | 61 | 148 | -717 | 121 | -1,048 |
| *Adjustment to the previous financial period due to a change in the reporting policy of product development activations |
CONDENCED CONSOLIDATED BALANCE SHEET
| EUR in thousands | June 30, 2026 | June 30, 2025 | Change, % | Dec 31, 2025 |
| Assets | ||||
| Non-current assets: | ||||
| Intangible assets | 965 | 1,373 | -30 | 1,240 |
| Goodwill | 358 | 358 | 0 | 358 |
| Tangible assets | 2 | 7 | -72 | 5 |
| Right-of-use assets | 314 | 356 | -12 | 335 |
| Other non-current assets | 216 | 329 | -34 | 216 |
| Total non-current assets | 1,855 | 2,424 | -23 | 2,154 |
| Current assets: | ||||
| Trade and other receivables | 908 | 1,417 | -36 | 2,461 |
| Cash and cash equivalents | 1,403 | 1,180 | 19 | 621 |
| Total current assets | 2,311 | 2,597 | -11 | 3,081 |
| Total assets | 4,166 | 5,021 | -17 | 5,235 |
| Equity and liabilities | ||||
| Equity: | ||||
| Share capital | 80 | 80 | 0 | 80 |
| Other funds | 21 | 21 | 0 | 21 |
| Treasury shares | -111 | -244 | -55 | -177 |
| Translation differences | -61 | -62 | 1 | -63 |
| Invested non-restricted equity fund | 6,548 | 6,548 | 0 | 6,548 |
| Retained earnings | -5,085 | -4,943 | -3 | -5,229 |
| Equity attributable to shareholders of the parent company | 1,392 | 1,400 | -1 | 1,180 |
| Total equity | 1,392 | 1,400 | -1 | 1,180 |
| Non-current liabilities: | ||||
| Interest-bearing lease liabilities | 315 | 358 | -12 | 333 |
| Total non-current liabilities | 315 | 358 | -12 | 333 |
| Current liabilities: | ||||
| Interest-bearing liabilities | 250 | 500 | -50 | 500 |
| Interest-bearing lease liabilities | 37 | 28 | 32 | 35 |
| Advances received | 1,277 | 1,224 | 4 | 773 |
| Accrued expenses and prepaid income | 552 | 1,005 | -45 | 1,896 |
| Trade and other payables | 344 | 507 | -32 | 517 |
| Total current liabilities | 2,460 | 3,264 | -25 | 3,722 |
| Total liabilities | 2,774 | 3,621 | -23 | 4,055 |
| Total equity and liabilities | 4,166 | 5,021 | -17 | 5,235 |
CONSOLIDATED CONDENCED CASH FLOW STATEMENT
| EUR in thousands | April-June, 2026 | April-June, 2025 | Change, % | Jan-June, 2026 | Jan-June, 2025 | Change, % | Jan-Dec, 2025 |
| Cash flow from operating activities: | |||||||
| Result for the period | -174 | -454 | 62 | 146 | -720 | 120 | -1,050 |
| Adjustments to the result | 125 | 306 | -59 | 444 | 634 | -30 | 1,129 |
| Working capital changes | -174 | -618 | 72 | 549 | -430 | 228 | -889 |
| Interest and other financial expenses paid | -2 | -7 | -79 | -8 | -31 | -74 | -39 |
| Interest and other financial income received | 0 | 0 | 131 | 0 | 1 | -94 | 15 |
| Income taxes paid | -5 | -5 | -8 | -10 | -11 | -13 | -20 |
| Net cash from operating activities | -229 | -779 | 71 | 1,122 | -557 | 301 | -855 |
| Cash flow from investing activities: | |||||||
| Purchases of tangible and intangible assets | 2 | -80 | -102 | -65 | -191 | -66 | -428 |
| Net cash used in investing activities | 2 | -80 | 102 | -65 | -191 | 66 | -428 |
| Cash flow from financing activities: | |||||||
| Repayments of short term borrowings | - | - | - | -250 | -500 | -50 | -500 |
| Payment of lease liabilities | -12 | -12 | -1 | -25 | -20 | 22 | -44 |
| Share issue net | - | - | - | - | 1,624 | - | 1,624 |
| Net cash used in financing activities | -12 | -12 | -1 | -275 | 1,103 | -125 | 1,079 |
| Net change in cash and cash equivalents | -240 | -871 | 72 | 783 | 355 | 120 | -204 |
| Cash and cash equivalents at the beginning of the period | 1,644 | 2,051 | -20 | 621 | 825 | -25 | 825 |
| Cash and cash equivalents at the end of the period | 1,403 | 1,180 | 19 | 1,403 | 1,180 | 19 | 621 |
CONSOLIDATED STATEMENT OF CHANGES IN EQUITY
| Share capital | Other funds | Translation differences | Treasury shares | Invested non-restricted equity fund | Retained earnings | Total | |
| Equity Jan 1, 2025 | 80 | 21 | -65 | -244 | 4,925 | -4,316 | 401 |
| Total comprehensive income for the period: | |||||||
| Profit for the period | -1,050 | -1,050 | |||||
| Translation differences | 2 | 2 | |||||
| Total comprehensive income for the period | 2 | -1,050 | -1,048 | ||||
| Transactions with owners of the Company: | |||||||
| Disposal of own shares | 67 | -19 | 48 | ||||
| Stock option scheme | 156 | 156 | |||||
| Share issue, net | 1,624 | 1,624 | |||||
| Total of transactions with owners of the Company | 67 | 1,624 | 137 | 1,828 | |||
| Equity Dec 31, 2025 | 80 | 21 | -63 | -177 | 6,548 | -5,229 | 1,180 |
| Equity Jan 1, 2026 | 80 | 21 | -63 | -177 | 6,548 | -5,229 | 1,180 |
| Total comprehensive income for the period | |||||||
| Profit for the period: | 146 | 146 | |||||
| Translation differences | 2 | 2 | |||||
| Total comprehensive income for the period | 2 | 146 | 148 | ||||
| Transactions with owners of the Company: | |||||||
| Disposal of own shares | 66 | -18 | 48 | ||||
| Stock option scheme | 16 | 16 | |||||
| Total of transactions with owners of the Company | 66 | -2 | 64 | ||||
| Equity June 30, 2026 | 80 | 21 | -61 | -111 | 6,548 | -5,085 | 1,392 |
NOTES TO INTERIM FINANCIAL STATEMENTS
BASIC INFORMATION
QPR provides services and tools for the development of business processes and enterprise architecture. The parent company of the Group is QPR Software Plc (Business ID 0832693-7), a Finnish public limited liability company. The shares of QPR Software Plc are listed on Nasdaq Helsinki Ltd in the Technology sector. The domicile of the parent company, QPR Software Plc, is Helsinki, Finland, and its registered address is Keilaranta 1, FI-02150 Espoo, Finland.
ACCOUNTING PRINCIPLES
This Interim Report has been prepared in accordance with IAS 34 Interim Financial Reporting. The Interim Report does not include all the information required in annual financial statements and should therefore be read in conjunction with the Group's consolidated financial statements for 2025.
The same accounting principles have been applied in preparing this Interim Report as in the annual financial statements for 2025.
The preparation of the Interim Report in accordance with IFRS Accounting Standards requires management to make estimates and assumptions that affect the amounts of assets and liabilities reported at the date of the statement of financial position, as well as the amounts of income and expenses for the review period and future periods. Judgement is also required in applying the accounting principles used in preparing the Interim Report. The estimates and assumptions used in determining the carrying amounts of assets and liabilities are based on management's views at the date of the Interim Report, expected outcomes, and other assumptions available when preparing this Interim Report that are considered reasonable under the circumstances. Estimates involve risks and uncertainties, and actual results may differ from the estimates and assumptions made.
Unless otherwise stated, the figures presented in the Interim Report are consolidated figures. The figures in this report have been rounded, and therefore the sum of individual figures may differ from the total presented.
INTANGIBLE AND TANGIBLE ASSETS
| EUR in thousands | Jan-June, 2026 | Jan-June, 2025 | Jan-Dec, 2025 |
| Intangible assets | |||
| Book value at the beginning of the period | 1,240 | 1,641 | 1,641 |
| Increase | 65 | 191 | 427 |
| Amortizations | -340 | -460 | -828 |
| Book value at the end of the period | 965 | 1,373 | 1,240 |
| Tangible assets | |||
| Book value at the beginning of the period | 5 | 20 | 20 |
| Increase | - | - | 2 |
| Depreciations | -3 | -13 | -17 |
| Book value at the end of the period | 2 | 7 | 5 |
SHARE-BASED PAYMENTS
QPR Software has 2022, 2023, and 2024 stock option programs in place, which are used as part of the Group's incentive and retention program for key personnel. The impact of share-based payments on the result for the review period was EUR 30 thousand.
CHANGES IN INTEREST-BEARING LIABILITIES
| EUR in thousands | Jan-June, 2026 | Jan-June, 2025 | Jan-Dec, 2025 |
| Interest-bearing liabilities Jan 1 | 868 | 1,401 | 1,401 |
| Proceeds from borrowings | - | - | - |
| IFRS 16 - change in lease liability | -17 | -16 | -33 |
| Repayments | 250 | 500 | 500 |
| Book value at the end of the period | 601 | 885 | 868 |
PLEDGES AND COMMITMENTS
| EUR in thousands | June 30, 2026 | June 30, 2025 | Change, % | Dec 31, 2025 |
| Business mortgages | 2,382 | 2,382 | 0 | 2,383 |
| Minimum lease payments based on lease agreements: | ||||
| Maturing in less than one year | 5 | 11 | -51 | - |
| Maturing in 1-5 years | 7 | - | - | - |
| Total | 12 | 11 | 14 | - |
| Total pledges and commitments | 2,395 | 2,393 | 0 | 2,383 |
CONSOLIDATED INCOME STATEMENT BY QUARTER
| Restated | Restated | ||||
| EUR in thousands | April-June, 2026 | Jan - Mar, 2026 | Oct-Dec, 2025 | July-Sept, 2025 | April-June, 2025 |
| Net sales | 1,146 | 1,947 | 1,246 | 1,473 | 1,382 |
| Other operating income | 52 | - | 0 | 1 | - |
| Materials and services | 217 | 237 | 187 | 235 | 241 |
| Employee benefit expenses* | 650 | 853 | 714 | 621 | 854 |
| Other operating expenses* | 312 | 343 | 350 | 320 | 509 |
| EBITDA | 19 | 514 | -6 | 297 | -223 |
| Depreciation and amortization | 183 | 181 | 194 | 200 | 246 |
| Operating result | -164 | 334 | -200 | 97 | -469 |
| Financial income and expenses | -10 | -14 | 6 | -16 | -20 |
| Result before tax | -174 | 320 | -194 | 81 | -489 |
| Income taxes | - | - | -217 | - | 35 |
| Result for the period | -174 | 320 | -411 | 81 | -454 |
| *Adjustment to the previous financial period due to a change in the reporting policy of product development activations |
GROUP KEY FIGURES
| EUR in thousands, unless otherwise indicated | Jan-June or June, 2026 | Jan-June or June, 2025 | Jan-Dec or Dec, 2025 |
| Net sales | 3,093 | 2,901 | 5,619 |
| Net sales growth, % | 6.6 | -10.5 | -15.0 |
| EBITDA | 533 | -216 | 75 |
| % of net sales | 17.2 | -7.4 | 1.3 |
| Operating result | 170 | -710 | -813 |
| % of net sales | 5.5 | -24.5 | -14.5 |
| Result before tax | 146 | -749 | -862 |
| % of net sales | 4.7 | -25.8 | -15.3 |
| Result for the period | 146 | -720 | -1,050 |
| % of net sales | 4.7 | -24.8 | -18.7 |
| Return on equity (per annum), % | 22.7 | -159.8 | -132.8 |
| Return on investment (per annum), % | 14.4 | -74.2 | -51.9 |
| Cash and cash equivalents | 1,403 | 1180 | 621 |
| Net borrowings | -802 | -295 | 248 |
| Equity | 1,392 | 1400 | 1,180 |
| Gearing, % | -57.6 | -21.0 | 21.0 |
| Equity ratio, % | 48.2 | 36.9 | 26.5 |
| Total balance sheet | 4,166 | 5,021 | 5,235 |
| Investments in non-current assets | 65 | 192 | 429 |
| % of net sales | 2.1 | 6.6 | 7.6 |
| Product development expenses | 432 | 466 | 868 |
| % of net sales | 14.0 | 16.1 | 15.4 |
| Average number of personnel | 27 | 32 | 32 |
| Personnel at the beginning of period | 31 | 32 | 32 |
| Personnel at the end of period | 23 | 32 | 31 |
| Earnings per share, EUR (basic and diluted) | 0.007 | -0.039 | -0.054 |
| Equity per share, EUR | 0.071 | 0.071 | 0.060 |
SEGMENT INFORMATION
QPR Software reports one business segment, Organizational Performance Development. In addition, the company presents its income in the following categories: Software Licenses, Renewable Software Licenses, Software Maintenance Services, Cloud Services (SaaS), and Consulting.
Renewable Software Licenses, together with Software Maintenance Services and Cloud Services (SaaS), constitute the company's reported recurring revenue. These are based on long-term contracts that are either valid until further notice or concluded for several years, and are generally invoiced annually in advance.
The same accounting principles are applied to segment reporting as in the consolidated financial statements.
