
BlackRock American Income Trust Plc - Portfolio Update
PR Newswire
LONDON, United Kingdom, September 02
BLACKROCK AMERICAN INCOME TRUST PLC (LEI:549300WWOCXSC241W468)
All information is at 31 July 2026 and unaudited.
Performance at month end with net income reinvested
One Month | Three Months | Six Months | One Year | Three Years | Five Years | |
Net asset value | 2.7 | 12.3 | 20.4 | 36.4 | 55.5 | 77.1 |
Share price | 2.2 | 12.8 | 22.8 | 45.3 | 69.5 | 91.3 |
Russell 1000 Value Index | 2.4 | 10.3 | 17.7 | 29.0 | 56.7 | 80.7 |
Russell 1000 Value Index (Net 15% WHT Total Return)* | 2.4 | 10.3 | 17.5 | 28.6 | 55.2 | 77.8 |
*The Company's performance reference index (the Russell 1000 Value Index) may be calculated on either a gross or a net return basis. Net return (NR) indices calculate the reinvestment of dividends net of withholding taxes using the tax rates applicable to non-resident institutional investors and hence give a lower total return than indices where calculations are done on a gross basis. As the Company is subject to the same withholding tax rates for the countries in which it invests, the NR basis is felt to be the most accurate, appropriate, consistent and fair comparison of performance returns for the Company.
At month end
Net asset value - capital only: | 276.35p |
Net asset value - cum income: | 276.96p |
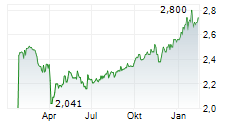
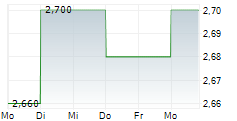
Share price: | 279.00p |
Premium to cum income NAV: | 0.7% |
Net yield 1 : | 5.3% |
Total assets including current year revenue: | £179.8m |
Net cash: | 0.54% |
Ordinary shares in issue 2 : | 64,920,138 |
Ongoing charges 3 : | 0.73% |
1 Based on one quarterly dividend of 3.23p per share declared on 07 August 2025 and one quarterly dividend of 3.44p per share declared on 03 November 2025 for the year ended 31 October 2025 and based on one quarterly dividend of 3.55p per share declared on 02 February 2026 and one quarterly dividend of 3.75p declared on 01 May 2026 and one quarterly dividend of 4.15p per share declared on 03 August for the year ending 31 October 2026, and based on the share price as at close of business on 31 July 2026.
² Excluding 30,441,167 ordinary shares held in treasury.
³ The Company's ongoing charges calculated as a percentage of average daily net assets and using the management fee and all other operating expenses excluding finance costs, direct transaction costs, custody transaction charges, VAT recovered, taxation and certain non-recurring items for the year ended 31 October 2025.
Sector Analysis | Total Assets (%) |
Information Technology | 19.0 |
Financials | 17.8 |
Health Care | 13.4 |
Consumer Discretionary | 12.1 |
Industrials | 12.1 |
Consumer Staples | 6.8 |
Energy | 6.0 |
Materials | 3.4 |
Utilities | 3.1 |
Communication Services | 2.7 |
Real Estate | 2.5 |
Net Current Assets | 1.1 |
----- | |
100.0 | |
===== | |
Country Analysis | Total Assets (%) |
United States | 98.9 |
Net Current Assets | 1.1 |
---- | |
100.0 | |
===== | |
#
Top 10 Holdings | Country | % Total Assets |
Amazon | United States | 6.8 |
Apple | United States | 5.3 |
Microsoft | United States | 4.6 |
Berkshire Hathaway | United States | 2.9 |
JPMorgan Chase | United States | 2.6 |
ExxonMobil | United States | 1.9 |
Bank Of America | United States | 1.8 |
Chevron | United States | 1.6 |
Procter & Gamble | United States | 1.5 |
Goldman Sachs | United States | 1.4 |
Travis Cooke and Muzo Kayacan, representing the Investment Manager, noted:
For the month ended 31 July 2026, the Company's NAV returned 2.7%, marginally outperforming the Russell 1000 Value Index which returned 2.4% net of fees.
The dominant feature of the month was a sharp drawdown across the intersection of Artificial Intelligence, Momentum and higher-Beta stocks. This occurred despite continued upward revisions to both earnings expectations and capital expenditure guidance, reinforcing the view that the correction was driven by an unwind of leveraged bets rather than any deterioration in the long-term AI investment thesis. Traditional cyclical sectors emerged as the principal beneficiaries of the rotation. Energy was the standout performer during July as the re-escalation of the Iran conflict restored a meaningful geopolitical risk premium to oil prices, while Consumer Discretionary also benefited from the broadening in market leadership. This ensured the July FOMC meeting retained a distinctly hawkish tone. While policy rates were left unchanged, persistent core inflation and resilient economic activity prompted markets to further reduce expectations for near-term policy easing. The resulting move higher in bond yields benefited Financials while exerting additional pressure on long-duration growth stocks.
Positions in Industrials and Health Care made positive contributions, helped, in Industrials, by some overweights in aerospace and defense firms, as well as an underweight exposure to construction machinery. The Health Care contribution was concentrated in health care equipment, supported by strong results reported by Abbot Laboratories, while an underweight exposure to pharmaceuticals also helped as the industry lagged. On the other side, the Information Technology sector was a source of negative active returns, and this was concentrated in semiconductors, hardware and electronics, where overweight exposures were hurt by a sharp July correction in AI-related firms.
Signals using large language models to identify themes and the stocks exposed to them were well positioned for a rebound in oil and software firms. Credit market insights also captured some strength in financial exchanges and asset managers. On the negative side, quality signals focused on default probability struggled with the rotation back into some of the firms that had suffered from a perception of AI-related threats.
Source: BlackRock.
2 September 2026
Latest information is available by typing blackrock.com/uk/braion the internet, "BLRKINDEX" on Reuters, "BLRK" on Bloomberg or "8800" on Topic 3 (ICV terminal). Neither the contents of the Manager's website nor the contents of any website accessible from hyperlinks on the Manager's website (or any other website) is incorporated into, or forms part of, this announcement.

