HALIFAX, NS / ACCESSWIRE / September 12, 2023 / Silver Tiger Metals Inc. (TSXV:SLVR)(OTCQX:SLVTF) ("Silver Tiger" or the "Corporation") is pleased to announce an Updated Mineral Resource Estimate ("MRE") for its 100% owned, high-grade silver-gold El Tigre Project (the "Project" or "El Tigre") located in Sonora, Mexico. This Updated MRE was based on information and data supplied by Silver Tiger, and was undertaken by Yungang Wu, P.Geo. and Eugene Puritch, P.Eng., FEC, CET of P&E Mining Consultants Inc. of Brampton, Ontario.
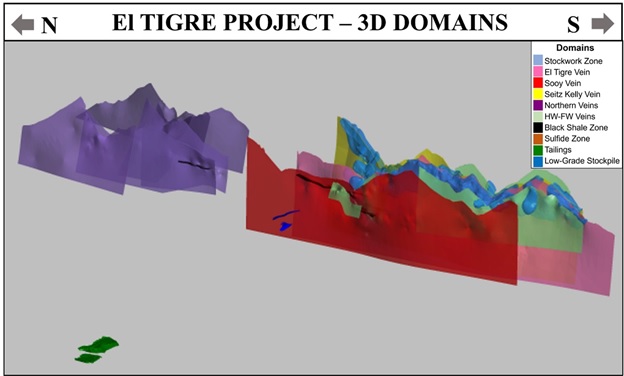
The Updated MRE includes the newly-discovered Sulfide and Black Shale Zones, Veins and Pit-Constrained Resources (Figure 1).
Highlights Include:
- Increase of 84% in Indicated Silver Equivalent ("AgEq") Ounces from initial September 2017 Mineral Resource, with 3% increase in AgEq grade;
- Increase of 257% in Inferred AgEq Ounces from initial September 2017 Mineral Resource, with an 13% increase in AgEq grade;
- Pit-constrained El Tigre Indicated Mineral Resources of 61.4 Million ounces (Moz) AgEq grading 44 g/t AgEq contained in 43.0Million tonnes ("Mt");
- Pit-constrained El Tigre Inferred Mineral Resources of 20.0 Moz AgEq grading 54 g/t AgEq contained in 11.5 Mt;
- Out-of-Pit El Tigre Indicated Mineral Resources of 20.8 Moz AgEq grading 279 g/t AgEq contained in 2.3 Mt;
- Out-of-Pit El Tigre Inferred Mineral Resources of 69.8 Moz AgEq grading 235 g/t AgEq contained in 9.2 Mt;
- Out-of-Pit Indicated Mineral Resources, at a cut-off grade of 263 g/t AgEq (3.5 gpt AuEq), contains 12.8 Moz ounces AgEq grading 484 g/t AgEq within in 0.8 Mt;
- Out-of-Pit Inferred Mineral Resources, at a cut-off grade of 263 g/t AgEq (3.5 gpt AuEq), contains 32.4 Moz ounces AgEq grading 400 g/t AgEq within in 2.5 Mt; and
- The El Tigre Project Mineral Resource is amenable to both open pit and bulk underground mining methods;
Indicated Mineral Resources are estimated at 46.4 Mt grading 25 g/t silver, 0.39 g/t gold, 0.01% copper, 0.03% lead, and 0.06% zinc (0.77 g/t AuEq). The Updated Mineral Resource Estimate includes Indicated Mineral Resources of 37.2 Moz of silver, 575 koz of gold, 9.4 Mlb of copper, 35.5 Mlb of lead, and 64.3 Mlb of zinc (1.1 Moz AuEq).
Inferred Mineral Resources are estimated at 20.9 Mt grading 78.4 g/t silver, 0.56 g/t gold, 0.04% copper, 0.13% lead, and 0.22% zinc (1.79 g/t AuEq). The Updated Mineral Resource Estimate includes Inferred Mineral Resources of 52.6 Moz of silver, 374 koz of gold, 18.1 Mlb of copper, 59.7 Mlb of lead, and 103.4 Mlb of zinc (1.2 Moz AuEq).
Preliminary Economic Assessment
As previously announced, Silver Tiger expects to deliver its PEA during September 2023.
Glenn Jessome, President and CEO, stated: "I would like to thank our technical team and our external consultants for delivering this positive Mineral Resource Estimate. The discovery of the Shale and Sulphide Zones, increased tonnage in the Veins and further delineation of the Open Pit has greatly increased the Mineral Resource and grade since our last published Technical Report. We have now delineated approximately 37.2 million ounces of silver and 575 thousand ounces of gold in the Indicated category, and 52.6 million ounces of silver and 374 thousand ounces of gold in the Inferred category." Mr. Jessome further stated: "With this successful MRE being complete, we now turn our attention to economics. As previously announced, we expect to deliver our PEA in Q4 2023. This coming milestone will see Silver Tiger transition from an explorer to a developer. This transition could significantly increase shareholder value."
A Technical Report is being prepared on the Updated Mineral Resource Estimate in accordance with National Instrument 43-101 ("NI-43-101"), and will be available on the Company's website and SEDAR within 45 days of the date of this release. The effective date of this Updated Mineral Resource Estimate is September 12, 2023.
Mineral Resource Estimate Methodology - El Tigre Project
A total of 482 drill holes (124,851 metres) and 3,160 surface and adit channel samples (6,473 metres) were used in the Mineral Resource Estimate. Historical underground chip samples from the El Tigre Mine, totaling 16,319, were used to define the vein limits only and not grade estimation.
P&E Mining Consultants Inc. ("P&E") collaborated with Silver Tiger personnel to develop the mineralization models, estimates, and reporting criteria for the Mineral Resources at El Tigre. Mineralization models were initially developed by Silver Tiger and were reviewed and modified by P&E. A total of twenty-three individual mineralized domains have been identified through drilling and surface sampling. The outlines of the halos and veins below surface from 0 to 100 m were influenced by the selection of mineralized material above 0.3 g/t AuEq, whereas 1.0 g/t AuEq was applied for the veins >100 m below surface that demonstrated lithological and structural zonal continuity along strike and down-dip.
Mineralization wireframes were used as hard boundaries for the purposes of grade estimation. A 5 m x 5 m x 5 m three-dimensional block model was used for the Mineral Resource Estimate. The block model consists of estimated Au, Ag, Cu, Pb and Zn grades, estimated bulk density, classification criteria, and a block volume inclusion percent factor. Au and Ag equivalent block grades were subsequently calculated from the estimated metal grades.
Sample assays were composited to a 1.5m standard length. Au, Ag, Cu, Pb and Zn grades were estimated using Inverse Distance Cubed weighting of between 1 and 12 composites, with a maximum of 2 composites per drill hole. Composites were capped prior to estimation by mineralization domain. Composite samples were selected within an anisotropic search ellipse oriented down the plunge of identified high grade trends.
A total of 5,699 bulk density analyses were provided in the drill hole database. The bulk density ranged from 1.6 (dump) to 3.02 t/m 3 in the mineralized wireframes.
Classification criteria were determined from observed grade and geological continuity as well as variography. Indicated Mineral Resources are informed by 2 or more drill holes within 50 m; Inferred Mineral Resources are informed by 1 or more drill holes with a search radius sufficient to populate the wireframes. No Measured Mineral Resources were calculated.
P&E is of the opinion that the Mineral Resource Estimates are suitable for public reporting and are a reasonable representation of the mineralization and metal content of the El Tigre Deposit.
Table 1: El Tigre Project 2023 Mineral Resources Statement (1-10)
Deposit | Tonnes | Average Grade | Contained Metal | ||||||||||||
|---|---|---|---|---|---|---|---|---|---|---|---|---|---|---|---|
Au | Ag | Cu | Pb | Zn | AuEq | AgEq | Au | Ag | Cu | Pb | Zn | AuEq | AgEq | ||
(M) | (g/t) | (g/t) | (%) | (%) | (%) | (g/t) | (g/t) | (koz) | (koz) | (Mlb) | (Mlb) | (Mlb) | (koz) | (koz) | |
Indicated: | |||||||||||||||
South Zone In Pit | 43.0 | 0.39 | 14 | 0.01 | 0.02 | 0.59 | 44 | 535 | 20,049 | 1.8 | 7.0 | 14.3 | 818 | 61,381 | |
South Zone Out-of-Pit | 1.8 | 0.28 | 200 | 0.18 | 0.59 | 1.02 | 3.83 | 287 | 16 | 11,453 | 7.2 | 23.1 | 40.1 | 219 | 16,403 |
North Zone Out-of-Pit | 0.5 | 0.72 | 158 | 0.04 | 0.41 | 0.80 | 3.36 | 252 | 13 | 2,777 | 0.4 | 4.9 | 9.7 | 59 | 4,435 |
Out of Pit Total | 2.3 | 0.38 | 191 | 0.15 | 0.55 | 0.97 | 3.72 | 279 | 29 | 14,231 | 7.6 | 28.0 | 49.8 | 278 | 20,838 |
Vein (S & N) Total | 45.3 | 0.39 | 24 | 0.01 | 0.04 | 0.06 | 0.75 | 56 | 564 | 34,280 | 9.4 | 35.0 | 64.1 | 1,096 | 82,219 |
Low Grade Stockpile | 0.1 | 0.9 | 177 | 0.02 | 0.22 | 0.50 | 3.41 | 255 | 3 | 588 | 0.1 | 0.5 | 0.2 | 11 | 847 |
Tailings | 0.9 | 0.27 | 78 | 1.30 | 98 | 8 | 2,345 | 39 | 2,948 | ||||||
Total Indicated | 46.4 | 0.39 | 25 | 0.01 | 0.03 | 0.06 | 0.77 | 58 | 575 | 37,212 | 9.4 | 35.5 | 64.3 | 1,147 | 86,014 |
Inferred: | |||||||||||||||
South Zone In Pit | 11.5 | 0.47 | 17 | 0.00 | 0.01 | 0.02 | 0.72 | 54 | 176 | 6,396 | 0.8 | 3.7 | 4.3 | 267 | 20,045 |
South Zone Out-of-Pit | 5.5 | 0.61 | 170 | 0.09 | 0.22 | 0.39 | 3.23 | 242 | 107 | 30,072 | 10.7 | 26.9 | 46.8 | 571 | 42,821 |
North Zone Out-of-Pit | 3.7 | 0.74 | 132 | 0.08 | 0.35 | 0.64 | 3.00 | 225 | 89 | 15,813 | 6.6 | 29.0 | 52.3 | 360 | 26,981 |
Out of Pit Total | 9.2 | 0.66 | 155 | 0.09 | 0.27 | 0.49 | 3.14 | 235 | 197 | 45,885 | 17.3 | 55.9 | 99.0 | 931 | 69,801 |
Vein (S & N) Total | 20.8 | 0.56 | 78 | 0.04 | 0.13 | 0.23 | 1.80 | 135 | 373 | 52,282 | 18.1 | 59.6 | 103.4 | 1,198 | 89,847 |
Low Grade Stockpile | 0.0 | 0.46 | 146 | 0.02 | 0.17 | 0.09 | 2.52 | 189 | 0 | 83 | 0.1 | 1 | 108 | ||
Tailings | 0.1 | 0.27 | 79 | 1.31 | 98 | 1 | 254 | 4 | 323 | ||||||
Total Inferred | 20.9 | 0.56 | 78 | 0.04 | 0.13 | 0.22 | 1.79 | 135 | 373 | 52,619 | 18.1 | 59.7 | 103.4 | 1,204 | 90,277 |
1. Mineral Resources which are not Mineral Reserves, do not have demonstrated economic viability. The estimate of Mineral Resources may be materially affected by environmental,
permitting, legal, title, taxation, socio-political, marketing, or other relevant issues.
2. The Inferred Mineral Resource in this estimate has a lower level of confidence than that applied to an Indicated Mineral Resource and must not be converted to a Mineral Reserve.
It is reasonably expected that the majority of the Inferred Mineral Resource could be upgraded to an Indicated Mineral Resource with continued exploration.
3.The Mineral Resources in this news release were estimated in accordance with the Canadian Institute of Mining, Metallurgy and Petroleum (CIM), CIM Standards on Mineral Resources
and Reserves, Definitions and Guidelines (2014) prepared by the CIM Standing Committee on Reserve Definitions and adopted by the CIM Council and CIM Best Practices (2019).
4. Historically mined areas were depleted from the Mineral Resource model.
5. Approximately 74.7% of the Indicated and 22.3% of the Inferred contained AgEq ounces are pit constrained, with the remainder out-of-pit. See tables 2 and 3 for details of the split
between pit constrained and out-of-pit deposits.
6. The pit constrained AuEq cut-off grade of 0.14 g/t was derived from US$1,800/oz Au price, US$24/oz Ag price, 80% process recovery for Ag and Au, US$5.30/tonne process cost and
US$1.00/tonne G&A cost. The constraining pit optimization parameters were $1.86/t mineralized mining cost, $1.86/t waste mining cost and 50-degree pit slopes.
7. The out-of-pit AuEq cut-off grade of 1.5 g/t AuEq was derived from US$1,800/oz Au price, US$24/oz Ag price, $4.00$/lb Cu, $0.95 $/lb Pb, $1.40 $/lb Zn, 85% process recovery for all
metals, $50/t mining cost, US$20/tonne process and US$4 G&A cost. The out-of-pit Mineral Resource grade blocks were quantified above the 1.5 g/t AuEq cut-off, below the constraining
pit shell within the constraining mineralized wireframes and exhibited sufficient continuity to be considered for cut and fill and long hole mining
8. No Mineral Resources are classified as Measured.
9. AgEq and AuEq calculated at an Ag/Au ratio of 75:1.
10. Totals may not agree due to rounding
Table 2: AuEq Cut-off Sensitivities - Pit Constrained Mineral Resource 1
| Cut-off | Tonnes | Average Grade | Contained Metal | |||||||||||||
| Pit Constrained | (AuEq) | Au | Ag | Cu | Pb | Zn | AuEq | AgEq | Au | Ag | Cu | Pb | Zn | AuEq | AgEq | |
| (g/t) | (M) | (g/t) | (g/t) | (%) | (%) | (%) | (g/t) | (g/t) | (koz) | (koz) | (Mlb) | (Mlb) | (Mlb) | (koz) | (koz) | |
| Indicated | 0.50 | 16.8 | 0.64 | 29 | 0.003 | 0.01 | 0.02 | 1.04 | 77.77 | 344 | 15,615 | 1.0 | 3.9 | 6.7 | 561 | 42,045 |
| 0.45 | 19.2 | 0.60 | 26 | 0.003 | 0.01 | 0.02 | 0.97 | 72.45 | 372 | 16,275 | 1.1 | 4.3 | 7.5 | 598 | 44,820 | |
| 0.40 | 22.3 | 0.56 | 24 | 0.002 | 0.01 | 0.02 | 0.89 | 66.91 | 403 | 16,979 | 1.2 | 4.7 | 8.5 | 639 | 47,929 | |
| 0.35 | 25.6 | 0.53 | 21 | 0.002 | 0.01 | 0.02 | 0.82 | 61.83 | 433 | 17,681 | 1.3 | 5.1 | 9.5 | 679 | 50,956 | |
| 0.30 | 30.0 | 0.48 | 19 | 0.002 | 0.01 | 0.02 | 0.75 | 56.37 | 466 | 18,488 | 1.4 | 5.6 | 10.8 | 725 | 54,368 | |
| 0.25 | 34.5 | 0.45 | 17 | 0.002 | 0.01 | 0.02 | 0.69 | 51.71 | 495 | 19,159 | 1.6 | 6.1 | 12.1 | 764 | 57,336 | |
| 0.20 | 38.7 | 0.42 | 16 | 0.002 | 0.01 | 0.02 | 0.64 | 47.93 | 518 | 19,659 | 1.7 | 6.6 | 13.2 | 795 | 59,618 | |
| 0.14 | 43.0 | 0.39 | 15 | 0.002 | 0.01 | 0.02 | 0.59 | 44.40 | 535 | 20,049 | 1.8 | 7.0 | 14.3 | 818 | 61,381 | |
| 0.10 | 45.8 | 0.37 | 14 | 0.002 | 0.01 | 0.01 | 0.56 | 42.25 | 543 | 20,215 | 1.9 | 7.2 | 15.0 | 829 | 62,183 | |
| 0.05 | 48.4 | 0.35 | 13 | 0.002 | 0.01 | 0.01 | 0.54 | 40.25 | 548 | 20,320 | 1.9 | 7.4 | 15.6 | 836 | 62,673 | |
| Inferred | 0.50 | 5.4 | 0.75 | 31 | 0.005 | 0.02 | 0.02 | 1.19 | 88.89 | 131 | 5,371 | 0.6 | 2.9 | 2.1 | 206 | 15,443 |
| 0.45 | 5.9 | 0.72 | 29 | 0.005 | 0.02 | 0.02 | 1.12 | 84.22 | 136 | 5,511 | 0.6 | 3.0 | 2.3 | 214 | 16,037 | |
| 0.40 | 6.6 | 0.67 | 27 | 0.004 | 0.02 | 0.02 | 1.05 | 78.62 | 144 | 5,662 | 0.6 | 3.1 | 2.6 | 223 | 16,762 | |
| 0.35 | 7.5 | 0.63 | 24 | 0.004 | 0.02 | 0.02 | 0.97 | 72.64 | 152 | 5,829 | 0.7 | 3.2 | 2.9 | 234 | 17,568 | |
| 0.30 | 8.6 | 0.58 | 22 | 0.004 | 0.02 | 0.02 | 0.89 | 66.57 | 160 | 5,999 | 0.7 | 3.4 | 3.4 | 246 | 18,413 | |
| 0.25 | 9.8 | 0.53 | 20 | 0.004 | 0.02 | 0.02 | 0.81 | 60.87 | 168 | 6,204 | 0.8 | 3.5 | 3.8 | 256 | 19,221 | |
| 0.20 | 10.7 | 0.50 | 18 | 0.003 | 0.02 | 0.02 | 0.76 | 57.18 | 173 | 6,324 | 0.8 | 3.6 | 4.1 | 263 | 19,715 | |
| 0.14 | 11.5 | 0.47 | 17 | 0.003 | 0.01 | 0.02 | 0.72 | 54.10 | 176 | 6,396 | 0.8 | 3.7 | 4.3 | 267 | 20,045 | |
| 0.10 | 11.8 | 0.47 | 17 | 0.003 | 0.01 | 0.02 | 0.71 | 53.06 | 177 | 6,415 | 0.8 | 3.7 | 4.4 | 268 | 20,124 | |
| 0.05 | 12.0 | 0.46 | 17 | 0.003 | 0.01 | 0.02 | 0.70 | 52.14 | 177 | 6,422 | 0.8 | 3.7 | 4.5 | 269 | 20,167 | |
- See Table 1 notes for assumptions
Table 3: AuEq Cut-off Sensitivities - Out-of-Pit Mineral Resource 1
Cut-off | Tonnes | Average Grade | Contained Metal | |||||||||||||
| Out of Pit | (AuEq) | Au | Ag | Cu | Pb | Zn | AuEq | AgEq | Au | Ag | Cu | Pb | Zn | AuEq | AgEq | |
(g/t) | (M) | (g/t) | (g/t) | (%) | (%) | (%) | (g/t) | (g/t) | (koz) | (koz) | (Mlb) | (Mlb) | (Mlb) | (koz) | (koz) | |
South Zone-Indicated | 5.0 | 0.4 | 0.46 | 426 | 0.46 | 1.39 | 2.45 | 8.27 | 620 | 6 | 5,291 | 3.9 | 11.8 | 20.9 | 103 | 7,699 |
4.5 | 0.5 5 | 0.45 | 398 | 0.42 | 1.28 | 2.29 | 7.71 | 579 | 7 | 5,849 | 4.2 | 12.9 | 23.1 | 114 | 8,514 | |
4.0 | 0.6 | 0.43 | 369 | 0.38 | 1.18 | 2.12 | 7.15 | 536 | 8 | 6,479 | 4.6 | 14.2 215.6 | 25.6 | 126 | 9,422 | |
3.5 | 0.7 | 0.40 | 339 | 0.35 | 1.07 | 1.91 | 6.56 | 492 | 9 | 7,218 | 5.1 | 15.6 | 27.9 | 140 | 10,462 | |
3.0 | 0.8 | 0.38 | 310 | 0.31 | 0.96 | 1.71 | 5.97 | 447 | 10 | 8,015 | 5.5 | 17.0 | 30.3 | 154 | 11,570 | |
2.5 | 1.0 | 0.35 | 279 | 0.27 | 0.84 | 1.50 | 5.36 | 402 | 11 | 8,894 | 5.9 | 18.4 | 32.7 | 171 | 12,798 | |
2.0 | 1.3 | 0.32 | 244 | 0.23 | 0.72 | 1.28 | 4.66 | 350 | 13 | 9,992 | 6.5 | 20.4 | 35.9 | 191 | 14,334 | |
1.5 | 1.8 | 0.28 | 201 | 0.18 | 0.59 | 1.02 | 3.83 | 287 | 16 | 11,453 | 7.2 | 23.1 | 40.1 | 219 | 16,403 | |
1.0 | 2.8 | 0.26 | 147 | 0.13 | 0.43 | 0.74 | 2.86 | 214 | 24 | 13,409 | 8.2 | 27.0 | 45.9 | 260 | 19,517 | |
South Zone-Inferred | 5.0 | 0.8 | 0.80 | 375 | 0.21 | 0.50 | 0.86 | 6.60 | 495 | 20 | 9,224 | 3.5 | 8.4 | 14.5 | 163 | 12,192 |
4.5 | 1.2 | 0.66 | 345 | 0.17 | 0.46 | 0.79 | 5.99 | 449 | 25 | 12,898 | 4.5 | 11.8 | 20.3 | 224 | 16,780 | |
4.0 | 1.4 | 0.68 | 325 | 0.17 | 0.46 | 0.78 | 5.71 | 429 | 30 | 14,409 | 5.0 | 14.0 | 23.7 | 253 | 18,993 | |
3.5 | 1.6 | 0.70 | 300 | 0.15 | 0.45 | 0.77 | 5.38 | 404 | 37 | 15,999 | 5.6 | 16.3 | 28.1 | 287 | 21,495 | |
3.0 | 2.4 | 0.60 | 269 | 0.14 | 0.36 | 0.62 | 4.75 | 356 | 47 | 20,765 | 7.5 | 18.8 | 33.0 | 368 | 27,564 | |
2.5 | 3.0 | 0.70 | 235 | 0.12 | 0.31 | 0.54 | 4.34 | 326 | 68 | 22,922 | 8.3 | 20.7 | 36.3 | 422 | 31,684 | |
2.0 | 3.8 | 0.67 | 210 | 0.11 | 0.27 | 0.48 | 3.91 | 293 | 82 | 25,649 | 9.3 | 22.8 | 39.9 | 478 | 35,825 | |
1.5 | 5.5 | 0.61 | 170 | 0.09 | 0.22 | 0.39 | 3.23 | 242 | 107 | 30,072 | 10.7 | 26.9 | 46.8 | 571 | 42,821 | |
1.0 | 10.4 | 0.48 | 116 | 0.06 | 0.17 | 0.29 | 2.28 | 171 | 162 | 38,814 | 14.4 | 39.1 | 65.7 | 767 | 57,529 | |
North Zone-Indicated | 5.0 | 0.1 | 1.98 | 382 | 0.08 | 0.56 | 1.08 | 7.83 | 587 | 5 | 1,018 | 0.1 | 1.0 0 | 2.0 | 21 | 1,564 |
4.5 | 0.1 | 1.76 | 359 | 0.07 | 0.57 | 1.09 | 7.31 | 548 | 6 | 1,151 | 0.2 | 1.2 | 2.4 | 23 | 1,755 | |
4.0 | 0.1 | 1.59 59 | 332 | 0.07 | 0.54 | 1.05 | 6.74 | 505 | 6 | 1,302 | 0.2 | 1.5 | 2.8 | 27 | 1,984 | |
3.5 | 0.2 | 1.38 | 297 | 0.06 | 0.53 | 1.01 | 6.03 | 452 | 7 | 1,522 | 0.2 | 1.9 | 3.9 | 31 | 2,322 | |
3.0 | 0.2 | 1.16 | 259 | 0.05 | 0.53 | 1.02 | 5.30 | 398 | 8 | 1,805 | 0.3 | 2.5 | 4.9 | 37 | 2,769 | |
2.5 | 0.3 | 1.00 | 226 | 0.05 | 0.53 | 1.04 | 4.70 | 352 | 9 | 2,060 | 0.3 | 3.3 | 6.5 | 43 | 3,211 | |
2.0 | 0.4 | 0.85 | 192 | 0.04 | 0.47 | 0.93 | 4.02 | 301 | 11 | 2,404 | 0.3 | 4.1 | 8.0 | 50 | 3,784 | |
1.5 | 0.5 | 0.72 | 158 | 0.04 | 0.41 | 0.80 | 3.36 | 252 | 13 | 2,777 | 0.4 | 4.9 | 9.7 | 59 | 4,435 | |
1.0 | 0.9 | 0.57 | 116 | 0.03 | 0.31 | 0.61 | 2.52 | 189 | 16 | 3,349 | 0.5 | 6.2 | 11.9 | 72 | 5,433 | |
North Zone-Inferred | 5.0 | 0.4 | 2.12 | 339 | 0.04 | 0.13 | 0.23 | 6.83 | 512 | 26 | 4,171 | 0.3 | 1.1 | 1.9 | 84 | 6,304 |
4.5 | 0.4 | 2.05 | 324 | 0.04 | 0.15 | 0.23 | 6.58 | 493 | 29 | 4,544 | 0.3 | 1.4 | 2.2 | 92 | 6,909 | |
4.0 | 0.5 | 1.91 | 301 | 0.03 | 0.16 | 0.23 | 6.12 | 459 | 33 | 5,228 | 0.4 | 1.9 | 2.8 | 106 | 7,975 | |
3.5 | 0.9 | 1.54 | 264 | 0.03 | 0.16 | 0.21 | 5.25 | 393 | 43 | 7,328 | 0.6 | 3.0 | 3.9 | 145 | 10,905 | |
3.0 | 1.5 | 1.12 | 203 | 0.07 | 0.41 | 0.82 | 4.42 | 332 | 54 | 9,756 | 2.4 | 13.6 | 27.1 | 212 | 15,913 | |
2.5 | 1.9 | 1.06 | 187 | 0.06 | 0.37 | 0.73 | 4.07 | 305 | 64 | 11,318 | 2.6 | 15.6 | 30.4 | 247 | 18,490 | |
2.0 | 2.5 | 0.95 | 166 | 0.05 | 0.35 | 0.67 | 3.64 | 273 | 75 | 13,114 | 2.9 | 18.7 | 36.1 | 287 | 21,560 | |
1.5 | 3.7 | 0.74 | 132 | 0.08 | 0.35 | 0.64 | 3.00 | 225 | 89 | 15,813 | 6.6 | 29.0 | 52.3 | 360 | 26,981 | |
1.0 | 4.7 | 0.65 | 115 | 0.07 | 0.31 | 0.55 | 2.62 | 197 | 100 | 17,524 | 7.6 | 32.4 | 57.7 | 400 | 29,979 | |
- See Table 1 notes for assumptions
Qualified Persons
Dave Duncan P. Geo., VP Exploration of Silver Tiger, Charles Spath, P. Geo., VP of Technical Services of Silver Tiger, and Eugene Puritch, P.Eng., FEC, CET, President of P&E Mining Consultants are the Qualified Persons as defined under National Instrument 43-101. Mr. Duncan, Mr. Spath and Mr. Puritch have reviewed and approved the scientific and technical information in this press release.
About Silver Tiger and the El Tigre Historic Mine District
Silver Tiger Metals Inc. is a Canadian company whose management has more than 25 years' experience discovering, financing and building large epithermal silver projects in Mexico. Silver Tiger's 100% owned 28,414 hectare Historic El Tigre Mining District is located in Sonora, Mexico. Principled environmental, social and governance practices are core priorities at Silver Tiger.
The El Tigre historic mine district is located in Sonora, Mexico and lies at the northern end of the Sierra Madre silver and gold belt which hosts many epithermal silver and gold deposits, including Dolores, Santa Elena and Las Chispas at the northern end. In 1896, gold was first discovered on the property in the Gold Hill area and mining started with the Brown Shaft in 1903. The focus soon changed to mining high-grade silver veins in the area with production coming from 3 parallel veins the El Tigre Vein, the Seitz Kelley Vein and the Sooy Vein. Underground mining on the middle El Tigre Vein extended 1,450 metres along strike and was mined on 14 levels to a depth of approximately 450 metres. The Seitz Kelley Vein was mined along strike for 1 kilometre to a depth of approximately 200 meters. The Sooy Vein was only mined along strike for 250 metres to a depth of approximately 150 metres. Mining abruptly stopped on all 3 of these veins when the price of silver collapsed to less than 20¢ per ounce with the onset of the Great Depression. By the time the mine closed in 1930, it is reported to have produced a total of 353,000 ounces of gold and 67.4 million ounces of silver from 1.87 million tons (Craig, 2012). The average grade mined during this period was over 2 kilograms silver equivalent per ton.
For further information, please contact:
Glenn Jessome
President and CEO
902 492 0298
jessome@silvertigermetals.com
CAUTIONARY STATEMENT:
Neither TSX Venture Exchange nor its Regulation Services Provider (as that term is defined in the policies of the TSX Venture Exchange) accepts responsibility for the adequacy or accuracy of this release.
This News Release includes certain "forward-looking statements". All statements other than statements of historical fact included in this release, including, without limitation, statements regarding potential mineralization, Mineral Resources and Reserves, the ability to convert Inferred Mineral Resources to Indicated Mineral Resources, the ability to complete future drilling programs and infill sampling, the ability to extend resource blocks, the similarity of mineralization at El Tigre to Delores, Santa Elena and Chispas, exploration results, and future plans and objectives of Silver Tiger, are forward-looking statements that involve various risks and uncertainties. Forward-looking statements are frequently characterized by words such as "may", "is expected to", "anticipates", "estimates", "intends", "plans", "projection", "could", "vision", "goals", "objective" and "outlook" and other similar words. Although Silver Tiger believes the expectations expressed in such forward-looking statements are based on reasonable assumptions, there can be no assurance that such statements will prove to be accurate and actual results and future events could differ materially from those anticipated in such statements. Important factors that could cause actual results to differ materially from Silver Tiger's expectations include risks and uncertainties related to exploration, development, operations, commodity prices and global financial volatility, risk and uncertainties of operating in a foreign jurisdiction as well as additional risks described from time to time in the filings made by Silver Tiger with securities regulators.
SOURCE: Silver Tiger Metals Inc.
https://www.accesswire.com/783087/silver-tiger-announces-updated-mineral-resource-estimate-for-the-el-tigre-silver-gold-project
