July same-store sales increased 5.8% year-over-year
NEWARK, N.J., Aug. 07, 2025 (GLOBE NEWSWIRE) -- NRSInsights, a provider of sales data and analytics drawn from retail transactions processed through the National Retail Solutions (NRS) point-of-sale (POS) platform, today announced comparative retail same-store sales results for July 2025.
As of July 31, 2025, the NRS retail network comprised approximately 37,200 active terminals nationwide, scanning purchases at approximately 32,100 independent retailers including convenience stores, bodegas, liquor stores, grocers, and tobacco and sundries sellers, predominantly serving urban consumers.
July Highlights*
(*Same-store sales, unit sales, transactions, and average price data refer to July 2025 and are compared to July 2024 unless otherwise noted. All comparisons are provided on a "per calendar day" basis to remove from consideration variability in the number of days per month or three-month period.)
- SALES

- Same-store sales increased 5.8% year-over-year. In the previous month (June 2025), same-store sales increased 3.5% year-over-year.
- Same-store sales increased 0.3% compared to the previous month (June 2025). Same-store sales in June 2025 were unchanged compared to the previous month (May 2025).
- For the three months ended July 31, 2025, same-store sales increased 4.2% compared to the corresponding three months a year ago.
- UNITS SOLD
- Units sold increased 3.2% year-over-year. In the previous month (June 2025), units sold increased 3.0% year-over-year.
- Units sold decreased 1.5% compared to the previous month (June 2025). Units sold in June 2025 increased 0.7% compared to the previous month (May 2025).
- BASKETS (TRANSACTIONS) PER STORE
- Baskets increased 1.5% year-over-year. In the previous month (June 2025), baskets were unchanged year-over-year.
- Baskets decreased 0.4% compared to the previous month (June 2025). Baskets in June 2025 increased 0.6% compared to the previous month (May 2025).
- AVERAGE PRICES
- A dollar-weighted average of prices for the top 500 items purchased increased 2.9% year-over-year, a higher rate of increase than the 2.7% year-over-year increase recorded in June 2025.
Retail Trade Comparative Data
The table below provides historical comparative data with the U.S. Commerce Department's Advance Monthly Retail Trade same-store sales data excluding food service:
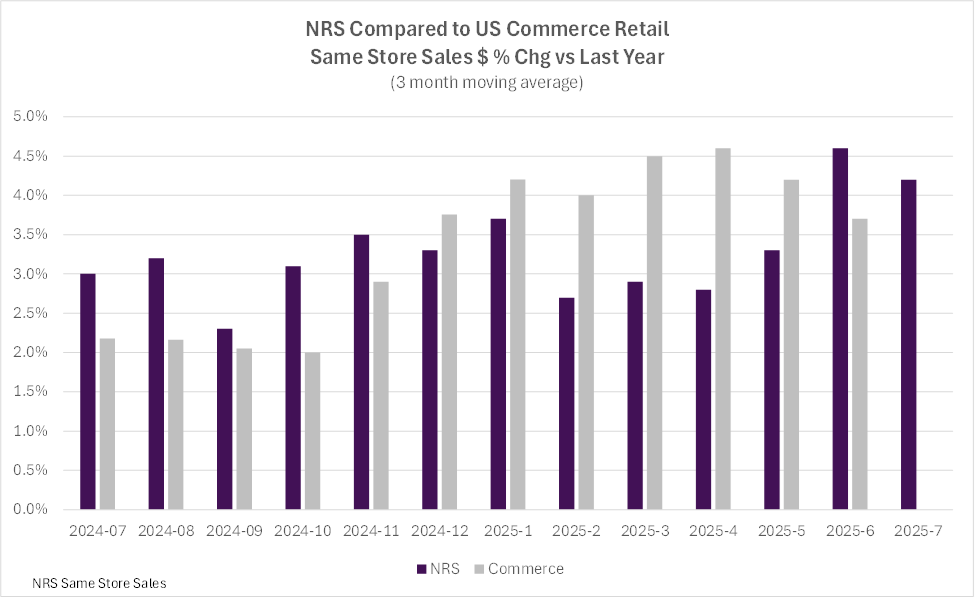
Over the past twelve months, the US Commerce Department's Advance Monthly Retail Trade data, excluding food services, outpaced the NRS network's three-month moving average same-store sales by 0.2% on average. In June, the NRS network's three-month rolling average increase exceeded the US Commerce Department's by 0.9%.
The NRSInsights data in the chart above have not been adjusted to reflect inflation, demographic distributions, seasonal buying patterns, item substitution, days per month, or other factors that may facilitate comparisons to other periods, to other same-store retail sales data, or to the U.S. Commerce Department's retail data.
Commentary from Brandon Thurber (VP, Data Sales & Client Success at NRS)
"Independent retailers performed extremely well in July. Sales increased by 5.8% versus last year - the highest rate of increase in over a year, and a robust increase even after taking into account the 2.9% year-over-year increase in the average price of top selling items.
"Beverage performance helped drive the expansion. Energy drinks, soft drinks, and both sparkling and seltzer waters all delivered solid gains. Sports drinks were stable year-over-year and up month-over-month.
"Shifts in consumer behavior spurred continued growth in prepared cocktails, modern oral nicotine, and performance and nutrition shakes, while certain snack categories remained under pressure."
NRSInsights Reports
The NRSInsights monthly Same-Store Retail Sales Reports are intended to provide timely topline data reflective of sales at NRS' network of independent, predominantly urban, retail stores.
Same-store data comparisons of July 2025 with July 2024 are derived from approximately 226 million transactions processed through the approximately 23,000 stores on the NRS network that scanned transactions in both months. Same-store data comparisons of July 2025 with June 2025 are derived from approximately 278 million transactions processed through approximately 31,000 stores.
Same-store data comparisons for the three months ended July 31, 2025 with the year-ago three months are derived from approximately 649 million scanned transactions processed through those stores that scanned transactions in both three-month periods.
NRS POS Platform
The NRS platform predominantly serves small-format, independent, retail stores nationwide including convenience stores, bodegas, liquor stores, grocers, and tobacco and sundries sellers. These independent retailers operate in all 50 states as well as the District of Columbia, and in 205 of the 210 designated market areas (DMAs) in the United States. During July 2025, NRS' POS terminals processed $2.1 billion in sales (+18% year-over-year) across 145 million transactions.
About National Retail Solutions (NRS):
National Retail Solutions operates the largest point-of-sale (POS) terminal-based platform and digital payment processing service for independent retailers nationwide. Retailers utilize NRS offerings to process transactions and effectively manage their businesses. Consumer packaged goods (CPG) suppliers, brokers, analytics firms, and advertisers access the terminal's digital display network to reach these retailers' predominantly urban, multi-cultural shopper base, and to harness transaction data-based learnings to identify growth opportunities and measure execution and returns on marketing investment. NRS is a subsidiary of IDT Corporation (NYSE: IDT).
All statements above that are not purely about historical facts, including, but not limited to, those in which we use the words "believe," "anticipate," "expect," "plan," "intend," "estimate," "target" and similar expressions, are forward-looking statements within the meaning of the Private Securities Litigation Reform Act of 1995. While these forward-looking statements represent our current judgment of what may happen in the future, actual results may differ materially from the results expressed or implied by these statements due to numerous important factors. Our filings with the SEC provide detailed information on such statements and risks, and should be consulted along with this release. To the extent permitted under applicable law, IDT assumes no obligation to update any forward-looking statements.
NRSInsights Contact:
Brandon Thurber
VP, Data Sales & Client Success at NRS
National Retail Solutions
Brandon.Thurber@nrsplus.com
IDT Corporation Contact:
Bill Ulrey
william.ulrey@idt.net
# # #

