


Key findings from TransUnion report:
- Inflation continues to be a key driver of the growth in consumer balances over the last three years, with average non-mortgage balances rising 10% since 2022
- Home affordability remains a challenge as average new mortgage sizes climbed 6.9% year-over-year, driven by renewed housing demand
- Regional disparities in cost of living and wage growth contributed to varying delinquency trends across Canadian provinces; Alberta saw the highest level of serious delinquency (90+ days past due), rising 11 basis points to 2.29%
TORONTO, Aug. 13, 2025 (GLOBE NEWSWIRE) -- New data from TransUnion shows that total Canadian consumer credit balances reached $2.52 trillion in Q2 2025, up 4.4% year-over-year (YoY) according to TransUnion's Q2 2025 Credit Industry Insights Report (CIIR). That marks a 15% increase since Q1 2022, which aligns with the onset of rising inflation rates in Canada. Once inflation is factored in,1 however, the actual increase was just 3% (or $0.08 trillion), meaning that while debt levels have climbed, real growth in what Canadians owe was more modest than it appears.
While the average consumer total balance increased by 7% from Q1 2022 to Q2 2025, non-mortgage debt declined by 10%, a sign that rising mortgage costs are taking up more financial space in household budgets. The impact isn't felt equally: when adjusted for inflation, Canadians in the prime and above tiers saw the largest declines in their balances, with the super prime tier dropping nearly 33%. In contrast, subprime consumers saw their inflation-adjusted average balances grow by 15%, highlighting that rising costs are hitting lower-income households the hardest.
"Subprime consumers are more likely to feel the impact of higher costs of living and may choose to take on additional debt, such as credit card balances, to help cover the costs of goods and services," said Matt Fabian, director of financial services research and consulting at TransUnion Canada. "For other risk tiers of borrowers, their card balance growth has been less than the rate of inflation, indicating that these consumers are less reliant on credit cards to maintain purchasing power."
| Average Consumer Non-Mortgage Balance Change - Nominal and Inflation-Adjusted | ||||
| % Nominal dollar change Q2 2022 to Q2 2025 | % Real dollar change Q2 2022 to Q2 2025 - Inflation adjusted | |||
| Super prime | -20.7 | % | -32.7 | % |
| Prime plus | -9.3 | % | -21.3 | % |
| Prime | -9.0 | % | -21.0 | % |
| Near prime | 8.1 | % | -3.9 | % |
| Subprime | 26.9 | % | 14.9 | % |
There continues to be regional disparity in non-mortgage debt levels, with P.E.I. and B.C. continuing to report the highest average debt levels, while Quebec and Manitoba remain at the bottom. Although the gap between the highest debt provinces and the lowest isn't wide, that difference could potentially impact delinquency rates in higher debt provinces, especially during economic downturns.
| Average Consumer Non-Mortgage Debt Balance by Province | ||||||
| Q2 2024 | Q2 2025 | Y/Y Change | ||||
| Canada | $ | 26,124 | $ | 26,845 | 2.8 | % |
| PEI | $ | 28,143 | $ | 29,677 | 5.5 | % |
| BC | $ | 28,067 | $ | 29,082 | 3.6 | % |
| NL | $ | 28,103 | $ | 29,013 | 3.2 | % |
| AB | $ | 28,407 | $ | 28,688 | 1.0 | % |
| ON | $ | 27,296 | $ | 28,063 | 2.8 | % |
| SK | $ | 26,950 | $ | 27,313 | 1.3 | % |
| NS | $ | 24,520 | $ | 25,053 | 2.2 | % |
| NB | $ | 23,999 | $ | 24,879 | 3.7 | % |
| QC | $ | 22,463 | $ | 23,131 | 3.0 | % |
| MB | $ | 20,418 | $ | 21,216 | 3.9 | % |
Improved Economic Conditions Fuel Mortgage Market Growth
Canada's housing market is showing early signs of a rebound, driven by lower interest rates and renewed demand from buyers who were previously priced out of the market. Mortgage originations (new mortgages) surged 51% YoY in Q1 2025, reaching $82.6 billion in new volume. Despite broader economic uncertainty, market activity has picked up, driven by falling rates and regulatory changes introduced in 2024.
Millennials, many of whom are first-time home buyers, drove housing demand, accounting for 41% of all new mortgages. Gen Z, while still a smaller share at 8%, was the fastest growing group, with 66% YoY origination growth. As affordability improves, more buyers may enter the market, but rising home prices may require larger down payments and/or force some to accept longer loan terms and higher cumulative interest costs over the life of their mortgage in order to manage monthly payment amounts.
The average new mortgage loan amount rose 6.9% YoY to $368,432, underscoring the ongoing affordability challenges facing homebuyers. Both Ontario and British Columbia saw average new mortgage loan sizes above the national average, driven largely by persistently high prices in Toronto and Vancouver, Canada's most expensive housing markets.
| Ranking Average New Mortgage Loan Size by Province | ||||||
| Q1 2024 | Q1 2025 | Q1'24-Q1'25 | ||||
| Canada | $ | 344,550 | $ | 368,432 | 6.9 | % |
| BC | $ | 468,214 | $ | 503,435 | 7.5 | % |
| ON | $ | 437,540 | $ | 458,124 | 4.7 | % |
| AB | $ | 333,876 | $ | 356,384 | 6.7 | % |
| NS | $ | 244,479 | $ | 263,606 | 7.8 | % |
| MB | $ | 248,317 | $ | 262,518 | 5.7 | % |
| SK | $ | 236,957 | $ | 257,481 | 8.7 | % |
| PEI | $ | 228,029 | $ | 245,582 | 7.7 | % |
| QC | $ | 211,604 | $ | 237,730 | 12.4 | % |
| NL | $ | 215,601 | $ | 232,225 | 7.7 | % |
| NB | $ | 195,881 | $ | 217,257 | 10.9 | % |
Additionally, more than two million Canadian mortgages are set to renew between 2025 and 2026, many of which were originally secured at ultra-low interest rates near 1%.2 As these loans reset, borrowers will likely face significantly higher monthly payments, with the latest data showing the average monthly payment up 4.7%, just over $100 per month, for the average consumer in Q2 2025.
Consumer-level serious mortgage delinquency rates (60 or more days past due) rose again in Q2 2025 to 0.27%, up 3 bps from prior year. However, the overall delinquency rate continues to remain low by historical comparisons.
"Many homeowners have some flexibility to temper increases in their monthly mortgage payment, whether through extended amortization periods, refinancing or pre-paying," said Fabian. "Canadian lenders remain in a very strong capital position to support consumers through short periods of potential hardship."
Slight Rise in Serious Delinquencies with Noticeable Regional Variances
The overall consumer-level serious delinquency rate (90 days or more delinquent on any product in wallet) has grown slightly, up 4 basis points to 1.77%. This level is consistent with those observed prior to the pandemic. Given the increase in credit activity and participation in Canada, this corresponding increase in delinquency is expected.
Differences in cost of living and wage growth across provinces have a significant impact on resilience, which varies by region. Alberta saw the highest level of serious consumer delinquency rate in Q2 2025, up 11 basis points from prior year to 2.29%. Quebec remained the least delinquent province overall; however, it saw a 3-basis point increase in delinquency YoY, potentially driven in part by elevated unemployment. Notably, six provinces saw decreases in delinquencies over the past year.
| Ranking Consumer Total Delinquency Rate (90+ Days Past Due) on All Products by Province | ||||||||
| Q2 2022 | Q2 2024 | Q2 2025 | YoY Change in Basis Points | 3-Year Change in Basis Points | ||||
| Canada | 1.41 | % | 1.74 | % | 1.77 | % | 4 | 36 |
| AB | 2.00 | % | 2.18 | % | 2.29 | % | 11 | 29 |
| NB | 1.93 | % | 2.03 | % | 1.96 | % | -6 | 3 |
| MB | 1.69 | % | 2.03 | % | 1.93 | % | -10 | 24 |
| NS | 1.83 | % | 1.96 | % | 1.92 | % | -5 | 9 |
| ON | 1.36 | % | 1.83 | % | 1.90 | % | 7 | 54 |
| SK | 1.84 | % | 1.96 | % | 1.78 | % | -18 | -6 |
| NL | 1.75 | % | 1.87 | % | 1.71 | % | -16 | -4 |
| PEI | 1.52 | % | 1.74 | % | 1.69 | % | -5 | 17 |
| BC | 1.55 | % | 1.66 | % | 1.68 | % | 2 | 13 |
| QC | 0.88 | % | 1.24 | % | 1.27 | % | 3 | 39 |
"Despite encouraging signs of economic recovery and easing inflation, the Canadian credit market remains fragile," Fabian said. "Financial institutions must remain vigilant, particularly as mortgage renewals accelerate and regional economic pressures mount. Lenders would be prudent to adopt proactive risk management strategies and support consumers through this transitional period."
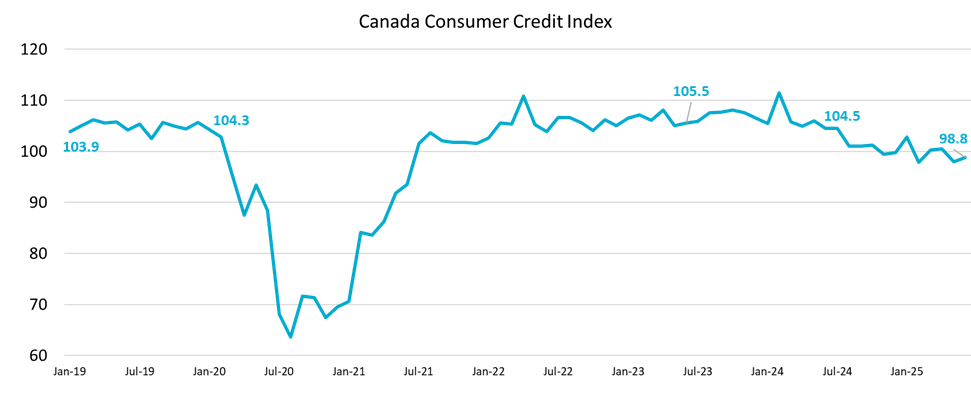
Consumer Credit Index Continues to Decline Amid Economic Uncertainty
In Q2 2025, Canada's Consumer Credit Industry Index (CII) declined by 1.4 points from the previous quarter to 98.8, marking a 6-point drop YoY. This slide reflects softening consumer spending amid rising cost-of-living pressures and subdued credit demand. Higher delinquency rates and slower repayment activity point to ongoing financial stress among households, while broader macroeconomic uncertainty is eroding consumer confidence and purchasing power. The decline in the CII underscores the need for close monitoring of credit risk and consumer resilience as the Canadian economy navigates a challenging post-pandemic recovery phase.
ENDS
About TransUnion (NYSE: TRU)
TransUnion is a global information and insights company with over 13,000 associates operating in more than 30 countries, including Canada, where we're the credit bureau of choice for the financial services ecosystem and most of Canada's largest banks. We make trust possible by ensuring each person is reliably represented in the marketplace. We do this by providing an actionable view of consumers, stewarded with care.
Through our acquisitions and technology investments we have developed innovative solutions that extend beyond our strong foundation in core credit into areas such as marketing, fraud, risk and advanced analytics. As a result, consumers and businesses can transact with confidence and achieve great things. We call this Information for Good® - and it leads to economic opportunity, great experiences and personal empowerment for millions of people around the world.
For more information visit: www.transunion.ca
For more information or to request an interview, contact:
Contact: Katie Duffy
E-mail: katie.duffy@ketchum.com
Telephone: +1 647-772-0969
1 12% inflation between Q1 2022 and Q2 2025 as calculated as the cumulative Consumer Price Index increase as measured by Statistics Canada.
2 Canada Mortgage and Housing Corporation. 2025, June 7. Canada's Mortgage Market: Trends, Risks and Opportunities. https://www.cmhc-schl.gc.ca/observer/2025/canada-mortgage-market-trends-risks-and-opportunities
An infographic accompanying this announcement is available at https://www.globenewswire.com/NewsRoom/AttachmentNg/45fa68c9-6df8-4b3f-a376-2ee9f2ec7edf
