


ROGERS, Ark., Sept. 04, 2025 (GLOBE NEWSWIRE) -- America's Car-Mart, Inc. (NASDAQ: CRMT) ("we," "Car-Mart" or the "Company"), today reported financial results for the first quarter ended July 31, 2025.
First Quarter Key Highlights (FY'26 Q1 vs. FY'25 Q1, unless otherwise noted)
|
President and CEO Doug Campbell commentary:
Our strategic investments are delivering measurable results. From a consumer demand standpoint, application volume was up over 10%. We deployed and implemented LOS V2 in the beginning of the quarter, which has a more advanced underwriting scorecard, and the enablement of risk-based pricing embedded within the tool. This functionality is now live across our entire footprint, excluding our acquisitions. Additionally, we have started to see the rapid adoption of new functionality within Pay Your Way, our upgraded consumer-facing collections platform. Since the upgrade of Pay Your Way in late June 2025, we have driven a shift from customers paying in-store to paying online, which improves customer convenience and builds the foundation for more consistent payment behavior. Additionally, we have nearly doubled the number of customers enrolled in recurring payments, creating more predictable cash flows, and reducing collection costs.
Within the current market environment, we are prudently managing sales to balance affordability, profit margins, and portfolio quality. During the quarter wholesale prices rose resulting in each unit of inventory consuming more of our borrowing capacity, which places some limits on how much inventory we can carry. We are actively working to improve these capacity constraints to better serve the customer demand we are experiencing.
We are successfully executing on our focus to improve the quality of our portfolio. During the quarter credit applications from our customers that fall within on our top three customer credit rankings grew by 790 basis points, or 15% during the quarter when compared against fiscal year 2025 average. Nearly 72% of our portfolio is now operating under enhanced underwriting standards. With the recent launch of LOS V2, we continue to sharpen our underwriting capability and are very optimistic about the opportunity to sell more cars to better customers creating a stronger foundation for sustainable returns.
| First Quarter Fiscal Year 2026 Key Operating Metrics |
Dollars in thousands, except per share data. Dollar and percentage changes may not recalculate due to rounding. Charts may not be to scale.
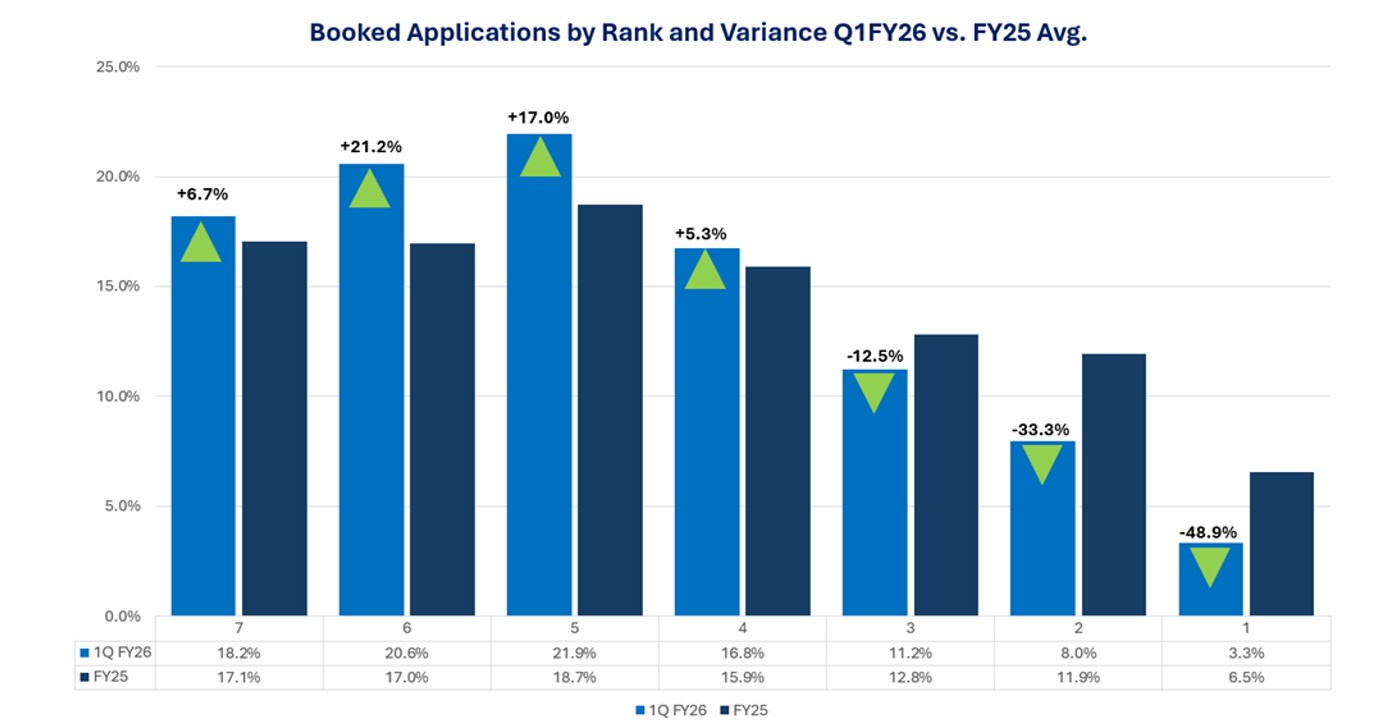
During the quarter we deployed and implemented LOS V2. This rollout had two primary new features, an updated more predictive scorecard and the enablement of risk-based pricing. The new scorecard more accurately identifies risk by assigning ranks to customers with better granularity. The above chart reflects applications booked during the quarter when compared to booked sales in fiscal year 2025. The shift towards the higher ranked customers was dramatic with 15% more customers booked in ranks 5-7 which have lower probability of loss and stronger overall returns when compared to the lower ranking customers.
| First Quarter Business Review |
Note: Discussions in each section provide information for the first quarter of fiscal year 2026, compared to the first quarter of fiscal year 2025, unless otherwise noted.
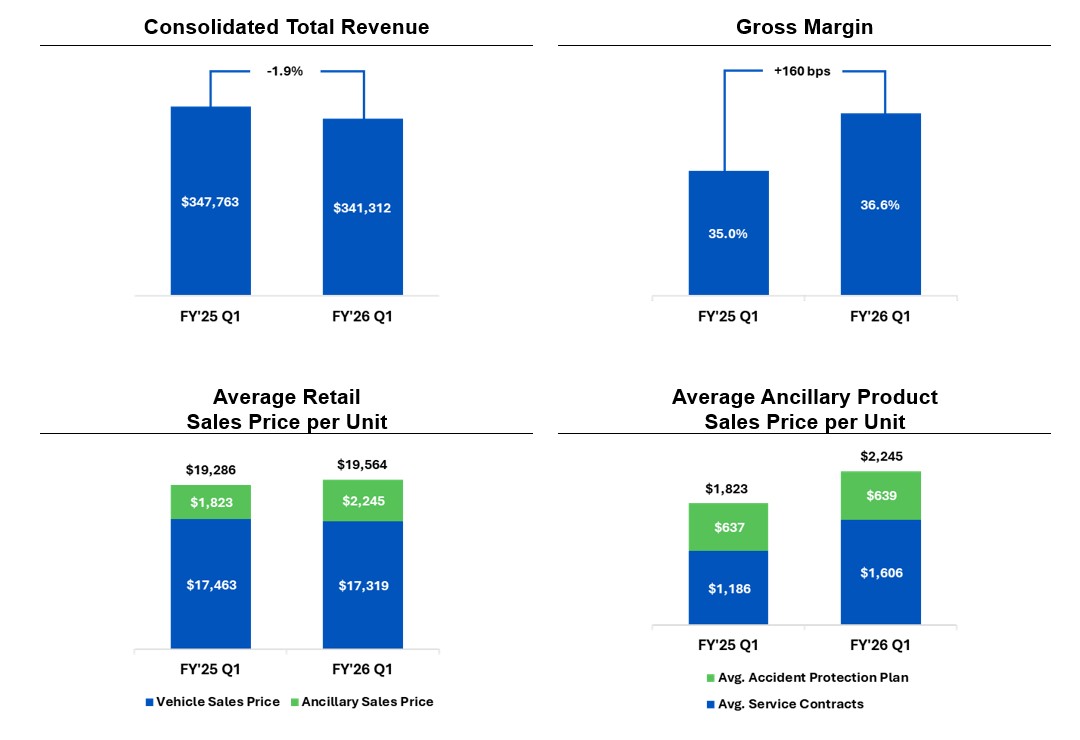
TOTAL REVENUE - Total revenue for the quarter was $341.3 million, a decrease of 1.9% from the prior year, driven by fewer retail units sold. This was partially offset by gross margin improvements on average selling price and a 7.5% increase in interest income from a larger portfolio.
SALES - Customer demand was elevated, as evidenced by a 10% year-over-year increase in credit applications. The new scorecard embedded in LOS V2, which went live during the quarter prioritized booking the Company's strongest-performing customer rankings. However, sales volumes declined 5.7% to 13,568 units compared to 14,391 in the prior year, primarily driven by fewer units available for sale. The Company experienced a 5.2% increase in the cost of procurement, which put pressure on the capacity for inventory tied to the Company's capital structure. The Company prioritized vehicle quality aimed at controlling repair costs downstream and selling to a better credit quality customer.
GROSS PROFIT - Gross profit margin as a percentage of sales reached 36.6% vs. 35.0%, reflecting a 160-basis point improvement year-over-year and 20 basis-point improvement when viewed sequentially. These gains were driven by continued efforts in vehicle pricing, strong ancillary product attachment rates, reduced repairs in both frequency and severity and improved rates on wholesale retention.
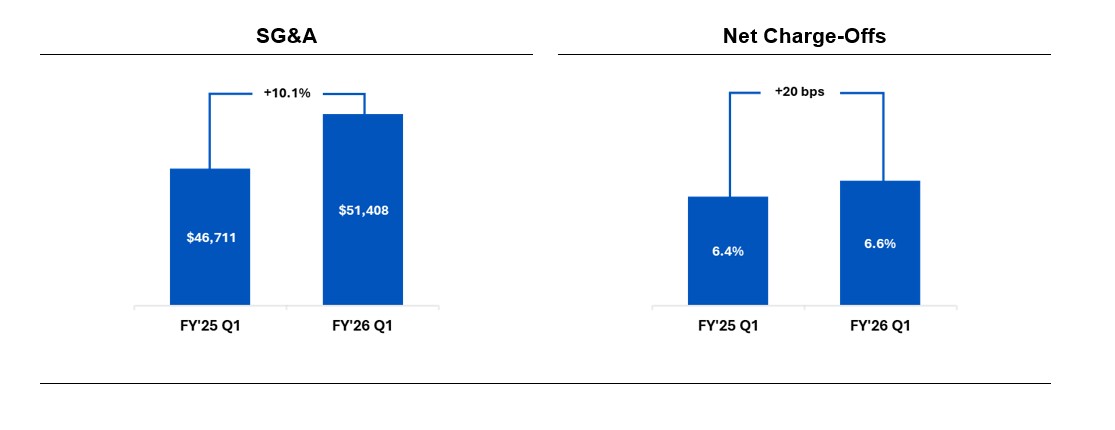
SG&A EXPENSE - SG&A expenses totaled $51.4 million, up 10.1% from $46.7 million. The increase reflects investments in both people and technology initiatives. These technology related initiatives will be complete in Q2 and approximately 50% of the increase will be unwound. These investments are expected to drive future efficiencies and enable SG&A reductions of approximately 5% annually.
UNDERWRITING - As part of the Company's strategy to attract higher-ranking customers through more competitive deal terms, the Company continued to see a modest shift in financing metrics:
- Average down payment was 4.9% of the average retail sales price, down from 5.2% in the prior year's first quarter.
- Average originating term was 44.9 months, up 0.6 month from prior year's first quarter. The weighted average loan term within the portfolio modestly increased to 48.3 months, up 0.2 months year-over-year.
- Contracts originated under enhanced underwriting standards since the implementation of our original LOS now represent approximately 71.8% of the outstanding portfolio balance.
NET CHARGE-OFFS (NCOs) - NCOs as a percentage of average finance receivables were 6.6%, up from 6.4%. The drivers of the percentage increase were related to softer sales (approximately 50%; impacting the denominator) and increases in both the frequency and severity of loss (impacting the numerator). Of the 50% increase, about three-quarters was due to higher frequency, while the remaining one-quarter resulted from increased severity. Delinquencies (30+ days) were 3.8% at the end of the quarter, which represented a 30 basis points increase over the prior year quarter.
ALLOWANCE FOR CREDIT LOSSES - The allowance for credit losses as a percentage of finance receivables-net of deferred revenue and pending accident protection plan claims-improved to 23.35% as of July 31, 2025, compared to 25.00% at July 31, 2024. Sequentially, the allowance increased slightly from 23.25% at April 30, 2025, resulting in a $3 million increase to the allowance, which was driven equally by portfolio growth as well as by the frequency and severity of loss.
LEVERAGE & LIQUIDITY - Debt to finance receivables and debt, net of cash, to finance receivables (non-GAAP¹) were 51.1% and 43.1%, respectively, compared to 53.4% and 46.7% at July 31, 2024-reflecting improved leverage ratios.
During the first three months of FY26, the Company:
- Grew finance receivables by $2.8 million, outpacing the $1.5 million increase in debt, net of cash, and reinforcing disciplined capital management.
- Increased inventory by $0.2 million, driven by a higher proportion of vehicles designated for disposal and elevated procurement costs.
- Decreased interest expense by $1.3 million year-over-year, benefiting from improvements made to the securitization platform and a more favorable interest rate environment.
FINANCINGS - On August 28, 2025, the Company completed a term securitization transaction involving the issuance of $172 million in asset-backed notes with a weighted average life-adjusted coupon of 5.46%. This coupon reflects an 81-basis point improvement over the May 2025 issuance. Since the 2024-1 transaction in January 2024, the Company has reduced its weighted average spread by 308 basis points. Net proceeds were used to pay down the outstanding balance on the Company's revolving line of credit. The Company continues to explore options to diversify and expand its financing sources, including potential warehouse lines of credit and the issuance of longer-term debt securities.
(1) Calculation of this non-GAAP financial measure and a reconciliation to the most directly comparable GAAP measure are included in the tables accompanying this release.
| Key Operating Results | |||||||||||
| Three Months Ended | |||||||||||
| July 31, | |||||||||||
| 2025 | 2024 | % Change | |||||||||
| Operating Data: | |||||||||||
| Retail units sold | 13,568 | 14,391 | (5.7 | )% | |||||||
| Average number of stores in operation | 154 | 155 | (0.6 | ) | |||||||
| Average retail units sold per store per month | 29.4 | 30.9 | (4.9 | ) | |||||||
| Average retail sales price | $ | 19,564 | $ | 19,286 | 1.4 | ||||||
| Total gross profit per retail unit sold | $ | 7,456 | $ | 6,996 | 6.6 | ||||||
| Total gross profit percentage | 36.6 | % | 35.0 | % | |||||||
| Same store revenue growth | (4.1 | )% | (8.6 | )% | |||||||
| Net charge-offs as a percent of average finance receivables | 6.6 | % | 6.4 | % | |||||||
| Total collected (principal, interest and late fees),in thousands | $ | 183,571 | $ | 172,872 | 6.2 | ||||||
| Average total collected per active customer per month | $ | 585 | $ | 562 | 4.1 | ||||||
| Average percentage of finance receivables-current (excl. 1-2 day) | 80.8 | % | 82.3 | % | |||||||
| Average down-payment percentage | 4.9 | % | 5.2 | % | |||||||
| Period End Data: | |||||||||||
| Stores open | 154 | 156 | (1.3 | )% | |||||||
| Accounts over 30 days past due | 3.8 | % | 3.5 | % | |||||||
| Active customer count | 104,691 | 103,231 | 1.4 | ||||||||
| Principal balance of finance receivables(in thousands) | $ | 1,515,680 | $ | 1,465,259 | 3.4 | ||||||
| Weighted average total contract term | 48.3 | 48.1 | 0.5 | ||||||||
| Conference Call and Webcast |
The Company will hold a conference call to discuss its quarterly results on September 4, at 9:00 a.m. ET. Participants may access the conference call via webcast using this link: Webcast Link. To participate via telephone, please register in advance using this Registration Link. Upon registration, all telephone participants will receive a one-time confirmation email detailing how to join the conference call, including the dial-in number along with a unique PIN that can be used to access the call. All participants are encouraged to dial in 10 minutes prior to the start time. A replay and transcript of the conference call and webcast and related supplemental information will be available on-demand via the Company's investor relations webpage at ir.car-mart.com for 12 months.
| About America's Car-Mart, Inc. |
America's Car-Mart, Inc. (the "Company") operates automotive dealerships in 12 states and is one of the largest publicly held automotive retailers in the United States focused exclusively on the "Integrated Auto Sales and Finance" segment of the used car market. The Company emphasizes superior customer service and the building of strong personal relationships with its customers. The Company operates its dealerships primarily in smaller cities throughout the South-Central United States, selling quality used vehicles and providing financing for substantially all of its customers. For more information about America's Car-Mart, including investor presentations, please visit our website at www.car-mart.com.
| Non-GAAP Financial Measures |
This news release contains financial information determined by methods other than in accordance with generally accepted accounting principles (GAAP). We present total debt, net of total cash, to finance receivables, a non-GAAP measure, as a supplemental measure of our performance. We believe total debt, net of total cash, to finance receivables is a useful measure to monitor leverage and evaluate balance sheet risk. This measure should not be considered in isolation or as a substitute for reported GAAP results because it may include or exclude certain items as compared to similar GAAP-based measures, and such measure may not be comparable to similarly-titled measures reported by other companies. We strongly encourage investors to review our consolidated financial statements included in publicly filed reports in their entirety and not rely solely on any one, single financial measure or communication. The most directly comparable GAAP financial measure, as well as a reconciliation to the comparable GAAP financial measure, for this non-GAAP financial measure are presented in the tables of this release.
| Forward-Looking Statements |
This news release contains "forward-looking statements" within the meaning of the Private Securities Litigation Reform Act of 1995. These forward-looking statements address the Company's future objectives, plans and goals, as well as the Company's intent, beliefs and current expectations and projections regarding future financial and operating performance and can generally be identified by words such as "may," "will," "should," "could," "expect," "anticipate," "intend," "plan," "project," "foresee," and other similar words or phrases. Specific events addressed by these forward-looking statements may include, but are not limited to:
- operational infrastructure investments;
- same dealership sales and revenue growth;
- customer growth and engagement;
- gross profit percentages;
- gross profit per retail unit sold;
- business acquisitions;
- inventory acquisition, reconditioning, transportation, and remarketing;
- technological investments and initiatives;
- future revenue growth;
- receivables growth as related to revenue growth;
- new dealership openings;
- performance of new dealerships;
- interest rates;
- future credit losses;
- the Company's collection results, including but not limited to collections during income tax refund periods;
- cash-on-cash returns from the collection of contracts originated by the Company;
- seasonality; and
- the Company's business, operating and growth strategies and expectations.
These forward-looking statements are based on the Company's current estimates and assumptions and involve various risks and uncertainties. As a result, you are cautioned that these forward-looking statements are not guarantees of future performance, and that actual results could differ materially from those projected in these forward-looking statements. Factors that may cause actual results to differ materially from the Company's projections include, but are not limited to:
- general economic conditions in the markets in which the Company operates, including but not limited to fluctuations in gas prices, grocery prices and employment levels and inflationary pressure on operating costs;
- the availability of quality used vehicles at prices that will be affordable to our customers, including the impacts of changes in new vehicle production and sales;
- the ability to leverage the Cox Automotive services agreement to perform reconditioning and improve vehicle quality to reduce the average vehicle cost, improve gross margins, reduce credit loss, and enhance cash flow;
- the availability of credit facilities and access to capital through securitization financings or other sources on terms acceptable to us, and any increase in the cost of capital, to support the Company's business;
- the Company's ability to underwrite and collect its contracts effectively, including whether anticipated benefits from the Company's recently implemented loan origination system are achieved as expected or at all;
- competition;
- dependence on existing management;
- ability to attract, develop, and retain qualified general managers;
- changes in consumer finance laws or regulations, including but not limited to rules and regulations that have recently been enacted or could be enacted by federal and state governments;
- the ability to keep pace with technological advances and changes in consumer behavior affecting our business;
- security breaches, cyber-attacks, or fraudulent activity;
- the ability to identify and obtain favorable locations for new or relocated dealerships at reasonable cost;
- the ability to successfully identify, complete and integrate new acquisitions;
- the occurrence and impact of any adverse weather events or other natural disasters affecting the Company's dealerships or customers; and
- potential business and economic disruptions and uncertainty that may result from any future public health crises and any efforts to mitigate the financial impact and health risks associated with such developments.
Additionally, risks and uncertainties that may affect future results include those described from time to time in the Company's SEC filings. The Company undertakes no obligation to update or revise any forward-looking statements, whether as a result of new information, future events or otherwise. Readers are cautioned not to place undue reliance on these forward-looking statements, which speak only as of the dates on which they are made.
| Contact for information |
SM Berger & Company
Andrew Berger, Managing Director
andrew@smberger.com
(216) 464-6400
| America's Car-Mart, Inc. | |||||||||||||||||||
| Consolidated Results of Operations | |||||||||||||||||||
| (Amounts in thousands, except per share data) | |||||||||||||||||||
| As a % of Sales | |||||||||||||||||||
| Three Months Ended | Three Months Ended | ||||||||||||||||||
| July 31, | July 31, | ||||||||||||||||||
| 2025 | 2024 | % Change | 2025 | 2024 | |||||||||||||||
| Statements of Operations: | |||||||||||||||||||
| Revenues: | |||||||||||||||||||
| Sales | $ | 276,240 | $ | 287,248 | (3.8 | )% | 100.0 | % | 100.0 | % | |||||||||
| Interest income | 65,072 | 60,515 | 7.5 | 23.6 | 21.1 | ||||||||||||||
| Total | 341,312 | 347,763 | (1.9 | ) | 123.6 | 121.1 | |||||||||||||
| Costs and expenses: | |||||||||||||||||||
| Cost of sales | 175,080 | 186,570 | (6.2 | ) | 63.4 | 65.0 | |||||||||||||
| Selling, general and administrative | 51,408 | 46,711 | 10.1 | 18.6 | 16.3 | ||||||||||||||
| Provision for credit losses | 103,036 | 95,423 | 8.0 | 37.3 | 33.2 | ||||||||||||||
| Interest expense | 17,042 | 18,312 | (6.9 | ) | 6.2 | 6.4 | |||||||||||||
| Depreciation and amortization | 2,139 | 1,884 | 13.5 | 0.8 | 0.7 | ||||||||||||||
| Loss on disposal of property and equipment | 9 | 46 | (80.4 | ) | - | - | |||||||||||||
| Total | 348,714 | 348,946 | (0.1 | ) | 126.2 | 121.5 | |||||||||||||
| Loss before taxes | (7,402 | ) | (1,183 | ) | (2.7 | ) | (0.4 | ) | |||||||||||
| Benefit for income taxes | (1,666 | ) | (219 | ) | (0.6 | ) | (0.1 | ) | |||||||||||
| Net loss | $ | (5,736 | ) | $ | (964 | ) | (2.1 | ) | (0.3 | ) | |||||||||
| Dividends on subsidiary preferred stock | $ | (10 | ) | $ | (10 | ) | |||||||||||||
| Net loss attributable to common shareholders | $ | (5,746 | ) | $ | (974 | ) | |||||||||||||
| Earnings per share: | |||||||||||||||||||
| Basic | $ | (0.69 | ) | $ | (0.15 | ) | |||||||||||||
| Diluted | $ | (0.69 | ) | $ | (0.15 | ) | |||||||||||||
| Weighted average number of shares used in calculation | |||||||||||||||||||
| Basic | 8,274,054 | 6,396,757 | |||||||||||||||||
| Diluted | 8,274,054 | 6,396,757 | |||||||||||||||||
| America's Car-Mart, Inc. | |||||||||||
| Condensed Consolidated Balance Sheet and Other Data | |||||||||||
| (Amounts in thousands, except per share data) | |||||||||||
| July 31, | April 30, | July 31, | |||||||||
| 2025 | 2025 | 2024 | |||||||||
| Cash and cash equivalents | $ | 9,666 | $ | 9,808 | $ | 4,748 | |||||
| Restricted cash from collections on auto finance receivables | $ | 111,761 | $ | 114,729 | $ | 93,873 | |||||
| Finance receivables, net | $ | 1,183,452 | $ | 1,180,673 | $ | 1,126,271 | |||||
| Inventory | $ | 112,451 | $ | 112,229 | $ | 114,548 | |||||
| Total assets | $ | 1,607,974 | $ | 1,606,474 | $ | 1,531,270 | |||||
| Revolving lines of credit, net | $ | 164,394 | $ | 204,769 | $ | 184,846 | |||||
| Notes payable, net | $ | 610,750 | $ | 572,010 | $ | 597,494 | |||||
| Treasury stock | $ | 298,291 | $ | 298,220 | $ | 297,810 | |||||
| Total equity | $ | 564,931 | $ | 569,522 | $ | 471,153 | |||||
| Shares outstanding | 8,277,613 | 8,263,280 | 6,396,757 | ||||||||
| Book value per outstanding share | $ | 68.30 | $ | 68.97 | $ | 73.72 | |||||
| Allowance as % of principal balance net of deferred revenue | 23.35 | % | 23.25 | % | 25.00 | % | |||||
| Changes in allowance for credit losses: | |||||||||||
| Three Months Ended | |||||||||||
| July 31, | |||||||||||
| 2025 | 2024 | ||||||||||
| Balance at beginning of period | $ | 323,100 | $ | 331,260 | |||||||
| Provision for credit losses | 103,036 | 95,423 | |||||||||
| Charge-offs, net of collateral recovered | (100,066 | ) | (92,259 | ) | |||||||
| Balance at end of period | $ | 326,070 | $ | 334,424 | |||||||
| America's Car-Mart, Inc. | |||||||
| Condensed Consolidated Statements of Cash Flows | |||||||
| (Amounts in thousands) | |||||||
| Three Months Ended | |||||||
| July 31, | |||||||
| 2025 | 2024 | ||||||
| Operating activities: | |||||||
| Net loss | $ | (5,736 | ) | $ | (964 | ) | |
| Provision for credit losses | 103,036 | 95,423 | |||||
| Losses on claims for accident protection plan | 8,595 | 9,321 | |||||
| Depreciation and amortization | 2,139 | 1,884 | |||||
| Finance receivable originations | (262,746 | ) | (271,756 | ) | |||
| Finance receivable collections | 118,720 | 112,358 | |||||
| Inventory | 28,618 | 25,603 | |||||
| Deferred accident protection plan revenue | (578 | ) | 205 | ||||
| Deferred service contract revenue | (455 | ) | 707 | ||||
| Income taxes, net | (1,647 | ) | 1,078 | ||||
| Other | 4,136 | 11,169 | |||||
| Net cash used in operating activities | (5,918 | ) | (14,972 | ) | |||
| Investing activities: | |||||||
| Purchase of investments | - | (7,527 | ) | ||||
| Purchase of property and equipment and other | (459 | ) | (986 | ) | |||
| Proceeds from sale of property and equipment | 20 | - | |||||
| Net cash used in investing activities | (439 | ) | (8,513 | ) | |||
| Financing activities: | |||||||
| Change in revolving credit facility, net | (39,696 | ) | (15,798 | ) | |||
| Payments on notes payable | (177,499 | ) | (106,076 | ) | |||
| Change in cash overdrafts | 6,162 | 989 | |||||
| Issuances of notes payable | 216,000 | 149,889 | |||||
| Debt issuance costs | (1,708 | ) | (1,387 | ) | |||
| Purchase of common stock | (71 | ) | (24 | ) | |||
| Dividend payments | (10 | ) | (10 | ) | |||
| Exercise of stock options and issuance of common stock | 69 | 76 | |||||
| Net cash provided by financing activities | 3,247 | 27,659 | |||||
| (Decrease) increase in cash, cash equivalents, and restricted cash | $ | (3,110 | ) | $ | 4,174 | ||
| America's Car-Mart, Inc. | |||||||
| Reconciliation of Non-GAAP Financial Measures | |||||||
| (Amounts in thousands) | |||||||
| Calculation of Debt, Net of Total Cash, to Finance Receivables: | |||||||
| July 31, 2025 | April 30, 2025 | ||||||
| Debt: | |||||||
| Revolving lines of credit, net | $ | 164,394 | $ | 204,769 | |||
| Notes payable, net | 610,750 | 572,010 | |||||
| Total debt | $ | 775,144 | $ | 776,779 | |||
| Cash: | |||||||
| Cash and cash equivalents | $ | 9,666 | $ | 9,808 | |||
| Restricted cash from collections on auto finance receivables | 111,761 | 114,729 | |||||
| Total cash, cash equivalents, and restricted cash | $ | 121,427 | $ | 124,537 | |||
| Debt, net of total cash | $ | 653,717 | $ | 652,242 | |||
| Principal balance of finance receivables | $ | 1,515,680 | $ | 1,509,154 | |||
| Ratio of debt to finance receivables | 51.1 | % | 51.5 | % | |||
| Ratio of debt, net of total cash, to finance receivables | 43.1 | % | 43.2 | % | |||
Charts accompanying this announcement are available at:
https://www.globenewswire.com/NewsRoom/AttachmentNg/53a7f828-ef17-4993-bf8c-e6901e58c7c0
https://www.globenewswire.com/NewsRoom/AttachmentNg/df9ff173-c064-441e-9f69-f6c9a3e29f6a
https://www.globenewswire.com/NewsRoom/AttachmentNg/af120d3e-7210-4c93-b650-3383449c5366

