

DERBY, VT / ACCESS Newswire / January 27, 2026 / Community Bancorp. (OTCQX:CMTV), the parent company of Community National Bank (the "Bank"), reported consolidated earnings for the fourth quarter ended December 31, 2025, of $4.6 million or $0.83 per share, an increase of $536,850 or 13.10% compared to $4.1 million or $0.73 per share reported for the fourth quarter of 2024. Full year earnings for 2025 were $17 million or $3.01 per share, compared to $12.8 million or $2.28 per share for the prior year period, a significant increase of $4.2 million or 32.93%. On a per share basis, earnings increased 13.70% in the 2025 fourth quarter to $0.83 per share compared to the prior year period; on an annual basis, earnings per share of $3.01 increased 32.02% year-over-year.
Full Year 2025 and Fourth Quarter 2025 Financial Highlights and Key Performance Indicators (KPIs):
(Unaudited)
|
| Year Ended |
|
| Quarter Ended |
| ||
|
| December 31, 2025 |
|
| December 31, 2025 |
| ||
Return on average assets |
|
| 1.41 | % |
|
| 1.49 | % |
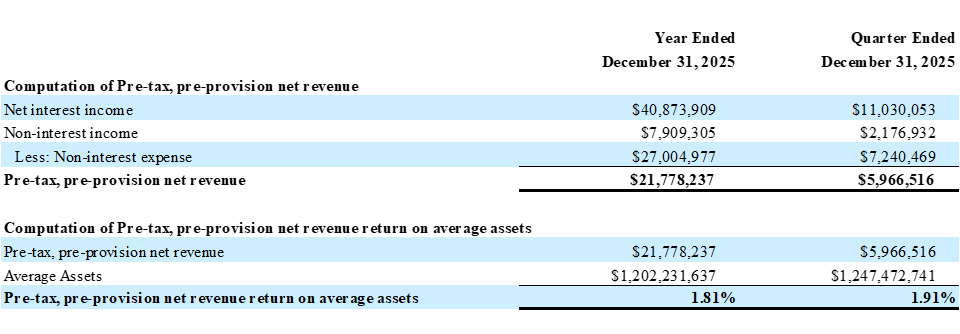
Pre-tax, pre-provision net revenue return on average assets (1) |
|
| 1.81 | % |
|
| 1.91 | % |
Return on average shareholders' equity |
|
| 16.04 | % |
|
| 16.37 | % |
Net Interest Margin |
|
| 3.68 | % |
|
| 3.81 | % |
Efficiency Ratio |
|
| 57.0 | % |
|
| 56.5 | % |
Noninterest expense to average assets |
|
| 2.25 | % |
|
| 2.32 | % |
Net loan (recoveries) charge-offs as a percentage of average loans |
|
| 0.04 | % |
|
| 0.04 | % |
Dividend payout |
|
| 32.55 | % |
|
| 30.21 | % |
Fully diluted tangible book value per common share (1) |
| $ | 18.29 |
|
| $ | 18.29 |
|
Total capital to risk-weighted assets (2) |
|
| 15.20 | % |
|
| 15.20 | % |
Total common equity tier 1 capital to risk-weighted assets (2) |
|
| 13.95 | % |
|
| 13.95 | % |
Tier I Capital to Average Assets (2) |
|
| 10.28 | % |
|
| 9.90 | % |
Tangible common equity to tangible assets (1) |
|
| 8.00 | % |
|
| 8.00 | % |
Earnings per common share |
| $ | 3.01 |
|
| $ | 0.83 |
|
Weighted average number of common shares used in computing earnings per share |
|
| 5,602,905 |
|
|
| 5,586,738 |
|
Refer to the "Reconciliation of GAAP to Non-GAAP Measures" section of this document for additional detail.
Represents Bank-only ratios. Current period capital ratios are preliminary subject to finalization of the Bank's December 31, 2025 FDIC Call Report.
Total assets for the Company at December 31, 2025, were $1.29 billion, an increase of $38.6 million from year end 2024, a 3.09% year-over-year increase. Contributing to the Company's year-over-year growth in assets was growth in the Company's gross loan portfolio of $37 million, or 4.02%, compared to year end 2024 as well as an increase in cash of $17 million or 15.43%. Deposit balances increased $69 million, or 6.89%, compared to the same period in 2024. The year-over-year loan growth was primarily funded by a combination of cash, maturities of securities, as well as an increase in core and brokered deposits.
The Company's securities portfolio totaled $144 million as of December 31, 2025, a 9.50% decrease compared to $160 million as of December 31, 2024. As stated above, the cashflow from maturing securities was used to fund loan growth during the year. The portfolio is classified as available-for-sale and is required to be reported at fair market value with the unrealized loss, net of a deferred tax adjustment, as an adjustment to total equity. Such unrealized losses reflect the interest rate environment, as current rates remain below the coupon rates on the securities, resulting in a fair market value lower than current book values. As of December 31, 2025, the adjustment to equity was $9.6 million, representing an improvement of $6.2 million from the adjustment to equity of $15.8 million as of December 31, 2024.
Total net interest income for the fourth quarter ended December 31, 2025, increased $1.5 million, or 15.98%, to $11 million, compared to $9.5 million for the same quarter in 2024. The year-over-year improvement reflects an increase of $1.2 million, or 9.26%, in interest and fees on loans due to strong loan growth and higher yields, offset by only slightly higher interest expense on deposits of $116,985, or 2.93%, and on repurchase agreements of $25,104, or 11.10%. Net interest income for the year ended December 31, 2025, increased $6.2 million or 18.03%, to $40.9 million, compared to $34.6 million for the year ended December 31, 2024, reflecting the same trends.
The provision for credit losses for the fourth quarter ended December 31, 2025, was $382,807, compared to $27,504 for the same period in 2024. The charge off of a commercial loan in the amount of $299 thousand in the fourth quarter of 2025 resulted in net charge offs for the quarter of $296,594. This compares to net charge offs of $1,284 for the fourth quarter of 2024, due to a recovery of a loan previously charged off earlier in 2024. The recovery in 2024 resulted in a lower provision for the fourth quarter. The year-to-date provision for credit losses was $1.4 million, compared to $1.1 million for the same period in 2024. The $240,250 year-over-year increase was driven partly by the charge off of a commercial loan in 2025. The provision for credit losses for December 31, 2025, was determined under Accounting Standard No. 2016-13, Measurement of Credit Losses on Financial Instruments, commonly referenced as the Current Expected Credit Losses, or CECL.
Total non-interest income for the fourth quarter ended December 31, 2025, of $2.2 million increased $407,715, or 23.04%, compared to $1.8 million for the same period in 2024. Total non-interest income for the year ended December 31, 2025, grew to $7.9 million, compared to $7.2 million for the year ended December 31, 2024, an increase of $727,089, or 10.12% year-over-year. Total non-interest expenses increased 13.19%, for the fourth quarter comparison period, and $1.5 million, or 6%, year-over-year.
Equity capital increased to $113.7 million, with a book value per share of $20.36, as of December 31, 2025, compared to equity capital of $98.0 million and a book value per share of $17.24 as of December 31, 2024. This change includes a decrease of $6.2 million in unrealized losses in the investment portfolio year-over-year, due to changing bond rates, which increased the fair market value of the investment portfolio. The unrealized loss position is considered temporary and does not impact the Company's regulatory capital ratios. In the fourth quarter of 2025, the Company completed the optional redemption of all fifteen of the Company's outstanding shares of its Series A Fixed-to-Floating Rate Non-Cumulative Perpetual Preferred Stock. The preferred stock value of $1,500,000 was included in the Company's equity capital as of December 31, 2024.
President and CEO Christopher Caldwell commented on the Company's results: "Our earnings for 2025 represent the strong performance of Community National Bank. Our strong earnings performance is a direct result of disciplined approaches to the loan and deposit sides of our balance sheet. At the same time, our renewed focus on the customer resulted in deeper relationships amidst economic uncertainty. We continue to keep our focus on credit quality, efficient use of capital, and maximizing shareholder return as proven by our tangible book value going up by 20% and earnings per share increasing by 32% year-over-year. As we announce our 2025 earnings results, I want to extend my gratitude to everyone who has contributed to another year of growth and progress for our Company. Thanks to our dedicated team and loyal stakeholders, we navigated an ever-changing economic environment, delivered solid financial performance, and remained steadfast in our commitment to customer service and our core values. As we embark on the celebration of the Community National Bank's 175th anniversary, and on behalf of the entire leadership team, I want to take this opportunity to thank our communities for their unwavering support. We are excited about the journey ahead and confident that, together, we will write the next successful chapter in our Company's story."
As previously announced, the Company declared a quarterly cash dividend of $0.25 per share payable February 1, 2026, to shareholders of record as of January 15, 2026.
About Community Bancorp.
Community Bancorp. is the parent holding company for Community National Bank, headquartered in Derby, Vermont. Community National Bank is an independent bank that has been serving its communities since 1851, with retail banking offices located in Derby, Derby Line, Island Pond, Barton, Newport, Troy, St. Johnsbury, Montpelier, Barre, Lyndonville, Morrisville and Enosburg Falls as well as loan offices located in Burlington, Vermont and Lebanon, New Hampshire
Forward Looking Statements
This press release contains forward-looking statements within the meaning of the Private Securities Litigation Reform Act of 1995, as amended, including, without limitation, statements about the Company's financial condition, capital status, dividend payment practices, business outlook and affairs. Forward-looking statements can be identified by the fact that they do not relate strictly to historical or current facts. They often include words like "believe," "expect," "anticipate," "estimate," and "intend" or future or conditional verbs such as "will," "would," "should," "could," or "may." Although these statements are based on management's current expectations and estimates, actual conditions, results, and events may differ materially from those contemplated by such forward-looking statements, as they could be influenced by numerous factors which are unpredictable and outside the Company's control. Factors that may cause actual results to differ materially from such statements include, among others, the following: (1) general national or regional economic conditions, national fiscal or monetary policies, or national or international tariff or trade conditions result in a deterioration of the credit quality of our loan portfolio or diminished demand for the Company's products and services; (2) changes in laws or government rules, or the way in which courts interpret those laws or rules, adversely affect the financial industry generally or the Company's business in particular, or may impose additional costs and regulatory requirements; (3) interest rates change in such a way as to reduce the Company's interest margins and its funding sources; and (4) competitive pressures increase among financial services providers in the Company's northern New England market area or in the financial services industry generally, including pressures from nonbank financial service providers, from increasing consolidation and integration of financial service providers and from changes in technology and delivery systems, and other factors that are listed from time to time in our financial filings with the SEC, including our Forms 10Q and 10K. The Company cautions you not to rely unduly on forward-looking statements because the assumptions, beliefs, expectations, and projections about future events may, and often do, differ materially from actual results or events. Any forward-looking statement speaks only as to the date on which it is made, and we undertake no obligation to update any forward-looking statement to reflect developments occurring after the statement is made, except as otherwise required by law.
Use of Non-GAAP Financial Measures
In addition to evaluating the Company's results of operations in accordance with generally accepted accounting principles in the United States ("GAAP"), management supplements this evaluation with certain non-GAAP financial measures such as pre-tax, pre-provision income; fully diluted tangible book value per common share and tangible common equity to tangible assets. Management believe these non-GAAP financial measures help investors better understand the Company's operating performance and trends and allow for better performance comparisons to other financial institutions. In addition, these non-GAAP financial measures remove the impact of unusual items that may obscure trends in the Company's underlying performance. These disclosures should not be viewed as a substitute for GAAP operating results, nor are they necessarily comparable to non-GAAP performance measures that may be presented by other financial institutions. Reconciliations to the comparable GAAP financial measures can be found at the end of this document.
Community Bancorp. And Subsidiary
Consolidated Balance Sheets (unaudited)
|
| December 31, |
|
| December 31, |
| ||
|
| 2025 |
|
| 2024 |
| ||
Assets |
|
|
|
|
|
| ||
Cash and due from banks |
| $ | 11,802,391 |
|
| $ | 9,875,427 |
|
Federal funds sold and overnight deposits |
|
| 116,259,370 |
|
|
| 101,064,775 |
|
Total cash and cash equivalents |
|
| 128,061,761 |
|
|
| 110,940,202 |
|
Securities available-for-sale (amortized cost $156,694,754 and $179,668,079 at 12/31/25 and 12/31/24, respectively |
|
| 144,528,758 |
|
|
| 159,697,420 |
|
Restricted equity securities, at cost |
|
| 2,933,050 |
|
|
| 2,629,350 |
|
Loans held-for-sale |
|
| 138,000 |
|
|
| 0 |
|
Loans |
|
| 965,285,662 |
|
|
| 927,940,805 |
|
Allowance for credit losses |
|
| (10,864,983 | ) |
|
| (9,810,212 | ) |
Deferred net loan costs |
|
| 786,604 |
|
|
| 648,695 |
|
Net loans |
|
| 955,207,283 |
|
|
| 918,779,288 |
|
Bank premises and equipment, net |
|
| 12,090,886 |
|
|
| 12,072,985 |
|
Accrued interest receivable |
|
| 4,607,975 |
|
|
| 4,472,474 |
|
Bank owned life insurance |
|
| 5,398,085 |
|
|
| 5,318,354 |
|
Goodwill |
|
| 11,574,269 |
|
|
| 11,574,269 |
|
Other real estate owned |
|
| 319,019 |
|
|
| 0 |
|
Other assets |
|
| 22,699,860 |
|
|
| 23,445,787 |
|
Total assets |
| $ | 1,287,558,946 |
|
| $ | 1,248,930,129 |
|
Liabilities and Shareholders' Equity |
|
|
|
|
|
|
|
|
Liabilities |
|
|
|
|
|
|
|
|
Deposits: |
|
|
|
|
|
|
|
|
Demand, non-interest bearing |
| $ | 218,842,543 |
|
| $ | 197,697,470 |
|
Interest-bearing transaction accounts |
|
| 299,636,739 |
|
|
| 304,212,085 |
|
Money market funds |
|
| 187,132,921 |
|
|
| 169,533,067 |
|
Savings |
|
| 142,543,291 |
|
|
| 142,925,828 |
|
Time deposits, $250,000 and over |
|
| 46,913,997 |
|
|
| 42,637,716 |
|
Other time deposits |
|
| 175,598,510 |
|
|
| 144,638,592 |
|
Total deposits |
|
| 1,070,668,001 |
|
|
| 1,001,644,758 |
|
Repurchase agreements |
|
| 41,498,171 |
|
|
| 48,943,996 |
|
Borrowed funds |
|
| 35,975,022 |
|
|
| 72,600,000 |
|
Junior subordinated debentures |
|
| 12,887,000 |
|
|
| 12,887,000 |
|
Accrued interest and other liabilities |
|
| 12,843,774 |
|
|
| 14,806,170 |
|
Total liabilities |
|
| 1,173,871,968 |
|
|
| 1,150,881,924 |
|
Shareholders' Equity |
|
|
|
|
|
|
|
|
Preferred stock, 1,000,000 shares authorized, 0 shares issued and outstanding at 12/31/25, 15 shares issued at 12/31/24 ($100,000 liquidation value, per share) |
|
| 0 |
|
|
| 1,500,000 |
|
Common stock - $2.50 par value; 15,000,000 shares authorized, 5,882,266 and 5,809,035 shares issued at December 31, 2025 and 2024, respectively |
|
| 14,705,665 |
|
|
| 14,522,588 |
|
Additional paid-in capital |
|
| 40,076,561 |
|
|
| 38,801,755 |
|
Retained earnings |
|
| 73,021,908 |
|
|
| 61,623,460 |
|
Accumulated other comprehensive loss |
|
| (9,611,137 | ) |
|
| (15,776,821 | ) |
Less: treasury stock, at cost; 299,339 shares at 12/31/25 and 210,101 shares at 12/31/24 |
|
| (4,506,019 | ) |
|
| (2,622,777 | ) |
Total shareholders' equity |
|
| 113,686,978 |
|
|
| 98,048,205 |
|
Total liabilities and shareholders' equity |
| $ | 1,287,558,946 |
|
| $ | 1,248,930,129 |
|
|
|
|
|
|
|
|
| |
Book value per common share outstanding |
| $ | 20.36 |
|
| $ | 17.24 |
|
Community Bancorp. and Subsidiary
Consolidated Statements of Income (unaudited)
|
| Quarter Ended |
|
| Quarter Ended |
| ||
|
| December 31, 2025 |
|
| December 31, 2024 |
| ||
Interest income |
|
|
|
|
|
| ||
Interest and fees on loans |
| $ | 14,356,093 |
|
| $ | 13,139,494 |
|
Interest on taxable debt securities |
|
| 866,904 |
|
|
| 846,912 |
|
Interest on tax-exempt debt securities |
|
| 80,411 |
|
|
| 80,411 |
|
Dividends |
|
| 62,229 |
|
|
| 58,463 |
|
Interest on federal funds sold and overnight deposits |
|
| 722,240 |
|
|
| 851,445 |
|
Total interest income |
|
| 16,087,877 |
|
|
| 14,976,725 |
|
Interest expense |
|
|
|
|
|
|
|
|
Interest on deposits |
|
| 4,115,633 |
|
|
| 3,998,648 |
|
Interest on borrowed funds |
|
| 458,102 |
|
|
| 978,982 |
|
Interest on repurchase agreements |
|
| 251,193 |
|
|
| 226,089 |
|
Interest on junior subordinated debentures |
|
| 232,896 |
|
|
| 262,501 |
|
Total interest expense |
|
| 5,057,824 |
|
|
| 5,466,220 |
|
Net interest income |
|
| 11,030,053 |
|
|
| 9,510,505 |
|
Credit loss expense |
|
| 382,807 |
|
|
| 27,504 |
|
Net interest income after credit loss expense |
|
| 10,647,246 |
|
|
| 9,483,001 |
|
Non-interest income |
|
|
|
|
|
|
|
|
Service fees |
|
| 1,007,434 |
|
|
| 976,702 |
|
Income from sold loans |
|
| 137,506 |
|
|
| 96,492 |
|
Other income from loans |
|
| 506,816 |
|
|
| 314,561 |
|
Other income |
|
| 525,176 |
|
|
| 381,462 |
|
Total non-interest income |
|
| 2,176,932 |
|
|
| 1,769,217 |
|
Non-interest expense |
|
|
|
|
|
|
|
|
Salaries and wages |
|
| 2,632,661 |
|
|
| 2,248,000 |
|
Employee benefits |
|
| 1,140,134 |
|
|
| 1,035,404 |
|
Occupancy expenses, net |
|
| 716,581 |
|
|
| 638,943 |
|
Other expenses |
|
| 2,751,093 |
|
|
| 2,474,370 |
|
Total non-interest expense |
|
| 7,240,469 |
|
|
| 6,396,717 |
|
Income before income taxes |
|
| 5,583,709 |
|
|
| 4,855,501 |
|
Income tax expense |
|
| 947,746 |
|
|
| 756,388 |
|
Net income |
| $ | 4,635,963 |
|
| $ | 4,099,113 |
|
Earnings per common share |
| $ | 0.83 |
|
| $ | 0.73 |
|
Weighted average number of common shares used in computing earnings per share |
|
| 5,586,738 |
|
|
| 5,584,917 |
|
Dividends declared per common share |
| $ | 0.25 |
|
| $ | 0.24 |
|
Community Bancorp. and Subsidiary
Consolidated Statements of Income (unaudited)
|
| Year Ended |
|
| Year Ended |
| ||
|
| December 31, 2025 |
|
| December 31, 2024 |
| ||
Interest income |
|
|
|
|
|
| ||
Interest and fees on loans |
| $ | 55,464,761 |
|
| $ | 49,624,046 |
|
Interest on taxable debt securities |
|
| 3,586,797 |
|
|
| 3,633,292 |
|
Interest on tax-exempt debt securities |
|
| 321,646 |
|
|
| 321,645 |
|
Dividends |
|
| 237,114 |
|
|
| 228,169 |
|
Interest on federal funds sold and overnight deposits |
|
| 1,269,541 |
|
|
| 1,193,788 |
|
Total interest income |
|
| 60,879,859 |
|
|
| 55,000,940 |
|
Interest expense |
|
|
|
|
|
|
|
|
Interest on deposits |
|
| 16,039,463 |
|
|
| 14,115,544 |
|
Interest on borrowed funds |
|
| 1,936,830 |
|
|
| 4,358,437 |
|
Interest on repurchase agreements |
|
| 1,069,965 |
|
|
| 797,002 |
|
Interest on junior subordinated debentures |
|
| 959,692 |
|
|
| 1,098,590 |
|
Total interest expense |
|
| 20,005,950 |
|
|
| 20,369,573 |
|
Net interest income |
|
| 40,873,909 |
|
|
| 34,631,367 |
|
Credit loss expense |
|
| 1,373,661 |
|
|
| 1,133,411 |
|
Net interest income after credit loss expense |
|
| 39,500,248 |
|
|
| 33,497,956 |
|
Non-interest income |
|
|
|
|
|
|
|
|
Service fees |
|
| 3,866,744 |
|
|
| 3,811,141 |
|
Income from sold loans |
|
| 405,978 |
|
|
| 370,360 |
|
Other income from loans |
|
| 1,369,201 |
|
|
| 1,228,555 |
|
Other income |
|
| 2,267,382 |
|
|
| 1,772,160 |
|
Total non-interest income |
|
| 7,909,305 |
|
|
| 7,182,216 |
|
Non-interest expense |
|
|
|
|
|
|
|
|
Salaries and wages |
|
| 9,778,049 |
|
|
| 9,352,000 |
|
Employee benefits |
|
| 4,174,297 |
|
|
| 3,875,597 |
|
Occupancy expenses, net |
|
| 3,041,242 |
|
|
| 2,739,657 |
|
Other expenses |
|
| 10,011,389 |
|
|
| 9,509,838 |
|
Total non-interest expense |
|
| 27,004,977 |
|
|
| 25,477,092 |
|
Income before income taxes |
|
| 20,404,576 |
|
|
| 15,203,080 |
|
Income tax expense |
|
| 3,436,595 |
|
|
| 2,438,630 |
|
Net income |
| $ | 16,967,981 |
|
| $ | 12,764,450 |
|
Earnings per common share |
| $ | 3.01 |
|
| $ | 2.28 |
|
Weighted average number of common shares used in computing earnings per share |
|
| 5,602,905 |
|
|
| 5,553,052 |
|
Dividends declared per common share |
| $ | 0.98 |
|
| $ | 0.94 |
|
Community Bancorp. and Subsidiary
Earnings Per Share ("EPS") (unaudited)
(Dollars in thousands, except share data)
|
| For the Quarter Ended December 30, |
|
| For the Year Ended December 30, |
| ||||||||||
|
| 2025 |
|
| 2024 |
|
| 2025 |
|
| 2024 |
| ||||
|
| (In thousands, except per share data) |
| |||||||||||||
Net income |
| $ | 4,636 |
|
| $ | 4,099 |
|
| $ | 16,968 |
|
| $ | 12,764 |
|
Less: dividends to preferred shareholders |
| $ | 12 |
|
| $ | 30 |
|
| $ | 97 |
|
| $ | 126 |
|
Net income available to common shareholders |
| $ | 4,624 |
|
| $ | 4,069 |
|
| $ | 16,871 |
|
| $ | 12,639 |
|
Weighted average number of common shares used in computing earnings per share |
|
| 5,586,738 |
|
|
| 5,584,917 |
|
|
| 5,602,905 |
|
|
| 5,553,052 |
|
Earnings per common share |
| $ | 0.83 |
|
| $ | 0.73 |
|
| $ | 3.01 |
|
| $ | 2.28 |
|
Reconciliation of GAAP to Non-GAAP Measures
(unaudited)
Community Bancorp. and Subsidiary
(Dollars in thousands, except share data)
|
| As of |
| |||||||||||||
|
| December 31, 2025 |
|
| September 30, 2025 |
|
| June 30, 2025 |
|
| March 31, 2025 |
| ||||
|
|
|
|
|
|
|
|
|
|
|
|
| ||||
Computation of Fully Diluted Tangible Book Value per Common Share |
|
|
|
|
|
|
|
|
|
|
|
| ||||
Total shareholders' equity |
| $ | 113,687 |
|
| $ | 111,880 |
|
| $ | 106,343 |
|
| $ | 102,905 |
|
Less: |
|
|
|
|
|
|
|
|
|
|
|
|
|
|
|
|
Preferred Stock |
|
| - |
|
| $ | 1,500 |
|
| $ | 1,500 |
|
| $ | 1,500 |
|
Common shareholders' equity |
| $ | 113,687 |
|
| $ | 110,380 |
|
| $ | 104,843 |
|
| $ | 101,405 |
|
Less: |
|
|
|
|
|
|
|
|
|
|
|
|
|
|
|
|
Goodwill |
| $ | 11,574 |
|
| $ | 11,574 |
|
| $ | 11,574 |
|
| $ | 11,574 |
|
Other Intangibles |
|
| - |
|
|
| - |
|
|
| - |
|
|
| - |
|
Tangible common shareholders' equity |
| $ | 102,113 |
|
| $ | 98,806 |
|
| $ | 93,269 |
|
| $ | 89,831 |
|
|
|
|
|
|
|
|
|
|
|
|
|
|
|
|
| |
Common shares issued and outstanding |
|
| 5,582,867 |
|
|
| 5,619,491 |
|
|
| 5,608,914 |
|
|
| 5,618,168 |
|
|
|
|
|
|
|
|
|
|
|
|
|
|
|
|
| |
Fully Diluted Tangible Book Value per Common Share |
| $ | 18.29 |
|
| $ | 17.58 |
|
| $ | 16.63 |
|
| $ | 15.99 |
|
|
| As of |
| |||||||||||||
|
| December 31, 2025 |
|
| September 30, 2025 |
|
| June 30, 2025 |
|
| March 31, 2025 |
| ||||
Computation of Tangible Common Equity to Tangible Assets |
|
|
|
|
|
|
|
|
|
|
|
| ||||
Common Equity |
| $ | 113,687 |
|
| $ | 110,380 |
|
| $ | 104,843 |
|
| $ | 101,405 |
|
Less: |
|
|
|
|
|
|
|
|
|
|
|
|
|
|
|
|
Goodwill |
| $ | 11,574 |
|
| $ | 11,574 |
|
| $ | 11,574 |
|
| $ | 11,574 |
|
Other Intangibles |
|
| - |
|
|
| - |
|
|
| - |
|
|
| - |
|
Tangible Common Equity |
| $ | 102,113 |
|
| $ | 98,806 |
|
| $ | 93,269 |
|
| $ | 89,831 |
|
|
|
|
|
|
|
|
|
|
|
|
|
|
|
|
| |
Total Assets |
| $ | 1,287,559 |
|
| $ | 1,226,171 |
|
| $ | 1,166,586 |
|
| $ | 1,187,857 |
|
Less: |
|
|
|
|
|
|
|
|
|
|
|
|
|
|
|
|
Goodwill |
| $ | 11,574 |
|
| $ | 11,574 |
|
| $ | 11,574 |
|
| $ | 11,574 |
|
Other Intangibles |
|
| - |
|
|
| - |
|
|
| - |
|
|
| - |
|
Tangible Assets |
| $ | 1,275,985 |
|
| $ | 1,214,597 |
|
| $ | 1,155,012 |
|
| $ | 1,176,283 |
|
|
|
|
|
|
|
|
|
|
|
|
|
|
|
|
| |
Tangible Common Equity to Tangible Assets |
|
| 8.00 | % |
|
| 8.13 | % |
|
| 8.08 | % |
|
| 7.64 | % |
For more information, contact:
Investor Relations
ir@communitynationalbank.com
SOURCE: Community Bancorp. Inc Vermont
View the original press release on ACCESS Newswire:
https://www.accessnewswire.com/newsroom/en/banking-and-financial-services/community-bancorp.-reports-fourth-quarter-and-full-year-2025-financi-1131047
