

LAS VEGAS, April 29, 2026 (GLOBE NEWSWIRE) -- GBank Financial Holdings Inc. (the "Company") (NASDAQ: GBFH), the parent company of GBank (the "Bank"), today reported net income of $1.3 million, or $0.09 per diluted share, for the quarter ended March 31, 2026. The results for the first quarter of 2026 included an unusual item with a net impact of $3.2 million after-tax, or $0.22 per diluted share, due to losses associated with credit card fraud. Adjusted net income(1) for the quarter ended March 31, 2026 was $4.7 million, or $0.31 adjusted diluted earnings per share(1)-
First Quarter 2026 Summary Comments (Unaudited)
- Net revenue(1) of $19.6 million, a 5.2% decrease compared to the fourth quarter of 2025
- U.S. Small Business Administration ("SBA") lending and commercial banking loan originations of $208.1 million, compared to $126.4 million for the fourth quarter of 2025.
- Significant loan growth resulted in total on-balance sheet loans exceeding $1.0 billion as of March 31, 2026, a historic milestone for the Company
- Gain on loan sales of $3.8 million on loans sold of $79.0 million, compared to gain on loan sales of $3.6 million on loans sold of $92.3 million for the fourth quarter of 2025
- Gain on loan sales margin(1) of 4.79% compared to 3.93% for the fourth quarter of 2025
- Credit card transaction volume of $109.3 million and net interchange fees of $2.2 million, compared to $99.3 million and $1.8 million, respectively, for the fourth quarter of 2025
- GBank partners with BoltBetz to become sole provider of gamer deposit accounts on the BoltBetz App
Adjusted diluted earnings per share excludes certain items presented in the table below.
| ($'s in 000, except per share data) | Three Months Ended | ||
| Description | March 31, 2026 | ||
| Pre-Tax Impact of Third-Party Credit Card Fraud Losses | - | 4,213 | |
| After-Tax Impact | - | 3,250 | |
| Per Share Impact | - | 0.22 | |
| Reported Diluted Earnings Per Share | - | 0.09 | |
| Adjusted Diluted Earnings Per Share (1) | - | 0.31 | |
Comments from Ed Nigro, Executive Chairman and CEO
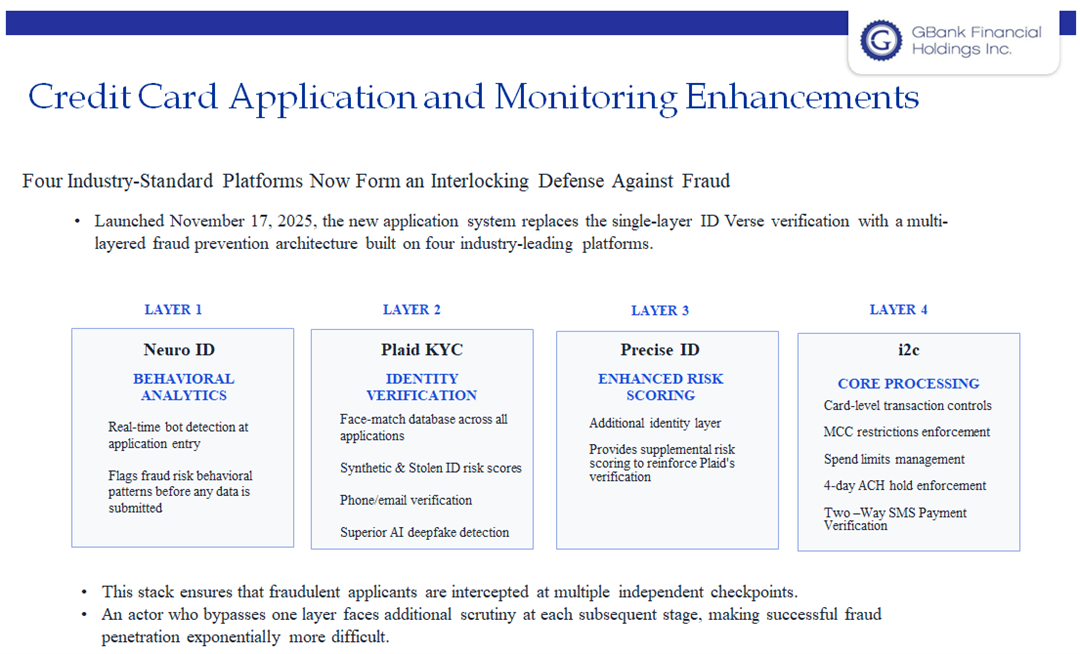
"In 2025, credit card issuers, including GBank, experienced a significant escalation in bot-driven fraud activity that was undetected by legacy detection controls across the industry," commented Ed Nigro, Executive Chairman and Chief Executive Officer of the Company. Mr. Nigro continued by commenting that, "GBank limited use of its legacy application system in mid-September 2025 and launched its new credit card application platform on November 17, 2025, followed by a new monitoring platform during the first quarter of 2026. Please see Exhibit A to this report detailing the updated measures in place. This combined technology not only prevented new bot fraud accounts, but also identified embedded bot fraud resulting from the 2025 direct mail retail credit card campaign. These bot fraud accounts with AI enabled tools mimicked human behavior with gradual monthly spending remained undetected. These reported fraud losses were attributable to non-gaming transactions."
"Net interest income and net interest margin declined in the first quarter of 2026, primarily reflecting the impact of Federal Reserve rate cuts implemented in the fourth quarter of 2025 that impacted our variable-rate loan portfolio beginning January 1, 2026. As is typical in the banking industry, reductions in funding costs have lagged the immediate repricing of earning assets, and competitive deposit pricing has required us to maintain a relatively elevated cost of funds, resulting in margin compression."
"Despite these pressures, net interest margin was 3.86% for the first quarter of 2026, remaining above average when compared to industry peers. We also expect the $208 million in loan growth during the quarter-much of which originated late in the first quarter of 2026-to support future margin expansion. From a funding perspective, we continue to actively manage deposit pricing and evaluate alternative funding strategies," continued Mr. Nigro.
"While we acknowledge the challenges of the quarter, we are optimistic about the future and believe the resilience and innovation of GBank shall continue to produce positive growth and meaningful results," concluded Mr. Nigro.
Financial Results
Income Statement
Net interest income totaled $12.2 million for the first quarter of 2026, reflecting a decrease of $1.3 million, or 9.4%, compared to $13.5 million for the fourth quarter of 2025, and an increase of $297 thousand, or 2.5%, compared to the first quarter of 2025.
The decrease in net interest income when compared to the fourth quarter of 2025 was primarily attributable to the impact of a 50 basis point decrease in the target federal funds rate on the Company's variable rate loan portfolio. Net interest income during the first quarter of 2026 was also impacted by interest income reversals related to nonaccrual loans totaling $280 thousand and two fewer days in the quarter resulting in a decrease in interest income quarter over quarter.
The increase in net interest income during the first quarter of 2026 when compared to the first quarter of 2025 was primarily volume driven, as higher interest income from growth in average loan and interest-bearing cash balances more than offset increases in interest expense resulting from higher average balances of interest-bearing deposits.
The yield on investment securities was 4.39% for the first quarter of 2026, compared to 4.51% for the fourth quarter of 2025 and 4.94% for the first quarter of 2025. The decrease in the yield when compared to the previous quarter and the same quarter of 2025 was the result of both (i) a reduction in yield on certain variable rate securities due to lower long-term interest rates, and (ii) a change in the mix of investment securities held resulting from the sale of the held-to-maturity investment portfolio during the fourth quarter of 2025, and (iii) the purchase of $44 million of available for sale mortgage backed securities during the first quarter of 2026.
The Company's net interest margin for the first quarter of 2026 was 3.86%, compared to 4.21% for the fourth quarter of 2025 and 4.47% for the first quarter of 2025. The decrease in net interest margin during the first quarter of 2026 when compared to the previous quarter was attributable to the market rate cuts and nonaccrual interest reversals noted above. The year-over-year decline in quarterly net interest margin reflects the impact of a cumulative 75 basis point reduction in the target federal funds rate on the Company's variable-rate loan portfolio over the preceding twelve months.
The Company recorded a provision for credit losses on loans of $2.3 million for the first quarter of 2026, compared to $130 thousand of provision reversal (benefit) recorded during the fourth quarter of 2025, and $710 thousand of provision expense recorded during the first quarter of 2025. The provision for credit losses on loans during the first quarter of 2026 reflects an increase of $1.4 million related to specific reserves on individually evaluated commercial real estate - owner occupied, commercial real estate - non-owner occupied, and commercial and industrial loans. Additionally, the increase includes $860 thousand related to non-guaranteed loan growth primarily within GBank's commercial real estate - non-owner occupied loan portfolio.
Non-interest income was $7.5 million for the first quarter of 2026, compared to $7.3 million for the fourth quarter of 2025, and $5.5 million for the first quarter of 2025. The $191 thousand increase in non-interest income during the first quarter of 2026 when compared to the fourth quarter of 2025 was primarily due to an increase in net gains on sales of loans of $165 thousand as well as an increase in net interchange fees of $388 thousand. These favorable variances were offset by a $426 thousand decrease in gain on sale of investment securities as no sales occurred in the first quarter of 2026.
The $2.0 million increase in non-interest income during the first quarter of 2026 when compared to the first quarter of 2025 was primarily driven by favorable increases in net gains on sales of loans of $1.3 million and loan servicing income of $295 thousand. Additionally, other income reflects an increase of $253 thousand primarily due to an increase in bank owned life insurance income of $229 thousand.
Net revenue(1) totaled $19.6 million for the first quarter of 2026, representing a decrease of $1.1 million, or 5.2%, compared to $20.7 million for the fourth quarter of 2025. Net revenue for the first quarter of 2026 increased $2.3 million, or 13.2%, when compared to $17.4 million for the first quarter of 2025.
Non-interest expense was $15.9 million during the first quarter of 2026, compared to $11.5 million for the fourth quarter of 2025 and $10.9 million for the first quarter of 2025. The quarter-over-quarter increase in non-interest expense was principally due to the $4.2 million of third-party credit card fraud expense incurred during the quarter. The higher salary and employee benefits costs reflect higher stock-based compensation expense as well as increases in full-time equivalent employees and annual cost increases. The Company's efficiency ratio was 80.8% for the first quarter of 2026, compared to 55.3% for the fourth quarter of 2025 and 62.8% for the first quarter of 2025.
(1) See Reconciliation of Non-GAAP Financial Measures
Income tax expense was $139 thousand for the quarter ended March 31, 2026, compared to $2.0 million for the fourth quarter of 2025, and $1.2 million for the first quarter of 2025. The Company's effective tax rate was 9.4% for the quarter ended March 31, 2026, compared to 19.1% for the quarter ended December 31, 2025, and 23.1% for the quarter ended March 31, 2025. The fluctuations in the effective tax rate are largely driven by the timing and volume of certain stock-based compensation transactions resulting in tax benefits to the Company.
Net income was $1.3 million for the first quarter of 2026, a decrease of $6.1 million from $7.4 million for the fourth quarter of 2025, and an increase of $3.2 million from $4.5 million during the first quarter of 2025. Diluted earnings per share were $0.09 for the first quarter of 2026, compared to $0.51 for the fourth quarter of 2025 and $0.31 for the first quarter of 2025.
Balance Sheet
Total assets were $1.4 billion as of both March 31, 2026 and December 31, 2025, an increase of 17.1% from $1.2 billion as of March 31, 2025. The increase in total assets from March 31, 2025 was primarily driven by increases in loans and other assets offset by a decrease in cash and cash equivalents. Total assets under management, including $1.1 billion of sold loans for which servicing is retained, totaled $2.5 billion as of March 31, 2026.
The investment securities portfolio increased by $40.3 million during the first quarter of 2026 primarily due to the purchase of ten available for sale investment securities totaling $44.0 million. This increase was partially offset by principal paydowns.
Total loans, net of deferred fees and costs, were $1.0 billion as of March 31, 2026, compared to $959.3 million as of December 31, 2025, and $843.4 million as of March 31, 2025. Loans, net of deferred fees and costs increased $65.9 million during the first quarter of 2026 primarily due to increases in commercial and industrial and commercial real estate loans. The increase in loans, net of deferred fees and costs, of $181.8 million from March 31, 2025, was primarily driven by an increase of $151.8 million in commercial real estate loans. Total government guaranteed loans as a percentage of loans(1) were 17.3% as of March 31, 2026, compared to 19.2% as of December 31, 2025, and 24.2% as of March 31, 2025.
The Company's allowance for credit losses totaled $10.8 million as of March 31, 2026, compared to $9.9 million as of December 31, 2025, and $9.0 million as of March 31, 2025. The allowance for credit losses as a percentage of total loans was 1.05% as of March 31, 2026, compared to 1.03% as of December 31, 2025 and 1.07% as of March 31, 2025. The allowance for credit losses as a percentage of total loans, excluding government guaranteed portions(1), was 1.27% as of March 31, 2026, compared to 1.28% as of December 31, 2025, and 1.41% as of March 31, 2025.
Deposits totaled $1.2 billion as of March 31, 2026, an increase of $28.3 million from $1.1 billion as of December 31, 2025, and an increase of $175.0 million from $995.9 million as of March 31, 2025. By deposit type, the increase from the prior quarter was driven by an increase of $26.7 million in certificates of deposit, a decrease of $7.6 million in savings and money market accounts, and an $8.2 million increase in interest bearing demand deposits. Noninterest-bearing deposits totaled $215.1 million as of March 31, 2026, an increase of $936 thousand from $214.1 million as of December 31, 2025, and a decrease of $27.6 million from $242.7 million as of March 31, 2025.
The Company's ratio of loans to deposits was 87.5% as of March 31, 2026, compared to 83.9% as of December 31, 2025, and 84.7% as of March 31, 2025.
The Company had no short-term borrowings as of March 31, 2026 and March 31, 2025, compared to $371 thousand of short-term borrowings as of December 31, 2025. As of March 31, 2026, the Company had approximately $480.5 million in available borrowing capacity from the Federal Reserve Bank of San Francisco, the Federal Home Loan Bank of San Francisco, and through its various fed funds lines of credit with its correspondent banks.
Subordinated notes outstanding totaled $30.3 million as of March 31, 2026 compared to $26.2 million as of December 31, 2025 and $26.1 million as of March 31, 2025. The increase reflects the issuance of $11.0 million of subordinated debt issued in January 2026 which matures on January 15, 2036. This increase was partially offset by the redemption of $6.5 million of subordinated debt originally issued in 2020.
Stockholders' equity was $167.6 million as of March 31, 2026, compared to $165.8 million as of December 31, 2025, and $146.6 million as of March 31, 2025. The increase in stockholders' equity when compared to both the prior quarter and the prior year is attributable to increases in retained earnings resulting from net income earned during each respective period.
The Company's ratio of common equity to total assets was 12.03% as of March 31, 2026 compared to 12.19% as of December 31, 2025 and 12.32% as of March 31, 2025. The Bank's Tier 1 leverage ratio was 13.4% as of March 31, 2026 and December 31, 2025, and 14.2% as of March 31, 2025. The Company's book value per share was $11.58 as of March 31, 2026, an increase of 0.5% from $11.52 as of December 31, 2025, and an increase of 12.8% from $10.27 as of March 31, 2025.
(1) See Reconciliation of Non-GAAP Financial Measures
Asset Quality
The Company recorded a provision for credit loss expense for loans of $2.3 million for the first quarter of 2026, compared to a reversal (benefit) of the provision for credit losses for loans of $130 thousand recorded during the fourth quarter of 2025 and $710 thousand of provision expense recorded during the first quarter of 2025. Net loan charge-offs in the first quarter of 2026 totaled $1.5 million, or 0.57% of average net loans (annualized), compared to net loan charge-offs of $557 thousand, or 0.21% of average net loans (annualized) in the fourth quarter of 2025 and $828 thousand of net loan charge-offs, or 0.39% of average net loans (annualized) during the first quarter of 2025. Net loan charge-offs in the first quarter of 2026 were largely attributable to credit card balances.
Non-performing assets totaled $44.1 million as of March 31, 2026, an increase of $6.7 million from $37.4 million as of December 31, 2025, and an increase of $23.8 million from $20.4 million as of March 31, 2025. The ratio of total non-performing assets to total assets was 3.17% as of March 31, 2026, compared to 2.75% as of December 31, 2025, and 1.71% as of March 31, 2025.
Our non-performing assets to total assets ratio was 3.17% as of March 31, 2026, however, this ratio includes government guaranteed balances of $30.9 million in the balance of non-performing assets (numerator). Excluding the government guaranteed portion of non-performing assets(1), total at-risk non-performing assets were $13.2 million as of March 31, 2026 and the ratio of non-performing assets excluding the government guaranteed portion(1) reflects a very manageable 0.95% of total assets.
The Company continuously monitors its non-performing asset portfolio and believes the financial risk related to these assets is well contained. In making this assessment, it is important to consider the process we undertake when a collateralized SBA non-performing asset requires collection efforts. We repurchase the sold portion of the government guaranteed loan to affect the foreclosure and resale of the property. This process immediately increases the non-performing asset balance on our balance sheet to include the government guaranteed portion - thus the importance of always adjusting for the government guaranteed portion of the non-performing assets as well as considering our "off balance sheet" assets consisting of the sold portion of USDA and SBA guaranteed loans of $1.1 billion that increase our total assets under management to $2.5 billion.
Other Financial and Operational Highlights
SBA Lending and Commercial Banking
SBA lending and commercial loan originations totaled $208.1 million during the first quarter of 2026, compared to $126.4 million for the fourth quarter of 2025 and $133.0 million for the first quarter of 2025. SBA loan originations favorably rebounded as originations during the fourth quarter of 2025 were limited by the federal government shut down in effect from October 1, 2025 to November 15, 2025.
We continue to see improvement in our pretax gain on sale of loans margin as the average pretax gain on sale of loans margin was 4.79% for the first quarter of 2026, compared to 3.93% for the fourth quarter of 2025. This improvement in pricing quarter-over-quarter more than offset the volume decrease in loan sales, resulting in a 4.6% increase in gain on sale of loans when compared to the fourth quarter of 2025. We expect very strong gain on loan sales revenues in the second quarter of 2026 as available for sale loans were $74.5 million at March 31, 2026 compared to $46.0 million as December 31, 2025.
Gaming/Fintech
Our gaming and financial technology operations have demonstrated exceptional resilience and execution this quarter. By rapidly adapting to industry shifts and deploying innovative product solutions, we have not only mitigated market headwinds but continued to capture significant growth and solidify our technological infrastructure. We are transitioning from building and controlling to scaling our robust platform.
BoltBetz Version 2
-
- GBank's strategic partner, BoltBetz, went live during the first quarter of 2026 with a limited Distill Tavern launch to evaluate system functionality, train staff, test marketing and promotional campaigns, spur adoption, and increase player engagement. Concurrently, BoltBetz Version 2 (V2) was developed and licensed with the Nevada Gaming Control Board (GCB). V2 greatly simplifies player sign-up process and enables onboarding of multiple gaming operators. This GCB license is specifically conditioned upon all player funds being held by GBank rather than held by the gaming operator or BoltBetz. This condition speaks directly to the foundational role GBank plays within the gaming ecosystem and reinforces the structural integrity of our platform.
- GBank's strategic partner, BoltBetz, went live during the first quarter of 2026 with a limited Distill Tavern launch to evaluate system functionality, train staff, test marketing and promotional campaigns, spur adoption, and increase player engagement. Concurrently, BoltBetz Version 2 (V2) was developed and licensed with the Nevada Gaming Control Board (GCB). V2 greatly simplifies player sign-up process and enables onboarding of multiple gaming operators. This GCB license is specifically conditioned upon all player funds being held by GBank rather than held by the gaming operator or BoltBetz. This condition speaks directly to the foundational role GBank plays within the gaming ecosystem and reinforces the structural integrity of our platform.
(1) See Reconciliation of Non-GAAP Financial Measures
-
- The V2 app is now available for download on both Apple iOS and Android devices and is fully functional across all Distill Tavern locations.
-
- BoltBetz is working toward the upcoming Terrible Herbst, Inc. gaming launch, which is expected to begin in the third quarter of 2026.
- BoltBetz is working toward the upcoming Terrible Herbst, Inc. gaming launch, which is expected to begin in the third quarter of 2026.
Bankroll
-
- BoltBetz and BankCard Services Inc. (BCS) have signed a binding terms sheet establishing Bankroll as a 50/50 joint venture. Bankroll will provide a white-labeled, end-to-end digital payments solution for gaming fintech companies and wallet providers, enabling the efficient onboarding of digital wallet solutions and delivering real-time funds movement through utilization of BCS's proprietary Pooled Player Account (PPA) Program, GBank's banking infrastructure, and BoltBetz's wallet technology.
-
- BoltBetz and Bankroll have active and developing pipelines, with ongoing negotiations across gaming and payments operators.
- BoltBetz and Bankroll have active and developing pipelines, with ongoing negotiations across gaming and payments operators.
Credit Card Market Headwinds & Resilient Navigation
-
- Despite certain credit card restrictions by major sportsbooks, we grew our first quarter credit card transaction volume by $10 million through immediate strategic pivots including the creation of our credit card collateral accounts ("Assured Payment Accounts"). This solution facilitates higher player spend with significantly reduced risk through secure internal transfers. Customer acceptance has been exceptional, with these accounts comprising approximately 43% of our total transaction volume during the first quarter of 2026.
-
- We have developed a gaming prepaid debit card program designed for our gaming customers for loading all sports, iGaming, slots and payment apps across the United States. This product is on track to be launched during the third quarter of 2026.
- We have developed a gaming prepaid debit card program designed for our gaming customers for loading all sports, iGaming, slots and payment apps across the United States. This product is on track to be launched during the third quarter of 2026.
Financial Impact: Non-Interest Bearing Deposits, Fee Income and Profitability Growth
-
- Our gaming credit card has created an invaluable GBank customer base with thousands of high-quality/high limit gaming clients that actively participate in sports, iGaming (i.e. slots, poker, and table games), lotteries, and horse racing as well as sweepstakes (games of skill) and predictive markets apps. Further, we anticipate that this customer base shall substantively grow as BoltBetz/Bankroll apps are deployed across casino slot markets.
-
- Gaming apps use multiple funding deposit rails, including but not limited to ACH, debit cards, wire, credit cards, RTP and RFP. We have and are launching new GBank payments solutions for each deposit rail including:
-
-
- GBank, as an originating depository financial institution (ODFI) began processing all GBank credit card ACH transactions during the first quarter of 2026 and is developing technology to significantly scale for a pipeline of payments clients.
-
-
-
- Our new VISA debit card with rewards for gamers is anticipated to launch in the third quarter of 2026
-
-
-
- In collaboration with BCS, BoltBetz, and BankRoll, we anticipate growth in PPA accounts in late 2026
-
-
-
- As previously mentioned, the new credit card assured payment accounts program targets high net worth/high limit gaming customers
-
-
-
- Development of a Master card prepaid card for lotteries anticipated to launch in 3rd quarter with new BCS Agreement
-
-
- We believe the most significant financial impact of our strategy is deposit transformation. We are actively working as a goal to replace higher-cost deposits with non-interest-bearing deposits generated through our payments and gaming flows by year end. This transformation positively increases our net interest margin, drives fee income, earnings growth, and improves overall balance sheet efficiency.
- We believe the most significant financial impact of our strategy is deposit transformation. We are actively working as a goal to replace higher-cost deposits with non-interest-bearing deposits generated through our payments and gaming flows by year end. This transformation positively increases our net interest margin, drives fee income, earnings growth, and improves overall balance sheet efficiency.
Our conviction in the total addressable market for our various products remains unchanged. The opportunity to embed sound banking solutions and customer protections across gaming payments is compelling, and we are strategically positioned to grow our market share.
Earnings Call
The Company will host its first quarter 2026 earnings call on Wednesday April 29, 2026 at 2:00 p.m. PST. Interested parties can participate remotely via Internet connectivity. There will be no physical location for attendance.
Interested parties may register for the event using this link:
https://gbank-financial-earnings-q126.open-exchange.net/
About GBank Financial Holdings Inc.
GBank Financial Holdings Inc. is a bank holding company headquartered in Las Vegas, Nevada and is listed on the Nasdaq Capital Market under the symbol "GBFH." Through our wholly owned bank subsidiary, GBank, we operate two full-service commercial branches in Las Vegas, Nevada to provide a broad range of business, commercial and retail banking products and services to small businesses, middle-market enterprises, public entities and affluent individuals in Nevada, California, Utah, and Arizona. Please visit www.gbankfinancialholdings.com for more information.
Non-GAAP Financial Measures
Some of the financial measures included in this press release are not measures of financial performance recognized in accordance with generally accepted accounting principles in the United States ("GAAP"). The Company believes these non-GAAP financial measures provide both management and investors a more complete understanding of the Company's financial position and performance. These non-GAAP financial measures are supplemental and are not a substitute for any analysis based on GAAP financial measures.
We classify a financial measure as being a non-GAAP financial measure if that financial measure excludes or includes amounts, or is subject to adjustments that have the effect of excluding or including amounts, that are included or excluded, as the case may be, in the most directly comparable measure calculated and presented in accordance with GAAP as in effect from time to time in the United States in our statements of income, balance sheets or statements of cash flows. Not all companies use the same calculation of these measures; therefore, this presentation may not be comparable to other similarly titled measures as presented by other companies.
A reconciliation of non-GAAP financial measures to GAAP financial measures is provided at the end of this press release.
Available Information
The Company routinely posts important information for investors on its web site (under www.gbankfinancialholdings.com and, more specifically, under the News & Media tab at www.gbankfinancialholdings.com/press-releases). The Company intends to use its web site as a means of disclosing material non-public information and for complying with its disclosure obligations under Regulation FD (Fair Disclosure) promulgated by the U.S. Securities and Exchange Commission (the "SEC"). Accordingly, investors should monitor the Company's web site, in addition to following the Company's press releases, SEC filings, public conference calls, presentations and webcasts.
The information contained on, or that may be accessed through, the Company's web site is not incorporated by reference into, and is not a part of, this document.
Forward-Looking Statements
This press release contains forward-looking statements within the meaning of Section 27A of the Securities Act of 1933, and Section 21E of the Securities Exchange Act of 1934. These forward-looking statements reflect the Company's current views with respect to future events and the Company's financial performance. Any statements about the Company's expectations, beliefs, plans, predictions, forecasts, objectives, assumptions or future events or performance are not historical facts and may be forward-looking. These statements are often, but not always, made through the use of words or phrases such as "anticipate," "believes," "can," "could," "may," "predicts," "potential," "should," "will," "estimate," "plans," "projects," "continuing," "ongoing," "expects," "intends" and similar words or phrases, and include, but are not limited to, statements made by Mr. Nigro. The Company cautions that the forward-looking statements in this press release are based largely on the Company's expectations and are subject to a number of known and unknown risks and uncertainties that are subject to change based on factors which are, in many instances, beyond the Company's control. Factors that could cause such changes include, but are not limited to, (i) the impact on us and our customers of a decline in general economic conditions and any regulatory responses thereto; (ii) potential recession in the United States and our market areas; (iii) the impacts related to or resulting from uncertainty in the banking industry as a whole; (iv) increased competition for deposits in our market areas and related changes in deposit customer behavior; (v) the impact of changes in market interest rates, whether due to a continuation of the elevated interest rate environment or further reductions in interest rates and a resulting decline in net interest income; (vi) the lingering inflationary pressures, and the risk of the resurgence of elevated levels of inflation, in the United States and our market areas; (vii) the uncertain impacts of ongoing quantitative tightening and current and future monetary policies of the Board of Governors of the Federal Reserve System; (viii) changes in unemployment rates in the United States and our market areas; (ix) adverse changes in customer spending and savings habits; (x) declines in commercial real estate values and prices; (xi) a deterioration of the credit rating for U.S. long-term sovereign debt or uncertainty regarding United States fiscal debt, deficit and budget matters; (xii) cyber incidents or other failures, disruptions or breaches of our operational or security systems or infrastructure, or those of our third-party vendors or other service providers, including as a result of cyber-attacks; (xiii) severe weather, natural disasters, acts of war or terrorism, geopolitical instability or other external events, including as a result of the policies of the current U.S. presidential administration or Congress; (xiv) the impacts of tariffs, sanctions and other trade policies of the United States and its global trading counterparts and the resulting impact on the Company and its customers; (xv) competition and market expansion opportunities; (xvi) changes in non-interest expenditures or in the anticipated benefits of such expenditures; (xvii) the risks related to the development, implementation, use and management of emerging technologies, including artificial intelligence and machine learnings; (xviii) current or future litigation, regulatory examinations or other legal and/or regulatory actions; and (xix) changes in applicable laws and regulations. Additional information regarding these risks and uncertainties to which the Company's business and future financial performance are subject is contained in the Company's filings with the SEC, including its Annual Report on Form 10-K for the year ended December 31, 2025 and other documents the Company files with the SEC from time to time. Actual results, performance or achievements could differ materially from those contemplated, expressed, or implied by the forward-looking statements due to additional risks and uncertainties of which the Company is not currently aware or which it does not currently view as, but in the future may become, material to its business or operating results. Due to these and other possible uncertainties and risks, the Company can give no assurance that the results contemplated in the forward-looking statements will be realized and readers are cautioned not to place undue reliance on the forward-looking statements contained in this press release. Any forward-looking statements presented herein are made only as of the date of this press release, and the Company does not undertake any obligation to update or revise any forward-looking statements to reflect changes in assumptions, new information, the occurrence of unanticipated events, or otherwise, except as required by applicable law.
For Further Information, Contact:
GBank Financial Holdings Inc.
Edward Nigro
Executive Chairman and CEO
702-851-4200
enigro@g.bank
| GBank Financial Holdings Inc. Condensed Consolidated Balance Sheets (Unaudited) | ||||||||||||||||||||||||||||||||||
| Linked Quarter | Quarter Year-Over-Year | |||||||||||||||||||||||||||||||||
| 3/31/26 vs. 12/31/25 | 3/31/26 vs. 3/31/25 | |||||||||||||||||||||||||||||||||
| ($'s in 000, except per share data) | Mar 31, 2026 | Dec 31, 2025 | Sep 30, 2025 | Jun 30, 2025 | Mar 31, 2025 | $ Var | % Var | $ Var | % Var | |||||||||||||||||||||||||
| Assets | ||||||||||||||||||||||||||||||||||
| Cash and Due From Banks | - | 4,960 | - | 5,326 | - | 4,988 | - | 11,877 | - | 6,701 | - | (366 | - | -6.9 | - | - | (1,741 | - | -26.0 | - | ||||||||||||||
| Interest-Bearing Deposits With Other Financial Institutions | 103,134 | 192,538 | 98,402 | 131,352 | 140,270 | (89,404 | - | -46.4 | - | (37,136 | - | -26.5 | - | |||||||||||||||||||||
| Total Cash and Cash Equivalents | 108,094 | 197,864 | 103,390 | 143,229 | 146,971 | (89,770 | - | -45.4 | - | (38,877 | - | -26.5 | - | |||||||||||||||||||||
| Investment Securities: | ||||||||||||||||||||||||||||||||||
| Available For Sale, at Fair Value | 111,320 | 71,038 | 85,774 | 82,886 | 71,468 | 40,282 | 56.7 | - | 39,852 | 55.8 | - | |||||||||||||||||||||||
| Held to Maturity, at Amortized Cost | - | - | 38,578 | 39,515 | 39,903 | - | 0.0 | - | (39,903 | - | -100.0 | - | ||||||||||||||||||||||
| Loans Held For Sale | 74,507 | 46,009 | 66,791 | 45,242 | 41,313 | 28,498 | 61.9 | - | 33,194 | 80.3 | - | |||||||||||||||||||||||
| Loans, Net of Deferred Fees and Costs: | ||||||||||||||||||||||||||||||||||
| Commercial and Industrial | 81,623 | 80,216 | 66,226 | 59,021 | 56,885 | 1,407 | 1.8 | - | 24,738 | 43.5 | - | |||||||||||||||||||||||
| Commercial Real Estate - Non-owner Occupied | 823,966 | 750,565 | 743,084 | 682,021 | 672,379 | 73,401 | 9.8 | - | 151,587 | 22.5 | - | |||||||||||||||||||||||
| Commercial Real Estate - Owner Occupied | 91,578 | 94,576 | 97,396 | 96,526 | 81,768 | (2,998 | - | -3.2 | - | 9,810 | 12.0 | - | ||||||||||||||||||||||
| Construction and Land Development | 2,270 | 2,288 | 2,115 | 4,371 | 3,201 | (18 | - | -0.8 | - | (931 | - | -29.1 | - | |||||||||||||||||||||
| Multifamily | 18,930 | 18,950 | 18,979 | 18,987 | 19,011 | (20 | - | -0.1 | - | (81 | - | -0.4 | - | |||||||||||||||||||||
| Residential | 816 | 1,316 | 3,828 | 6,810 | 7,619 | (500 | - | -38.0 | - | (6,803 | - | -89.3 | - | |||||||||||||||||||||
| Consumer | 5,953 | 11,358 | 8,963 | 3,894 | 2,502 | (5,405 | - | -47.6 | - | 3,451 | 137.9 | - | ||||||||||||||||||||||
| Total Loans, Net of Deferred Fees and Costs | 1,025,136 | 959,269 | 940,591 | 871,630 | 843,365 | 65,867 | 6.9 | - | 181,771 | 21.6 | - | |||||||||||||||||||||||
| Less: Allowance for Credit Losses | (10,755 | - | (9,890 | - | (10,577 | - | (9,205 | - | (8,997 | - | (865 | - | 8.7 | - | (1,758 | - | 19.5 | - | ||||||||||||||||
| Total Net Loans | 1,014,381 | 949,379 | 930,014 | 862,425 | 834,368 | 65,002 | 6.8 | - | 180,013 | 21.6 | - | |||||||||||||||||||||||
| Loan Servicing Asset | 11,376 | 11,140 | 10,621 | 9,736 | 9,231 | 236 | 2.1 | - | 2,145 | 23.2 | - | |||||||||||||||||||||||
| Restricted Investment in Bank Stock | 5,513 | 5,513 | 5,513 | 5,513 | 4,652 | - | 0.0 | - | 861 | 18.5 | - | |||||||||||||||||||||||
| All Other Assets | 68,621 | 78,548 | 60,697 | 43,878 | 42,106 | (9,927 | - | -12.6 | - | 26,515 | 63.0 | - | ||||||||||||||||||||||
| Total Assets | - | 1,393,812 | - | 1,359,491 | - | 1,301,378 | - | 1,232,424 | - | 1,190,012 | - | 34,321 | 2.5 | - | - | 203,800 | 17.1 | - | ||||||||||||||||
| Liabilities | ||||||||||||||||||||||||||||||||||
| Non-Interest Bearing Demand | - | 215,063 | - | 214,127 | - | 227,921 | - | 228,913 | - | 242,650 | - | 936 | 0.4 | - | - | (27,587 | - | -11.4 | - | |||||||||||||||
| Interest Bearing Demand | 79,186 | 70,966 | 63,741 | 57,254 | 62,035 | 8,220 | 11.6 | - | 17,151 | 27.6 | - | |||||||||||||||||||||||
| Savings and Money Market | 281,426 | 289,038 | 281,435 | 309,559 | 280,056 | (7,612 | - | -2.6 | - | 1,370 | 0.5 | - | ||||||||||||||||||||||
| Certificates of Deposit | 595,290 | 568,564 | 519,080 | 436,738 | 411,201 | 26,726 | 4.7 | - | 184,089 | 44.8 | - | |||||||||||||||||||||||
| Total Deposits | 1,170,965 | 1,142,695 | 1,092,177 | 1,032,464 | 995,942 | 28,270 | 2.5 | - | 175,023 | 17.6 | - | |||||||||||||||||||||||
| Short-Term Borrowings | - | 371 | - | - | - | (371 | - | -100.0 | - | - | -100.0 | - | ||||||||||||||||||||||
| Subordinated Debt | 30,326 | 26,163 | 26,144 | 26,126 | 26,107 | 4,163 | 15.9 | - | 4,219 | 16.2 | - | |||||||||||||||||||||||
| Operating Lease Liability | 5,571 | 5,757 | 5,942 | 6,121 | 6,299 | (186 | - | -3.2 | - | (728 | - | -11.6 | - | |||||||||||||||||||||
| Other Liabilities | 19,328 | 18,750 | 18,922 | 15,964 | 15,048 | 578 | 3.1 | - | 4,280 | 28.4 | - | |||||||||||||||||||||||
| Total Liabilities | 1,226,190 | 1,193,736 | 1,143,185 | 1,080,675 | 1,043,396 | 32,454 | 2.7 | - | 182,794 | 17.5 | - | |||||||||||||||||||||||
| Equity | ||||||||||||||||||||||||||||||||||
| Common Stock | 1 | 1 | 1 | 1 | 1 | - | 0.0 | - | - | 0.0 | - | |||||||||||||||||||||||
| Additional Paid-in Capital | 81,999 | 80,405 | 80,016 | 79,291 | 78,718 | 1,594 | 2.0 | - | 3,281 | 4.2 | - | |||||||||||||||||||||||
| Retained Earnings | 86,681 | 85,366 | 77,970 | 73,662 | 68,906 | 1,315 | 1.5 | - | 17,775 | 25.8 | - | |||||||||||||||||||||||
| Accumulated Other Comprehensive (Loss) Income | (1,059 | - | (17 | - | 206 | (1,205 | - | (1,009 | - | (1,042 | - | 6129.4 | - | (50 | - | 5.0 | - | |||||||||||||||||
| Total Stockholders' Equity | 167,622 | 165,755 | 158,193 | 151,749 | 146,616 | 1,867 | 1.1 | - | 21,006 | 14.3 | - | |||||||||||||||||||||||
| Total Liabilities & Stockholders' Equity | - | 1,393,812 | - | 1,359,491 | - | 1,301,378 | - | 1,232,424 | - | 1,190,012 | - | 34,321 | 2.5 | - | - | 203,800 | 17.1 | - | ||||||||||||||||
| Book Value Per Common Share | - | 11.58 | - | 11.52 | - | 11.07 | - | 10.63 | - | 10.27 | - | 0.06 | 0.5 | - | - | 1.31 | 12.8 | - | ||||||||||||||||
| GBank Financial Holdings Inc. Condensed Consolidated Income Statements (Unaudited) | ||||||||||||||||||||
| Three Months Ended | ||||||||||||||||||||
| ($'s in 000, except per share data) | Mar 31, 2026 | Dec 31, 2025 | Sep 30, 2025 | Jun 30, 2025 | Mar 31, 2025 | |||||||||||||||
| Interest Income | ||||||||||||||||||||
| Loans | - | 18,958 | - | 20,196 | - | 18,919 | - | 17,659 | - | 16,836 | ||||||||||
| Deposits With Other Financial Institutions | 1,257 | 1,018 | 1,160 | 1,365 | 1,192 | |||||||||||||||
| Investment Securities | 1,102 | 1,404 | 1,421 | 1,414 | 1,281 | |||||||||||||||
| Other Interest Bearing Balances | 277 | 121 | 122 | 117 | 100 | |||||||||||||||
| Total Interest Income | 21,594 | 22,739 | 21,622 | 20,555 | 19,409 | |||||||||||||||
| Interest Expense | ||||||||||||||||||||
| Deposits | 8,893 | 8,998 | 8,339 | 7,905 | 7,230 | |||||||||||||||
| Short-term Borrowings and Subordinated Debt | 510 | 286 | 285 | 262 | 285 | |||||||||||||||
| Total Interest Expense | 9,403 | 9,284 | 8,624 | 8,167 | 7,515 | |||||||||||||||
| Net Interest Income | 12,191 | 13,455 | 12,998 | 12,388 | 11,894 | |||||||||||||||
| (Provision) Net Benefit for Credit Losses - Loans | (2,323 | - | 130 | (2,207 | - | (1,079 | - | (710 | - | |||||||||||
| Net Benefit (Provision) for Credit Losses - Unfunded Commitments | 30 | 52 | (12 | - | (13 | - | (11 | - | ||||||||||||
| Net Interest Income after Provision for Credit Losses | 9,898 | 13,637 | 10,779 | 11,296 | 11,173 | |||||||||||||||
| Non-Interest Income | ||||||||||||||||||||
| Gain on Sales of Loans | 3,790 | 3,625 | 3,592 | 2,593 | 2,537 | |||||||||||||||
| Loan Servicing Income | 998 | 963 | 762 | 750 | 703 | |||||||||||||||
| Service Charges and Fees | 58 | 56 | 60 | 54 | 56 | |||||||||||||||
| Net Interchange Fees | 2,191 | 1,806 | 2,406 | 1,535 | 2,003 | |||||||||||||||
| Gain on Sale of Investment Securities | - | 426 | - | - | - | |||||||||||||||
| Other Income | 417 | 387 | 357 | 452 | 164 | |||||||||||||||
| Total Non-Interest Income | 7,454 | 7,263 | 7,177 | 5,384 | 5,463 | |||||||||||||||
| Non-Interest Expenses | ||||||||||||||||||||
| Salaries and Employee Benefits | 6,750 | 6,237 | 6,589 | 6,235 | 6,400 | |||||||||||||||
| Occupancy Expenses | 410 | 410 | 418 | 400 | 392 | |||||||||||||||
| Other Expenses | 8,716 | 4,813 | 5,310 | 3,761 | 4,115 | |||||||||||||||
| Total Non-Interest Expenses | 15,876 | 11,460 | 12,317 | 10,396 | 10,907 | |||||||||||||||
| Income Before Provision For Income Taxes | 1,476 | 9,440 | 5,639 | 6,284 | 5,729 | |||||||||||||||
| Provision For Income Taxes | (139 | - | (2,026 | - | (1,282 | - | (1,486 | - | (1,224 | - | ||||||||||
| Net Income Before Equity Investment Loss | 1,337 | 7,414 | 4,357 | 4,798 | 4,505 | |||||||||||||||
| Net Loss Attributable to Equity Investment | (22 | - | (18 | - | (49 | - | (43 | - | (35 | - | ||||||||||
| Net Income | - | 1,315 | - | 7,396 | - | 4,308 | - | 4,755 | - | 4,470 | ||||||||||
| Earnings Per Share | - | 0.09 | - | 0.52 | - | 0.30 | - | 0.33 | - | 0.31 | ||||||||||
| Earnings Per Share (Diluted) | - | 0.09 | - | 0.51 | - | 0.30 | - | 0.33 | - | 0.31 | ||||||||||
| Average Common Shares Outstanding | 14,415 | 14,360 | 14,280 | 14,274 | 14,256 | |||||||||||||||
| Diluted Average Common Shares Outstanding | 14,506 | 14,555 | 14,525 | 14,551 | 14,549 | |||||||||||||||
| GBank Financial Holdings Inc. Quarter-to-Date Average Balances, Rates, and Interest Income and Expense (Unaudited) | |||||||||||||||||||||||||||||||||
| For the Three Months Ended | |||||||||||||||||||||||||||||||||
| March 31, 2026 | December 31, 2025 | March 31, 2025 | |||||||||||||||||||||||||||||||
| (Dollars in thousands) | Average | Yield/ | Average | Yield/ | Average | Yield/ | |||||||||||||||||||||||||||
| Balance | Interest | Rate(1) | Balance | Interest | Rate(1) | Balance | Interest | Rate(1) | |||||||||||||||||||||||||
| ASSETS: | |||||||||||||||||||||||||||||||||
| Interest Bearing Deposits | - | 132,062 | - | 1,257 | 3.86 | - | - | 96,621 | - | 1,018 | 4.18 | - | - | 102,628 | - | 1,192 | 4.71 | - | |||||||||||||||
| Investment Securities: | |||||||||||||||||||||||||||||||||
| Taxable | 101,725 | 1,102 | 4.39 | - | 123,431 | 1,404 | 4.51 | - | 105,222 | 1,281 | 4.94 | - | |||||||||||||||||||||
| Loans and Loans Held For Sale | 1,041,831 | 18,958 | 7.38 | - | 1,041,955 | 20,196 | 7.69 | - | 866,690 | 16,836 | 7.88 | - | |||||||||||||||||||||
| Restricted Investment in Bank Stock | 5,513 | 277 | 20.38 | - | 5,513 | 121 | 8.71 | - | 4,652 | 100 | 8.72 | - | |||||||||||||||||||||
| Total Earning Assets | 1,281,131 | 21,594 | 6.84 | - | 1,267,520 | 22,739 | 7.12 | - | 1,079,192 | 19,409 | 7.29 | - | |||||||||||||||||||||
| Cash and Due From Banks | 6,108 | 6,834 | 6,216 | ||||||||||||||||||||||||||||||
| Other Assets | 68,981 | 61,709 | 39,177 | ||||||||||||||||||||||||||||||
| Total Assets | - | 1,356,220 | - | 1,336,063 | - | 1,124,585 | |||||||||||||||||||||||||||
| LIABILITIES & STOCKHOLDERS' EQUITY | |||||||||||||||||||||||||||||||||
| Deposits: | |||||||||||||||||||||||||||||||||
| Interest-bearing Demand | - | 73,173 | 521 | 2.89 | - | - | 67,611 | 415 | 2.44 | - | - | 65,693 | 355 | 2.19 | - | ||||||||||||||||||
| Money Market and Savings | 275,878 | 2,545 | 3.74 | - | 288,993 | 2,714 | 3.73 | - | 264,085 | 2,411 | 3.70 | - | |||||||||||||||||||||
| Certificates of Deposit | 569,474 | 5,828 | 4.15 | - | 547,516 | 5,869 | 4.25 | - | 385,704 | 4,464 | 4.69 | - | |||||||||||||||||||||
| Total Interest-Bearing Deposits | 918,525 | 8,893 | 3.93 | - | 904,120 | 8,998 | 3.95 | - | 715,482 | 7,230 | 4.10 | - | |||||||||||||||||||||
| Short-Term Borrowings | 14 | - | 0.00 | - | 4 | - | 0.00 | - | - | - | 0.00 | - | |||||||||||||||||||||
| Subordinated Debt | 29,008 | 510 | 7.13 | - | 26,151 | 286 | 4.34 | - | 26,095 | 285 | 4.43 | - | |||||||||||||||||||||
| Total Interest-Bearing Liabilities | 947,547 | 9,403 | 4.02 | - | 930,275 | 9,284 | 3.96 | - | 741,577 | 7,515 | 4.11 | - | |||||||||||||||||||||
| Noninterest-bearing Deposits | 212,683 | 216,455 | 218,874 | ||||||||||||||||||||||||||||||
| Other Liabilities | 25,098 | 26,582 | 20,139 | ||||||||||||||||||||||||||||||
| Stockholders' Equity | 170,892 | 162,751 | 143,995 | ||||||||||||||||||||||||||||||
| Total Liabilities & Stockholders' Equity | - | 1,356,220 | - | 1,336,063 | - | 1,124,585 | |||||||||||||||||||||||||||
| Net Interest Income | - | 12,191 | - | 13,455 | - | 11,894 | |||||||||||||||||||||||||||
| Total Yield on Earning Assets | 6.84 | - | 7.12 | - | 7.29 | - | |||||||||||||||||||||||||||
| Cost on Interest-Bearing Liabilities | 4.02 | - | 3.96 | - | 4.11 | - | |||||||||||||||||||||||||||
| Average Interest Spread | 2.82 | - | 3.16 | - | 3.18 | - | |||||||||||||||||||||||||||
| Net Interest Margin | 3.86 | - | 4.21 | - | 4.47 | - | |||||||||||||||||||||||||||
| (1) Ratios are annualized on an actual/actual basis | |||||||||||||||||||||||||||||||||
| GBank Financial Holdings Inc. Additional Financial Information (Unaudited) | ||||||||||||||||||||
| Three Months Ended | ||||||||||||||||||||
| ($'s in 000, except per share data) | Mar 31, 2026 | Dec 31, 2025 | Sep 30, 2025 | Jun 30, 2025 | Mar 31, 2025 | |||||||||||||||
| Key Performance Metrics | ||||||||||||||||||||
| Return on Average Assets-Net Income(1) | 0.39 | - | 2.20 | - | 1.37 | - | 1.59 | - | 1.61 | - | ||||||||||
| Return on Average Stockholders' Equity(1) | 3.12 | - | 18.03 | - | 10.89 | - | 12.62 | - | 12.59 | - | ||||||||||
| Efficiency Ratio | 80.81 | - | 55.31 | - | 61.05 | - | 58.50 | - | 62.84 | - | ||||||||||
| Net Interest Margin(1) | 3.86 | - | 4.21 | - | 4.35 | - | 4.31 | - | 4.47 | - | ||||||||||
| Net Revenue(2) | - | 19,645 | - | 20,718 | - | 20,175 | - | 17,772 | - | 17,357 | ||||||||||
| Common Equity / Assets | 12.03 | - | 12.19 | - | 12.16 | - | 12.30 | - | 12.32 | - | ||||||||||
| Tier 1 Leverage Ratio - Bank | 13.43 | - | 13.42 | - | 13.72 | - | 13.82 | - | 14.23 | - | ||||||||||
| Selected Loan Metrics | ||||||||||||||||||||
| Guaranteed Portion of Loans Held for Sale | - | 74,507 | - | 46,009 | - | 66,791 | - | 45,242 | - | 41,313 | ||||||||||
| Guaranteed Portion of Loans Held for Investment | 177,617 | 183,739 | 193,688 | 192,324 | 204,239 | |||||||||||||||
| Total Guaranteed Loans | 252,124 | 229,748 | 260,479 | 237,566 | 245,552 | |||||||||||||||
| Guaranteed Loans as a Percent of Total Loans(2) | 17.3 | - | 19.2 | - | 20.6 | - | 22.1 | - | 24.2 | - | ||||||||||
| SBA Loan Originations | - | 189,851 | - | 106,744 | - | 207,683 | - | 132,256 | - | 129,351 | ||||||||||
| SBA Loans Sold | - | 79,036 | - | 92,258 | - | 110,820 | - | 82,140 | - | 68,720 | ||||||||||
| Gain on Loan Sales Margin(2) | 4.79 | - | 3.93 | - | 3.24 | - | 3.16 | - | 3.69 | - | ||||||||||
| Asset Quality | ||||||||||||||||||||
| Total nonaccrual loans | - | 39,736 | - | 32,141 | - | 34,608 | - | 18,227 | - | 19,220 | ||||||||||
| Loans past due 90 days and still accruing | - | 854 | 184 | 146 | 1,153 | |||||||||||||||
| Other real estate owned | 4,401 | 4,401 | 2,684 | - | - | |||||||||||||||
| Total non-performing assets | - | 44,137 | - | 37,396 | - | 37,476 | - | 18,373 | - | 20,373 | ||||||||||
| Non-performing assets: guaranteed portion | - | 30,949 | - | 24,849 | - | 27,112 | - | 13,792 | - | 14,687 | ||||||||||
| Non-performing assets: non-guaranteed portion | - | 13,188 | - | 12,547 | - | 10,364 | - | 4,581 | - | 5,686 | ||||||||||
| Non-performing assets to total assets | 3.17 | - | 2.75 | - | 2.88 | - | 1.49 | - | 1.71 | - | ||||||||||
| Non-performing assets, excluding guaranteed, to total assets(2) | 0.95 | - | 0.92 | - | 0.80 | - | 0.37 | - | 0.48 | - | ||||||||||
| Net charge-offs | - | 1,457 | - | 557 | - | 836 | - | 870 | - | 828 | ||||||||||
| Loans past due 30-89 days and accruing | - | 6,255 | - | 9,843 | - | 3,595 | - | 8,182 | - | 14,853 | ||||||||||
| Loans past due 30-89 days and accruing: guaranteed portion | - | 2,474 | - | 4,574 | - | 2,351 | - | 5,650 | - | 11,915 | ||||||||||
| Loans past due 30-89 days and accruing: non-guaranteed portion | - | 3,781 | - | 5,269 | - | 1,244 | - | 2,532 | - | 2,938 | ||||||||||
| Allowance for credit losses (ACL) | - | 10,755 | - | 9,890 | - | 10,577 | - | 9,205 | - | 8,997 | ||||||||||
| Nonaccrual loans | - | 39,736 | - | 32,141 | - | 34,608 | - | 18,227 | - | 19,220 | ||||||||||
| ACL to nonaccrual loans | 27 | - | 31 | - | 31 | - | 51 | - | 47 | - | ||||||||||
| ACL to nonaccrual loans, excluding guaranteed(2) | 122 | - | 136 | - | 141 | - | 208 | - | 168 | - | ||||||||||
| ACL to loans | 1.05 | - | 1.03 | - | 1.12 | - | 1.06 | - | 1.07 | - | ||||||||||
| ACL to loans, excluding guaranteed(2) | 1.27 | - | 1.28 | - | 1.42 | - | 1.36 | - | 1.41 | - | ||||||||||
| Book Value | ||||||||||||||||||||
| Stockholders' Equity | - | 167,622 | - | 165,755 | - | 158,193 | - | 151,749 | - | 146,616 | ||||||||||
| Common shares outstanding | 14,470 | 14,385 | 14,288 | 14,274 | 14,271 | |||||||||||||||
| Book value per common share | - | 11.58 | - | 11.52 | - | 11.07 | - | 10.63 | - | 10.27 | ||||||||||
| Full-Time Equivalent Employees | 189 | 184 | 187 | 188 | 175 | |||||||||||||||
| (1) Ratios are annualized on an actual/actual basis | ||||||||||||||||||||
| (2) See Reconciliation of Non-GAAP Financial Measures | ||||||||||||||||||||
| GBank Financial Holdings Inc. Reconciliation of Non-GAAP Financial Measures (Unaudited) | ||||||||||||||||||||
| Three Months Ended | ||||||||||||||||||||
| ($'s in 000, except per share data) | Mar 31, 2026 | Dec 31, 2025 | Sep 30, 2025 | Jun 30, 2025 | Mar 31, 2025 | |||||||||||||||
| Net Revenue(1) | ||||||||||||||||||||
| Net Interest Income | - | 12,191 | - | 13,455 | - | 12,998 | - | 12,388 | - | 11,894 | ||||||||||
| Non-Interest Income | 7,454 | 7,263 | 7,177 | 5,384 | 5,463 | |||||||||||||||
| Net Revenue | - | 19,645 | - | 20,718 | - | 20,175 | - | 17,772 | - | 17,357 | ||||||||||
| Adjusted Diluted Earnings Per Share Excluding Unusual Items(2) | ||||||||||||||||||||
| Net Income | - | 1,315 | - | 7,396 | - | 4,308 | - | 4,755 | - | 4,470 | ||||||||||
| Unusual Items: | ||||||||||||||||||||
| Form S-1 and Uplift Costs | - | - | 30 | 290 | 759 | |||||||||||||||
| Severance Expenses | - | 257 | 1,001 | - | - | |||||||||||||||
| Credit Card Fraud Losses | 4,213 | - | - | - | - | |||||||||||||||
| Costs Incurred Related to Discontinued Credit Card Marketing Campaign | - | 416 | 1,692 | - | - | |||||||||||||||
| Net Gain on Sales of Investment Securities | - | (426 | - | - | - | - | ||||||||||||||
| Tax Effect of Unusual Expenses(a) | (963 | - | (55 | - | (605 | - | (64 | - | (169 | - | ||||||||||
| Net Income Excluding Unusual Items | - | 4,565 | - | 7,588 | - | 6,426 | - | 4,981 | - | 5,060 | ||||||||||
| Weighted average diluted shares outstanding | 14,506 | 14,555 | 14,525 | 14,551 | 14,549 | |||||||||||||||
| Diluted Earnings Per Share | - | 0.09 | - | 0.51 | - | 0.30 | - | 0.33 | - | 0.31 | ||||||||||
| Adjusted Diluted Earnings Per Share Excluding Unusual Expenses | - | 0.31 | - | 0.52 | - | 0.44 | - | 0.34 | - | 0.35 | ||||||||||
| Gain on Loan Sales Margin(1) | ||||||||||||||||||||
| Gain on Sale of Loans | - | 3,790 | - | 3,625 | - | 3,592 | - | 2,593 | - | 2,537 | ||||||||||
| Loans Sold | 79,036 | 92,258 | 110,820 | 82,140 | 68,720 | |||||||||||||||
| Gain on Loan Sales Margin | 4.79 | - | 3.93 | - | 3.24 | - | 3.16 | - | 3.69 | - | ||||||||||
| Guaranteed Loans as a Percent of Loans(3) | ||||||||||||||||||||
| SBA and USDA Guaranteed Loans | - | 177,617 | - | 183,739 | - | 193,688 | - | 192,324 | - | 204,239 | ||||||||||
| Loans, Net of Deferred Fees and Costs | 1,025,136 | 959,269 | 940,591 | 871,630 | 843,365 | |||||||||||||||
| Guaranteed Loans as a % of Loans | 17.3 | - | 19.2 | - | 20.6 | - | 22.1 | - | 24.2 | - | ||||||||||
| Non-performing assets, excluding guaranteed, to total assets(3) | ||||||||||||||||||||
| Non-performing assets | - | 44,137 | - | 37,396 | - | 37,476 | - | 18,373 | - | 20,373 | ||||||||||
| Less: SBA and USDA guaranteed portions of non-performing assets | 30,949 | 24,849 | 27,112 | 13,792 | 14,687 | |||||||||||||||
| Non-performing assets, excluding guaranteed portions | 13,188 | 12,547 | 10,364 | 4,581 | 5,686 | |||||||||||||||
| Total assets | 1,393,812 | 1,359,491 | 1,301,378 | 1,232,424 | 1,190,012 | |||||||||||||||
| Non-performing assets, excluding guaranteed, to total assets | 0.95 | - | 0.92 | - | 0.80 | - | 0.37 | - | 0.48 | - | ||||||||||
| Allowance for credit losses (ACL) to nonaccrual loans, excluding guaranteed(3) | ||||||||||||||||||||
| Nonaccrual loans | - | 39,736 | - | 32,141 | - | 34,608 | - | 18,227 | - | 19,220 | ||||||||||
| Less: SBA and USDA guaranteed portions of nonaccrual loans | 30,949 | 27,111 | 13,792 | 13,859 | 9,321 | |||||||||||||||
| Nonaccrual loans, excluding guaranteed portions | 8,787 | 5,030 | 20,816 | 4,368 | 9,899 | |||||||||||||||
| ACL to nonaccrual loans, excluding guaranteed | 122 | - | 197 | - | 51 | - | 211 | - | 91 | - | ||||||||||
| ACL to loans, excluding guaranteed(3) | ||||||||||||||||||||
| Loans, net of deferred fees and costs | - | 1,025,136 | - | 959,269 | - | 940,591 | - | 871,630 | - | 843,365 | ||||||||||
| Less: SBA and USDA guaranteed portions of loans | 177,617 | 183,739 | 193,688 | 192,324 | 204,239 | |||||||||||||||
| Loans, excluding guaranteed | 847,519 | 775,530 | 746,903 | 679,306 | 639,126 | |||||||||||||||
| ACL to loans, excluding guaranteed | 1.27 | - | 1.28 | - | 1.42 | - | 1.36 | - | 1.41 | - | ||||||||||
| Non-GAAP Financial Measures Footnotes | ||||||||||||||||||||
| (1) We utilize this non-GAAP measurement to present trends in income generation of the Company. | ||||||||||||||||||||
| (2) We utilize this non-GAAP measurement to present the core earnings and core ratios of the Company by excluding certain significant one-time expenses. | ||||||||||||||||||||
| (3) We utilize these non-GAAP measurements to provide useful metrics regarding the at-risk assets of the Company. | ||||||||||||||||||||
| (a) Estimated tax impact calculated using each respective period's effective tax rate. | ||||||||||||||||||||
GBank Financial Holdings Inc.
Exhibit A
(Unaudited)
A photo accompanying this announcement is available at: https://www.globenewswire.com/NewsRoom/AttachmentNg/b087bc01-7a41-48c8-914e-9f8e51fe0a18

