

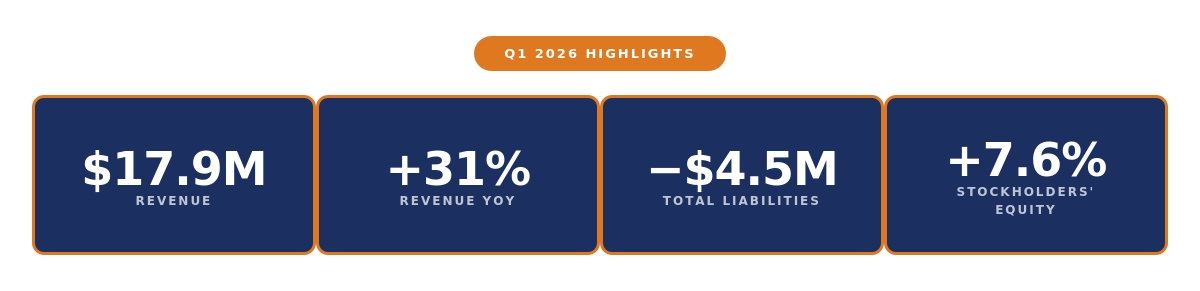
Record Q1 revenue of $17.9M, up 31% from $13.71 million in Q1 2025, reflecting strength across all core segments
Total liabilities decreased by $4.5M, or 9.6%, driven by a substantial reduction in convertible note and credit facility balances
Stockholders' equity increased by $1.4M, or 7.6%, with the liabilities-to-assets ratio improving by 370 basis points
Adjusted EBITDA near breakeven as increased revenue was offset by strategic investments to support global growth
Record momentum continues into Q2 2026 with U.S. expansion actively underway
CHICAGO, IL / ACCESS Newswire / May 21, 2026 / Cosmos Health Inc. ("Cosmos Health" or the "Company") (NASDAQ:COSM), a diversified, vertically integrated global healthcare group, today reported financial results for the first quarter ended March 31, 2026.
First Quarter 2026 Financial Highlights
Income Statement
Cosmos Health delivered the highest Q1 revenue in Company history with continued progress toward adjusted profitability, reflecting broad-based commercial strength - over 75 new pharmacies added at CosmoFarm, growing Sky Premium Life order activity across multiple markets, and expanded contract manufacturing agreements at Cana Laboratories.
Revenue was $17.93 million, an increase of 30.7% from $13.71 million in Q1 2025, reflecting strong sales momentum across all core divisions.
Adjusted revenue was $18.40 million, up 34.2% year-over-year, reflecting a $470,601 sales discount reversal.
Gross profit was $1.38 million in Q1 2026, compared to $2.05 million in Q1 2025, reflecting a revenue mix shift toward wholesale distribution activity at CosmoFarm, compounded by the aforementioned sales discount adjustment.
Adjusted gross profit was $1.85 million, reflecting the sales discount reversal applied to revenue.
Total operating expenses increased to $3.57 million in Q1 2026, compared to $2.88 million in Q1 2025, reflecting strategic investments in personnel, infrastructure, technology, and AI-driven efficiencies to support global growth initiatives.
Net income (loss) was ($2.81 million) in Q1 2026, compared to ($0.82 million) in Q1 2025. The increase is driven principally by $1.15 million of non-cash, non-operational items:
$390,350 in non-cash interest on convertible facilities
$442,439 in digital asset mark-to-market losses
$313,157 in foreign currency translation losses
Adjusted EBITDA was ($229,596) in Q1 2026, near breakeven, as increased revenue was offset by higher expenses reflecting the Company's ongoing investments in global growth initiatives.
Adjusted Net Income (Loss) was ($996,502), driven by $766,906 in interest expense incurred in support of the Company's growth investments.
Balance Sheet
Cosmos Health continued to improve its balance sheet in Q1 2026, with active debt reduction and working capital optimization driving an improvement in the liabilities-to-assets ratio to 68.2% from 71.9% at year-end 2025.
Total assets were $62.37 million as of March 31, 2026, compared to $65.48 million at December 31, 2025, reflecting a diversified asset base with solid liquidity, a strong inventory position, and a significant real estate and intellectual property portfolio.
Liquid assets totaled $4.3 million, comprising cash and cash equivalents of $2.2 million as well as digital assets and marketable securities of $2.1 million.
Total liabilities decreased by $4.51 million, or 9.6%, to $42.54 million as of March 31, 2026, from $47.05 million at December 31, 2025, driven by a substantial reduction in convertible note and credit facility balances.
Total stockholders' equity increased by $1.40 million, or 7.6%, to $19.83 million as of March 31, 2026, up from $18.42 million at December 31, 2025.
Management Commentary
Greg Siokas, CEO of Cosmos Health, stated: "Q1 2026 was a record Q1 for Cosmos Health, with revenue of $17.93 million, up 31% year-over-year and 34% on an adjusted basis, reflecting broad-based commercial momentum across every major division - record distribution volumes at CosmoFarm, continued global expansion of Sky Premium Life, and new contract manufacturing agreements at Cana Laboratories.
This momentum is continuing into Q2 2026, and we are focused on sustaining it well beyond this year. We believe Cosmos Health is entering a new phase of growth, driven by strategic investments across our organization - in personnel, facilities, infrastructure, technology, and AI-driven efficiencies - to support our global expansion plans, strengthen our R&D pipeline, and build the foundation for long-term sustainable value creation. A key pillar of this growth is our entry into the lucrative U.S. nutraceuticals market through the 18 Series platform. Adjusted EBITDA is near breakeven, and we expect it to turn positive as our growth investments drive meaningful returns and revenues continue to scale.
At the same time, we have been disciplined in managing our balance sheet. We reduced total liabilities by $4.5 million in a single quarter, a 9.6% reduction, driven by a substantial reduction in convertible note and credit facility balances. Meanwhile, stockholders' equity increased by 7.6%, our liabilities-to-assets ratio improved by 370 basis points, and our liquidity position remains solid, with $4.3 million in liquid assets including cash of $2.2 million, to support our growth plans.
Q1 2026 is an early indication of what we believe will be a period of significant growth for Cosmos Health, and we look forward to updating our shareholders as this story continues to unfold."
UNAUDITED CONDENSED CONSOLIDATED STATEMENTS OF OPERATIONS AND COMPREHENSIVE INCOME (LOSS)
| Three Months Ended March 31, |
| ||||||
| 2026 |
|
| 2025 |
| |||
(in $) |
|
|
|
|
|
| ||
GAAP Figures |
|
|
|
|
|
| ||
REVENUE |
|
| 17,927,892 |
|
|
| 13,712,528 |
|
GROSS PROFIT |
|
| 1,381,171 |
|
|
| 2,049,799 |
|
TOTAL OPERATING EXPENSES |
|
| (3,565,350 | ) |
|
| (2,882,944 | ) |
GAIN (LOSS) FROM OPERATIONS |
|
| (2,184,179 | ) |
|
| (833,145 | ) |
TOTAL OTHER INCOME (EXPENSE), NET |
|
| (621,244 | ) |
|
| 15,048 |
|
NET GAIN (LOSS) |
|
| (2,805,423 | ) |
|
| (818,097 | ) |
|
|
|
|
|
|
|
| |
NON-GAAP Figures* |
|
|
|
|
|
|
|
|
ADJUSTED REVENUE |
|
| 18,398,493 |
|
|
| 13,712,528 |
|
ADJUSTED GROSS PROFIT |
|
| 1,851,772 |
|
|
| 2,049,799 |
|
ADJUSTED EBITDA |
|
| (229,596 | ) |
|
| 373,119 |
|
ADJUSTED NET INCOME (LOSS) |
|
| (996,502 | ) |
|
| 277,338 |
|
(*) See "Definitions of Non-GAAP Measures" and "Reconciliation of Non-GAAP Measures" sections herein for an explanation and reconciliations of non-GAAP measures used throughout this release.
Definitions of Non-GAAP Measures
We collect and analyze operating and financial data to evaluate the health of our business and assess our performance. In addition to Revenue, Gross Profit, Income (Loss) from Operations and Net Income (Loss) under GAAP, we use: Adjusted Revenue, Adjusted Gross Profit, EBITDA, Adjusted EBITDA, and Adjusted Net Income (Loss). We have included these non-GAAP financial measures because they are key measures used by our management to evaluate our operating performance. Accordingly, we believe that these non-GAAP financial measures provide useful information to investors and others in understanding and evaluating our operating results in the same manner as our management team and Board of Directors. Therefore, these non-GAAP financial measures are presented here. Our calculation of these non-GAAP financial measures may differ from similarly titled non-GAAP measures, if any, reported by our peer companies. These non-GAAP financial measures should not be considered in isolation from, or as substitutes for, financial information prepared in accordance with GAAP.
Adjusted Revenue
We define Adjusted Revenue as GAAP Revenue adjusted to include revenues subject to revenue recognition timing adjustments. Adjusted Revenue is supplemental in nature and is not meant as a substitute for Revenue prepared in accordance with GAAP.
Adjusted Gross Profit
We define Adjusted Gross Profit as GAAP Gross Profit adjusted for the same revenue recognition timing adjustments described under Adjusted Revenue above. Adjusted Gross Profit is supplemental in nature and is not meant as a substitute for Gross Profit prepared in accordance with GAAP.
Adjusted EBITDA
We define Adjusted EBITDA as Income (Loss) before Income Taxes, excluding (i) depreciation and amortization expense, (ii) interest income (expense), net, (iii) non-cash interest expense, (iv) stock-based compensation expense, (v) non-recurring and extraordinary items, (vi) other income (expense), net, (vii) gain (loss) on equity investments and digital assets, net, (viii) change in fair value of derivative liability and convertible notes, (ix) foreign currency transaction, net, and (x) sales discount reversals.
We have included Adjusted EBITDA because it is a key measure used by our management team to evaluate our operating performance, generate future operating plans, and make strategic decisions. Accordingly, we believe that Adjusted EBITDA provides useful information to investors and others in understanding and evaluating our operating results in the same manner as our management team and Board of Directors. In addition, it provides a useful measure for period-to-period comparisons of our business, as it removes the effect of certain non-cash expenses and non-recurring and extraordinary items.
For investors to better evaluate the Company's performance and compare results across reporting periods, Cosmos Health provides a reconciliation of GAAP to non-GAAP financial measures. These adjustments exclude certain non-cash and non-recurring items, including stock-based compensation, non-cash interest expense, changes in the fair value of derivatives and convertible notes, gains or losses on digital assets, foreign currency transactions, sales discount reversals, and other non-operating or non-recurring items, as applicable and as further described above.
The presentation of the Company's non-GAAP financial measures is not meant to be considered in isolation or as a substitute for the Company's financial results prepared in accordance with GAAP, and the Company's non-GAAP measures may be different from non-GAAP measures used by other companies. Adjusted EBITDA has limitations as a financial measure, should be considered as supplemental in nature, and is not meant as a substitute for the related financial information prepared in accordance with GAAP.
Adjusted Net Income (Loss)
We define Adjusted Net Income (Loss) as Adjusted EBITDA (see above) adding provision for income taxes and deducting interest expense.
Adjusted Net Income (Loss) has limitations as a financial measure, should be considered as supplemental in nature, and is not meant as a substitute for the related financial information prepared in accordance with GAAP.
Reconciliation of Non-GAAP Measures
Adjusted Revenue, Adjusted Gross Profit, Adjusted EBITDA & Adjusted Net Income (Loss)
The following table presents reconciliations of Adjusted Revenue, Adjusted Gross Profit, Adjusted EBITDA and Adjusted Net Income (Loss) to the most directly comparable GAAP financial measures for each of the periods indicated.
| Three Months Ended March 31, |
| ||||||
| 2026 |
|
| 2025 |
| |||
(in $) |
|
|
|
|
|
| ||
REVENUE |
|
| 17,927,892 |
|
|
| 13,712,528 |
|
Sales discount reversal |
|
| 470,601 |
|
|
| - |
|
ADJUSTED REVENUE |
|
| 18,398,493 |
|
|
| 13,712,528 |
|
|
|
|
|
|
|
|
| |
GROSS PROFIT |
|
| 1,381,171 |
|
|
| 2,049,799 |
|
Sales discount reversal |
|
| 470,601 |
|
|
| - |
|
ADJUSTED GROSS PROFIT |
|
| 1,851,772 |
|
|
| 2,049,799 |
|
|
|
|
|
|
|
|
| |
INCOME (LOSS) BEFORE INCOME TAXES |
|
| (2,805,423 | ) |
|
| (818,097 | ) |
Adjustments (add back): |
|
|
|
|
|
|
|
|
Depreciation and amortization expense |
|
| 348,179 |
|
|
| 320,439 |
|
Interest (income) / expense, net |
|
| 766,906 |
|
|
| 95,781 |
|
EBITDA |
|
| (1,690,338 | ) |
|
| (401,877 | ) |
|
|
|
|
|
|
|
| |
Sales discount reversal |
|
| 470,601 |
|
|
| - |
|
|
|
|
|
|
|
|
| |
Non-recurring and extraordinary items |
|
| 245,116 |
|
|
| 135,621 |
|
Stock-based compensation |
|
| 535,786 |
|
|
| 556,611 |
|
Other income (expense), net |
|
| (86,161 | ) |
|
| 261,730 |
|
Change in fair value of derivative liability & convertible notes |
|
| (471,448 | ) |
|
| - |
|
(Gain) / loss on equity investments & digital assets, net |
|
| 453,691 |
|
|
| (3,142 | ) |
Foreign currency transaction, net |
|
| 313,157 |
|
|
| (175,824 | ) |
ADJUSTED EBITDA |
|
| (229,596 | ) |
|
| 373,119 |
|
Interest income / (expense), net |
|
| (766,906 | ) |
|
| (95,781 | ) |
ADJUSTED NET INCOME (LOSS) |
|
| (996,502 | ) |
|
| 277,338 |
|
CONDENSED CONSOLIDATED BALANCE SHEET DATA
| March 31, 2026 |
|
| December 31, 2025 |
|
| September 30, 2025 |
| ||||
(in $) |
| (Unaudited) |
|
| (Audited) |
|
| (Unaudited) |
| |||
ASSETS |
|
|
|
|
|
|
|
|
| |||
Cash & cash equivalents |
|
| 2,158,921 |
|
|
| 3,459,893 |
|
|
| 4,633,660 |
|
Inventory |
|
| 5,650,458 |
|
|
| 5,778,142 |
|
|
| 5,683,662 |
|
Accounts receivable, prepaid expenses and other current assets |
|
| 28,594,752 |
|
|
| 28,662,583 |
|
|
| 25,952,190 |
|
Property and equipment, net |
|
| 10,280,203 |
|
|
| 10,578,858 |
|
|
| 10,664,820 |
|
Goodwill and intangible assets, net |
|
| 7,225,011 |
|
|
| 7,569,695 |
|
|
| 7,960,633 |
|
Loans receivable |
|
| 3,605,388 |
|
|
| 3,633,839 |
|
|
| 7,666,483 |
|
Other noncurrent assets |
|
| 4,854,278 |
|
|
| 5,794,508 |
|
|
| 6,931,310 |
|
TOTAL ASSETS |
|
| 62,369,011 |
|
|
| 65,477,518 |
|
|
| 69,492,758 |
|
|
|
|
|
|
|
|
|
|
|
|
| |
LIABILITIES AND STOCKHOLDERS' EQUITY |
|
|
|
|
|
|
|
|
|
|
|
|
Accounts payable and accrued expenses |
|
| 15,689,061 |
|
|
| 17,412,973 |
|
|
| 15,198,777 |
|
Other current liabilities |
|
| 6,701,051 |
|
|
| 6,047,940 |
|
|
| 5,505,549 |
|
Lines of credit |
|
| 7,856,208 |
|
|
| 9,177,684 |
|
|
| 7,584,786 |
|
Notes payable |
|
| 9,954,812 |
|
|
| 11,485,084 |
|
|
| 15,956,667 |
|
Other non-current and finance/lease liabilities |
|
| 2,341,520 |
|
|
| 2,929,208 |
|
|
| 2,112,095 |
|
Stockholders' and mezzanine equity |
|
| 19,826,359 |
|
|
| 18,424,629 |
|
|
| 23,134,885 |
|
TOTAL LIABILITIES AND STOCKHOLDERS'/MEZZANINE EQUITY |
|
| 62,369,011 |
|
|
| 65,477,518 |
|
|
| 69,492,758 |
|
About Cosmos Health Inc.
Cosmos Health Inc. (Nasdaq:COSM), incorporated in 2009 in Nevada, is a diversified, vertically integrated global healthcare group. The Company owns a portfolio of proprietary pharmaceutical and nutraceutical brands, including Sky Premium Life, Mediterranation, bio-bebe, C-Sept and C-Scrub. Through its subsidiary Cana Laboratories S.A., licensed under European Good Manufacturing Practices (GMP) and certified by the European Medicines Agency (EMA), it manufactures pharmaceuticals, food supplements, cosmetics, biocides, and medical devices within the European Union. Cosmos Health also distributes a broad line of pharmaceuticals and parapharmaceuticals, including branded generics and OTC medications, to retail pharmacies and wholesale distributors through its subsidiaries in Greece and the UK. Furthermore, the Company has established R&D partnerships targeting major health disorders such as obesity, diabetes, and cancer, enhanced by artificial intelligence drug repurposing technologies, and focuses on the R&D of novel patented nutraceuticals, specialized root extracts, proprietary complex generics, and innovative OTC products. Cosmos Health has also entered the telehealth space through the acquisition of ZipDoctor, Inc., based in Texas, USA. With a global distribution platform, the Company is currently expanding throughout Europe, Asia, and North America, and has offices and distribution centers in Thessaloniki and Athens, Greece, and in Harlow, UK. More information is available atwww.cosmoshealthinc.com, www.skypremiumlife.com, www.cana.gr,www.zipdoctor.co, www.cloudscreen.gr, as well as LinkedIn and X.
Forward-Looking Statements
With the exception of the historical information contained in this news release, the matters described herein may contain forward-looking statements within the meaning of Section 27A of the Securities Act of 1933, as amended, and Section 21E of the Securities Exchange Act of 1934, as amended. Words such as "believes," "expects," "anticipates," "intends," "projects," "estimates," "plans," and similar expressions, or future or conditional verbs such as "will," "should," "would," "may," and "could," generally identify forward-looking statements, although not all forward-looking statements contain these words. These statements involve risks and uncertainties that may individually or materially affect the matters discussed herein for a variety of reasons outside the Company's control, including, but not limited to: the Company's ability to raise sufficient financing to implement its business plan; the effectiveness of its digital asset strategies, including accumulation and yield-generating activities; the impact of the war in Ukraine and ongoing conflicts in the Middle East and other regions on the Company's business, operations, and the economy in general; the Company's ability to successfully develop and commercialize its proprietary products and technologies; changes in interest rates; changes in foreign currency exchange rates, commodity or other price inflation and deflation; our ability to issue debt on terms and at rates acceptable to us; the impact and expected outcome of investigations, inquiries, claims, and litigation; the challenges of operating in international markets; the adequacy of insurance coverage; the effect of accounting charges and of adopting certain accounting standards; the impact of legal and regulatory changes, including changes to tax laws and regulations; guidance for fiscal 2026 and beyond and financial outlook. Forward-looking statements are based on currently available information and our current assumptions, expectations and projections about future events. You should not rely on our forward-looking statements. These statements are not guarantees of future performance and are subject to future events, risks and uncertainties - many of which are beyond our control, dependent on the actions of third parties, or currently unknown to us - as well as potentially inaccurate assumptions that could cause actual results to differ materially from our historical experience and our expectations and projections. These risks and uncertainties include, but are not limited to, those described from time to time in our periodic reports filed with the SEC and available at the SEC's website (www.sec.gov). There also may be other factors that we cannot anticipate or that are not described herein, generally because we do not currently perceive them to be material. Such factors could cause results to differ materially from our expectations. Forward-looking statements speak only as of the date they are made, and we do not undertake to update these statements other than as required by law. You are advised, however, to review any further disclosures we make on related subjects in our filings with the Securities and Exchange Commission and in our other public statements.
Investor Relations Contact:
BDG Communications
cosm@bdgcommunications.com
SOURCE: Cosmos Health Inc.
View the original press release on ACCESS Newswire:
https://www.accessnewswire.com/newsroom/en/healthcare-and-pharmaceutical/cosmos-health-reports-q1-2026-results-revenue-up-31-to-17.9m-new-q1-r-1169066
