

HIGHLIGHTS
Proven and Probable Mineral Reserves Up 17% to a Record 1.4 Million Ounces ("Moz"): Proven and probable mineral reserves increased to 5.4 million tonnes ("Mt") at 7.9 g/t for 1.4 Moz, led by 39% reserve growth at Eagle River, where the global model initiative converted near-mine tonnes at a US$1,800/oz gold price. This additional material improves mill utilization and extends mine life, while preserving flexibility to re-sequence the mine plan as higher-grade zones are delineated. Eagle River's high-margin profile remains fully intact as it more than replaced high-grade tonne depletion, added mineral reserves and extended its mine life.
Eight-Year Reserve Mine Life at Both Operations Through 2033: This is the first time in the Company's history that both assets are concurrently underpinned by 8-year reserve plans, providing the foundation for sustained production, disciplined capital allocation and ongoing reserve replacement.
Production Profile Expected to Increase up to 230,000 Ounces by 2028: Consolidated production is underpinned by stable output from Eagle River and growing levels of production from Kiena. Consolidated all-in sustaining costs1 are expected to remain broadly in line with 2026 guidance of US$1,525 - US$1,700/oz, with industry cost pressures expected to be largely offset by higher output and ongoing productivity initiatives.
Over $1 Billion in Free Cash Flow1 Over Three Years at US$4,000/oz Gold: The reserve-based plans demonstrate the strong cash-generating capacity of Wesdome's high-margin asset base, with resilient margins supporting growth initiatives and shareholder returns across a range of gold price environments.
Dividend Initiated, Share Buyback Expanded: The initiation of a quarterly dividend and expansion of the Company's share buyback program, alongside a fully funded growth profile, reflects a disciplined capital allocation framework designed to balance reinvestment and capital returns.
Inferred Mineral Resources Increased 87%, Expanding the Conversion Pipeline: Inferred mineral resources increased to 15.1 Mt at 2.5 g/t Au for a total of 1.2 Moz, led by a fourfold increase at Mishi. This provides an expanded base of inventory available for potential conversion to reserves.
Significant Upside Potential Beyond Reserves: Opportunities not included in mineral reserves include productivity, execution and optimization initiatives at both operations, conversion of mineral resources to reserves; and systematic testing of a potential mineralization exploration target of 2.4 to 6.3 Moz2 across both mines. These opportunities are expected to leverage existing infrastructure and provide multiple pathways to extend mine life and support potential future growth. The potential quantity of the exploration targets is conceptual in nature. There has been insufficient exploration to estimate and define a mineral resource, as defined by National Instrument 43-101 - Standards of Disclosure for Mineral Projects ("NI 43-101"), and it is uncertain if further exploration will result in the target being delineated as a mineral resource.
Toronto, Ontario--(Newsfile Corp. - June 24, 2026) - Wesdome Gold Mines Ltd. (TSX: WDO) (OTCQX: WDOFF) ("Wesdome" or the "Company") is pleased to announce the results of its updated mineral reserve and mineral resource ("MRMR") statement effective December 31, 2025 as well as the results of its upcoming independent technical reports (the "Technical Reports") for the Eagle River Mine ("Eagle River") and the Kiena Mine ("Kiena"), outlining an 8-year consolidated reserve mine life with robust upside potential. All amounts are expressed in Canadian dollars unless otherwise indicated.
The Technical Reports for both Eagle River and Kiena are being prepared in accordance with NI 43-101. The Technical Reports will be filed within the next 45 days on SEDAR+ at www.sedarplus.ca and posted on the Company's website www.wesdome.com.
The Company will be hosting a conference call and webcast tomorrow, June 25, 2026 at 8:30 a.m. ET, to discuss its updated mineral reserves and mineral resources, Technical Report highlights and organic growth opportunities beyond the current mine plan.
Anthea Bath, President and Chief Executive Officer, stated, "Today marks a defining milestone in Wesdome's evolution. We have increased mineral reserves, extended mine life across the portfolio and established mine plans that support a growing production profile, stronger operating performance and significant free cash flow generation. Importantly, we have strengthened the foundation from which we can continue to grow the business for many years to come.
"At Eagle River, we have delivered on our strategy to transition the operation into a larger, more resilient and longer-life mining complex. By incorporating additional tonnes into the mine plan, we are better utilizing existing mill capacity, while continuing to advance the high-grade exploration opportunities that have always differentiated the asset. The results demonstrate success on both fronts. Wesdome replaced the high-grade component of its reserve base while adding incremental tonnes that are economic at a US$1,800/oz gold price, supporting a stronger and more durable production profile. At the same time, ongoing exploration continues to demonstrate continuity of high-grade structures, supporting our confidence in the potential to discover and convert additional high-grade resources, extend mine life and enhance the reserve plan over time. Just as importantly, we are beginning to unlock a broader regional opportunity, including at Mishi, where open pit inferred material increased fourfold and remain at an early stage of delineation. We believe this represents the next phase of long-term growth for Eagle River and provides a pathway to materially increasing the scale of the operation over time.
"At Kiena, we have established a high-grade reserve base averaging 8.7 grams per tonne and a mine plan that provides a strong, executable platform for growth. While the current plan delivers attractive economics and operational flexibility, management believes it represents only a portion of the asset's potential. Opportunities exist to improve productivity within Kiena Deep while systematically advancing additional mineralized zones closer to surface. Our exploration programs continue to demonstrate the scale and continuity of mineralization both at depth and across the broader property, reinforcing our confidence that Kiena can continue to grow production, extend mine life and create substantial value over the long term.
"A significant portion of the opportunity remains outside mineral reserves today. Through resource conversion, operational optimization, productivity initiatives and continued exploration success across both districts, we see multiple pathways to unlock additional value. Each of these opportunities leverages infrastructure that is already in place, allowing us to pursue growth in a disciplined and capital-efficient manner.
"We are building Wesdome into a high-margin Canadian gold producer with long-life assets, increasing production, expanding free cash flow1 and a deep pipeline of organic growth opportunities. The Board's decision to initiate a quarterly dividend reflects our confidence in the durability of that cash flow by both investing in growth and returning capital to shareholders."
CONSOLIDATED THREE-YEAR OUTLOOK
| 2026 | 2027 | 2028 | |
| Gold Production (ounces) | |||
| Eagle River | 105,000 - 115,000 | 100,000 - 120,000 | 100,000 - 120,000 |
| Kiena | 75,000 - 90,000 | 85,000 - 100,000 | 85,000 - 110,000 |
| Total Gold Production | 180,000 - 205,000 | 185,000 - 220,000 | 185,000 - 230,000 |
| All-in Sustaining Costs1 (US$/oz) | 1,525 - 1,700 | 1,600 - 1,750 | |
- Gold Production: Consolidated gold production is expected to increase from 180,000 to 205,000 ounces in 2026 to 185,000 to 230,000 ounces in 2028, reflecting stable production at Eagle River and growing contribution from Kiena.
At Eagle River, production is expected to be 100,000 to 120,000 ounces per year in 2027 and 2028, supported by increased mill utilization and a more consistent grade profile, with additional potential upside from material not included in the reserve-based mine plan.
At Kiena, production is expected to increase to 85,000 to 110,000 ounces by 2028, supported by improved execution at Kiena Deep, greater flexibility across multiple mining levels including the Presqu'île Zone, which is expected to achieve commercial production in fall 2026.
Margin Resilience: Consolidated all-in sustaining costs1 per ounce of gold sold is expected to be US$1,600 - US$1,750 per ounce in 2027 and 2028, largely in line with 2026 guidance of US$1,525 - US$1,700 per ounce, inclusive of expected corporate G&A, capitalized sustaining exploration, study costs, and other corporate-level adjustments not included in the reserve-based site-level cost profiles presented in the Technical Reports.
Capital Profile: As outlined in the Company's 2026 guidance, total capital costs are projected to be $205 million, comprising $45 million in growth capital at Eagle River and $50 million at Kiena. Looking ahead to 2027 and 2028, growth capital at Eagle River is expected to taper, while at Kiena, capital is expected to moderate from the elevated levels associated with Presqu'île, with future growth capital primarily directed toward advancing Dubuisson into production. Total exploration expenditures are expected to remain consistent with 2026 guidance of $55 million, inclusive of capitalized sustaining exploration and expensed exploration.
TECHNICAL REPORT HIGHLIGHTS
For additional information on annual production, unit cost, and capital cost estimates, please see the Technical Reports, which will be filed within 45 days of this press release and available on SEDAR+ at www.sedarplus.ca and on the Company's website at www.wesdome.com.
| Units | Eagle River | Kiena | |
| Production | |||
| Mineral reserve mine life | years | 8 | 8 |
| Ore processed | kt | 2,895 | 2,554 |
| Grade processed | g/t | 7.3 | 8.7 |
| Average recovery | % | 95.7 | 98.4 |
| Gold production | koz | 647 | 700 |
| Operating and Capital Costs | |||
| Mining cost | $/t processed | $216 | $248 |
| Processing cost | $/t processed | $87 | $51 |
| Site administration cost | $/t processed | $112 | $91 |
| Capital Investments | |||
| Sustaining capital (excluding closure) | $M | $242 | $247 |
| Growth capital | $M | $150 | $106 |
| Total Capital Investment | $M | $392 | $353 |
Please refer to the Appendix for detailed annual plan summaries.
EAGLE RIVER
Proven and probable mineral reserves at Eagle River increased 39% to 2.9 million tonnes at 7.3 grams per tonne ("g/t") for 676,000 ounces, adding approximately 1.7 million tonnes of reserve material and extending the reserve-based mine plan to 2033.
The updated Eagle River mine plan supports a stable production profile of approximately 100,000 ounces per year through 2028, based on a planned ramp-up to just over 1,000 tonnes per day, equivalent to approximately 80% utilization of the permitted 1,200 tonnes per day mill capacity.
The initial phase of the global model initiative materially expanded Eagle River's mineral reserve base by adding incremental tonnes near existing development at a gold price of US$1,800 per ounce. While these additions reduced the overall average reserve grade relative to year-end 2024, the added tonnes are expected to improve mill utilization, extend mine life and support strong margins through lower incremental costs and fixed-cost leverage, with flexibility to re-sequence as higher-grade zones are further delineated.
In order to support higher throughput levels, planned development rates are expected to increase materially over the life-of-mine plan, supporting a higher number of active mining fronts, improved face availability and greater flexibility in mine sequencing.
The updated mine plan is expected to facilitate continued productivity and cost improvements, including through material handling improvements, larger trucks, contractor-to-owner conversion, mechanization and processing improvements to support reliable operation at higher throughput rates.
Additional upside not included in mineral reserves includes ongoing productivity and execution improvements, remnant and opportunistic non-reserve material, continued mineral resource conversion, and testing of identified exploration targets across near-mine extensions, including high-grade corridors, Mishi-Magnacon, Cameron Lake, Abbey Lake and other prospective targets. See Exploration Targets.
KIENA
Proven and probable mineral reserves at Kiena totaled 2.6 million tonnes at 8.7 g/t for 711,000 ounces gold at year-end 2025, consistent with mineral reserves at year-end 2024, with increased tonnes at Dubuisson offsetting depletion.
The updated Kiena mine plan provides a more reliable and executable reserve-based foundation through a fully integrated mine plan incorporating updated geology, mine design, geotechnical inputs, operating assumptions and cost estimates.
The feasibility level technical report reflects a higher-confidence mining method and design basis relative to the previous 2021 pre-feasibility study, including detailed geotechnical analysis, redefined design parameters across all zones, crown pillar assessment and hydrogeological review.
Kiena's cost structure has been rebased to reflect current operating conditions, engineering design and productivity assumptions, replacing legacy benchmark assumptions with a bottom-up cost build across mining, processing and site G&A.
The inclusion of Presqu'île and Dubuisson improves mine plan flexibility by expanding production beyond Kiena Deep into shallower mining areas, linking new zones to existing infrastructure and supporting a more diversified multi-zone operating approach.
Dubuisson has been advanced as a new shallow mining area, with probable mineral reserves increasing to 285,000 tonnes at 6.37 g/t for 58,000 ounces gold at year-end 2025 at a cut-off grade of 4.6 g/t. Additional mineralization at lower cut-off grades highlights the potential to evaluate alternative mining scenarios, including lower-cost bulk mining methods and processing through the existing Kiena mill or other regional milling options.
The updated reserve-based plan supports a stable production profile to 2033, while preserving meaningful upside through improved operating execution, continued resource conversion and additional near-mine and depth extension targets.
As identified in the opportunities section of the Technical Report, Kiena may have the potential to support higher production levels than those contemplated in the reserve-based mine plan. With available mill and hoisting capacity, existing underground infrastructure, the addition of a new portal, and opportunities to increase mining fronts, equipment utilization, and overall productivity, management believes gold production could be increased by 10 to 15% over time. These opportunities were not evaluated as part of the Technical Report and are not incorporated into the mineral reserve estimate, reserve-based mine plan, or economic analysis presented in the Technical Report.
Kiena has a three-to-five-year exploration target, which is not included in mineral reserves. Kiena Deep, Presqu'île, Dubuisson, the VC Zone, and the B Zone remain open along strike and down-plunge, with further drilling required to determine the extent of mineralization. Dubuisson East and broader regional opportunities represent potential additional upside. See section titled Exploration Targets.
MINERAL RESERVE ESTIMATE (AS AT DECEMBER 31, 2025)
| Mineral Reserve Summary | As at December 31, 2025 | As at December 31, 2024 | ||||
| Tonnes (000s) | Grade (g/t Au) | Ounces (000s) | Tonnes (000s) | Grade (g/t Au) | Ounces (000s) | |
| Eagle River | ||||||
| Proven | 296 | 12.9 | 123 | 433 | 15.6 | 217 |
| Probable | 2,596 | 6.6 | 553 | 794 | 10.4 | 265 |
| Stockpile and inventory (proven) | 3 | 5.3 | 1 | 8 | 17.8 | 5 |
| Proven & Probable Reserves | 2,895 | 7.3 | 676 | 1,235 | 12.3 | 487 |
| Kiena | ||||||
| Proven | 463 | 9.6 | 143 | 305 | 11.0 | 107 |
| Probable | 2,090 | 8.5 | 568 | 2,076 | 8.9 | 592 |
| Stockpile and inventory (proven) | - | - | - | 10 | 5.6 | 2 |
| Proven & Probable Reserves | 2,553 | 8.7 | 711 | 2,391 | 9.1 | 701 |
| Wesdome | ||||||
| Proven | 760 | 10.9 | 266 | 738 | 13.7 | 324 |
| Probable | 4,686 | 7.4 | 1,121 | 2,870 | 9.3 | 857 |
| Stockpile and inventory (proven) | 3 | 5.3 | 1 | 18 | 10.9 | 6 |
| Proven & Probable Reserves | 5,448 | 7.9 | 1,387 | 3,626 | 10.2 | 1,188 |
Notes to Mineral Reserve Statement
Eagle River
Mineral reserves are in addition to the mineral resources in the Eagle River Mine, with an effective date of December 31, 2025.
Mineral reserves were developed in accordance with the "CIM Definition Standards for Mineral Resources & Mineral Reserves" (May 10, 2014) and the "CIM Estimation of Mineral Resources & Mineral Reserves Best Practice Guidelines" (November 29, 2019), using geostatistical and/or classical methods, plus economic and mining parameters appropriate to the deposit. Mineral reserves are based on estimates of long-term gold prices of US$1,800/oz, and a US dollar exchange rate of US$1.00 = $1.35.
Mining cut-off for reserves has been derived from current operating cost performance, incorporating historical mine operating data and expected changes in production rates and cost assumptions consistent with the Life-of-Mine plan.
Underground Eagle River mineral reserves are reported at a mill head cut-off grade of 6.2 g/t Au, with an incremental cut-off grade of 3.0 g/t Au. Cut-off grades are based on a gold price of US$1,800/oz, a process recovery of 97.7%, and operating cost assumptions of $162.82/t mined, $75.12/t processed, and $112.42/t for general and administrative costs. Costs to sustain the operation of $113.50/t have been included in the cut-off grade determination.
Mineral reserves are the economic portion of the measured and indicated mineral resources. Mineral reserve estimates include mining dilution and mining recovery. Mining dilution and recovery factors vary with specific reserve sources and are influenced by several factors including deposit type, deposit shape and mining methods.
The reference point of the mineral reserves in the Eagle River Mine mill head.
The qualified person for the Eagle River Mine mineral reserve estimate is Benny Zhang, PEng, SRK Consulting (Canada) Inc. employee.
Rounding may result in apparent summation differences between tonnes, grade and contained metal.
Kiena
The Qualified Person responsible for the mineral reserve estimate is Eric Lecomte, P.Eng. of Norda Stelo Inc. The effective date of the mineral reserve estimate is December 31, 2025. Mineral reserves have been estimated in accordance with the "CIM Definition Standards for Mineral Resources and Mineral Reserves" adopted by the CIM Council and incorporated by reference into NI 43-101.
Mineral reserves are estimated from measured and indicated mineral resources that have demonstrated economic viability.
Mineral reserves were estimated using a gold price of US$1,800/oz, an exchange rate of US$1.00 = $1.35, and refining costs of US$5.65/oz. The reserve estimate incorporates modifying factors including mine design, mine planning, mine scheduling, operating costs, metallurgical recovery, mining recovery, planned dilution, backfill dilution, geotechnical constraints, and economic considerations.
Mineral reserves were estimated assuming longitudinal longhole stoping with paste backfill in the Kiena Deep, Presqu'île, and Dubuisson zones. Mineral reserves include planned internal and external dilution as well as mining recovery factors consistent with the selected mining method. Mining recovery factors applied to production stopes range from 87% to 92% depending on mining zone, lithology and stope geometry. Sill pillar stopes were assigned a recovery factor of 80%.
Mineral reserves are reported within mineable stope shapes generated using zone-specific base cut-off grades ("BCOG") and marginal cut-off grades ("MCOG") were applied to portions of stopes located within otherwise economic mining shapes where no additional development or mining access was required. The applied cut-off grades were 4.25 g/t Au (BCOG) and 3.95 g/t Au (MCOG) for the Presqu'île Zone, 4.85 g/t Au (BCOG) and 4.55 g/t Au (MCOG) for the Kiena Deep Zone, and 4.55 g/t Au (BCOG) and 4.15 g/t Au (MCOG) for the Dubuisson Zone.
The mining costs used for cut-off grade determination were estimated at $240.98/t milled for the Kiena Deep Zone, $188.72/t milled for the Presqu'île Zone, and $210.50/t milled for the Dubuisson Zone. Processing and General and Administrative costs were estimated at $50.20/t milled and $80.00/t milled, respectively, for all zones. Metallurgical recoveries applied in the cut-off grade calculations were derived from the process plant recovery assumptions and were estimated at 98.5% for Kiena Deep and 97.0% for the Presqu'île and Dubuisson zones.
Contained gold ounces are calculated from diluted tonnes and diluted grades and do not account for metallurgical recovery losses. Mineral reserves are reported as mill feed delivered to the processing plant. Tonnage, grade and contained metal have been rounded to reflect the accuracy of the estimate and totals may not sum due to rounding.
MINERAL RESOURCE ESTIMATE (AS AT DECEMBER 31, 2025)
| Mineral Resource Summary | As at December 31, 2025 | As at December 31, 2024 | ||||
| Tonnes (000s) | Grade (g/t Au) | Ounces (000s) | Tonnes (000s) | Grade (g/t Au) | Ounces (000s) | |
| Eagle River | ||||||
| Measured | 59 | 9.1 | 17 | 250 | 11.6 | 93 |
| Indicated | 796 | 6.3 | 162 | 557 | 7.5 | 135 |
| M+I Resources | 855 | 6.5 | 179 | 806 | 8.8 | 228 |
| Inferred Underground - Eagle River Mine | 512 | 7.3 | 120 | 431 | 7.9 | 109 |
| Inferred Open Pit - Mishi | 11,487 | 1.4 | 523 | 2,318 | 1.6 | 120 |
| Inferred Underground - Mishi | 152 | 6.5 | 32 | - | - | - |
| Inferred Total | 12,151 | 1.7 | 674 | 2,749 | 2.6 | 229 |
| Kiena | ||||||
| Measured | 85 | 8.4 | 23 | 58 | 10.2 | 19 |
| Indicated | 893 | 5.7 | 163 | 789 | 5.4 | 138 |
| M+I Resources | 977 | 5.9 | 186 | 847 | 5.8 | 158 |
| Inferred | 2,977 | 5.5 | 525 | 2,536 | 5.0 | 411 |
| Wesdome | ||||||
| Measured | 143 | 8.7 | 40 | 308 | 11.3 | 112 |
| Indicated | 1,689 | 6.0 | 325 | 1,346 | 6.3 | 271 |
| M+I Resources | 1,833 | 6.2 | 365 | 1,653 | 7.3 | 386 |
| Inferred Underground - Eagle River Mine & Kiena | 3,489 | 5.7 | 645 | 2,967 | 5.5 | 520 |
| Inferred Open Pit - Mishi | 11,487 | 1.4 | 523 | 2,318 | 1.6 | 120 |
| Inferred Underground - Mishi | 152 | 6.5 | 32 | - | - | - |
| Inferred Total | 15,128 | 2.5 | 1,199 | 5,285 | 3.8 | 640 |
Notes to Mineral Resource Statement
Mineral resources are not mineral reserves and do not have demonstrated economic viability.
Mineral resources are reported exclusive of mineral reserves.
Mineral resource estimates have been prepared in accordance with the CIM Definition Standards (2014) and CIM Estimation of Mineral Resources and Mineral Reserves Best Practice Guidelines (2019).
Mineral resource estimates are based on a long-term gold price of US$2,100/oz.
Totals may not add due to rounding.
Eagle River
Eagle River underground mineral resources are reported within fully diluted mineable stope shapes using an Au cut-off grade of 4.0 g/t.
Mishi open pit mineral resources are reported within a conceptual pit shell using an Au cut-off grade of 0.55 g/t Au.
Mishi underground mineral resources are reported within fully diluted mineable stope shapes using an Au cut-off grade of 4.36 g/t Au.
Assumed metallurgical recoveries are 97.68% for Eagle River and 82% for Mishi.
Kiena
Mineral resources are estimated using cut-off grades of 3.15 g/t Au for Kiena Deep, S50, and B Zone; 2.97 g/t Au for VC Zone and K109; 2.42 g/t Au for Martin, Wish, and Shawkey 22; 3.20 g/t Au for North West, Zone 134, Wesdome, and South Zone; 2.70 g/t Au for Dubuisson; and 2.60 g/t Au for Presqu'île.
Underground Mineral resources are reported within underground constraining shapes. Reported tonnages and grades reflect only mineralized material contained within the constraining shapes; internal waste and unmineralized material are excluded from the reported Mineral resources.
Minimum mining widths range from 1.5 m to 3.0 m depending on the deposit.
A bulk density of 2.80 t/m³ was applied.
Ounces contain prior to recovery from the mill.
EXPLORATION TARGETS
In addition to the updated mineral resources and mineral reserves, Wesdome has identified a series of exploration targets with potential gold mineralization of between 2.4 - 6.3 million ounces, comprising 27.1 to 40.0 Mt with weighted-average grades ranging from 2.7 to 4.9 g/t Au, across its Eagle River and Kiena properties. These exploration targets represent areas considered prospective for the discovery or expansion of gold mineralization based on geological interpretation, drilling results, historical mining activity, geophysical data, and other exploration information.
The potential quantity and grade of the exploration targets are conceptual in nature. There has been insufficient exploration to estimate and define a mineral resource, as defined by NI 43-101, and it is uncertain if further exploration will result in the target being delineated as a mineral resource.
An exploration target is used to provide a conceptual estimate of the potential quantity and grade of a mineral deposit, based on known and limited geological evidence. It is an early-stage assessment that will help to guide further exploration, but it is not a mineral resource or mineral reserve and should not be treated as such.
The exploration targets are based on the Company's interpretation of multiple datasets across 227 identified targets. These datasets include but are not limited to core logs from diamond drilling, drillhole assay results, rock chip samples, surface and subsurface geological mapping, induced polarization geophysical studies, airborne magnetic studies, detailed LiDAR surface topography, and geochemical surveys (soil, bark, rock chip and trench channel samples).
The following table summarizes selected exploration targets identified across the Eagle River and Kiena properties. These targets have been categorized and ranked based on geological confidence and exploration maturity to support the prioritization of future exploration programs and the evaluation of opportunities for mineral resource growth.
| Tonnage | Grade | Ounces | |
| (Mt) | (g/t Au) | (Moz) | |
| Eagle River | |||
| Near Mine Exploration Targets | 2.2-3.7 | 12.5-15.5 | 0.9-1.8 |
| Historical Mine and Advanced Exploration Targets | 4.8-7.0 | 2.2-4.2 | 0.3-0.9 |
| Greenfield Exploration Targets | 13.2-19.0 | 0.7-1.1 | 0.3-0.7 |
| TOTAL EAGLE RIVER | 20.2-29.6 | 2.4-3.6 | 1.5-3.4 |
| Kiena | |||
| Near Mine Exploration Targets | 2.4-3.8 | 4.5-10.8 | 0.3-1.3 |
| Historical Mine and Advanced Exploration Targets | 4.3-6.1 | 3.7-7.7 | 0.5-1.5 |
| Greenfield Exploration Targets | 0.4-0.5 | 2.0-5.4 | 0.0-0.1 |
| TOTAL KIENA | 7.0-10.4 | 3.8-8.7 | 0.9-2.9 |
| TOTAL WESDOME | 27.1-40.0 | 2.7-4.9 | 2.4-6.3 |
Notes:
The reported ranges represent the aggregation of multiple individual exploration targets that may be spatially separated and are not intended to represent a single continuous mineral deposit. Detailed tonnage, grade, and contained gold ranges for the individual exploration targets included in each category are provided in more detailed tables below.
- Grade ranges reported for the subtotal and total exploration targets lines were calculated as tonnage-weighted average grades using the corresponding minimum and maximum tonnage and grade estimates for the individual exploration targets included in each aggregation. Grade ranges for each individual exploration target are presented in the detailed tables below in accordance with NI 43-101 disclosure requirements.
Exploration Target Categories
The Company has developed a three to five-year exploration strategy to systematically evaluate and prioritize its exploration targets. This strategy is dynamic and is updated every year based on exploration results and geological interpretation.
The exploration targets have been grouped into three categories:
Near Mine Exploration Targets: located within or adjacent to existing mining infrastructure and represent opportunities for mineral resource growth near current operations.
Historical Mine and Advanced Exploration Targets: comprise of historic mines and advanced-stage exploration areas where mineralization remains open beyond previously defined limits.
Greenfield Exploration Targets: associated with underexplored geological corridors and regional-scale exploration opportunities with potential for new discoveries.
In addition to these categories, the Company ranks exploration opportunities using a six-tier framework that reflects the level of geological confidence and available supporting information. For block models, tiers 1 to 3 correspond to measured and indicated, and inferred mineral resources. Exploration targets are classified as Tiers 4 to 6. Tier 4 targets represent mineralized areas within interpreted mineralized domains that are not currently classified as Mineral resources due to insufficient drill spacing or geological confidence. Tier 5 targets comprise interpreted extensions of known mineralized domains supported by limited drilling and/or geological continuity beyond currently defined mineralization. Tier 6 targets represent conceptual exploration opportunities based primarily on geological interpretation, structural continuity, geophysical data, geochemical data, and regional targeting criteria, with limited or no direct drilling support. As the tier number increases, the uncertainty associated with the conceptual tonnage and grade ranges increases and therefore the level of geological confidence generally decreases.
The targets do not encompass all prospective areas identified across the Company's operating mines, as several mineralized systems remain open along strike and at depth beyond the limits of current drilling. In certain areas, the evaluation of exploration potential is further constrained by limitations on drill access from existing underground infrastructure, resulting in portions of prospective mineralized corridors remaining only partially tested.
The reported exploration targets, including the potential tonnage, quantity and grade ranges, are conceptual in nature. There has been insufficient exploration to estimate a mineral resource for these target areas, and it is uncertain whether further exploration will result in the estimation or delineation of a mineral resource. The exploration targets are based on the available geological information, limited drilling and sampling data, and reasonable geological interpretations, and are presented solely to illustrate the potential scale of exploration opportunities identified within the Company's land package. Exploration targets are not mineral resources or mineral reserves and should not be interpreted as such.
Additional information regarding the methodology, assumptions, target categorization, and supporting geological rationale used in the estimation of the exploration targets will be provided in the Company's upcoming NI 43-101 Technical Report.
Eagle River
The Eagle River property hosts multiple exploration opportunities, including mine-proximal extensions of known mineralized systems, historical mining areas with open mineralization beyond previous development, and regional targets along prospective structural corridors across the broader land package. (Figure 1).
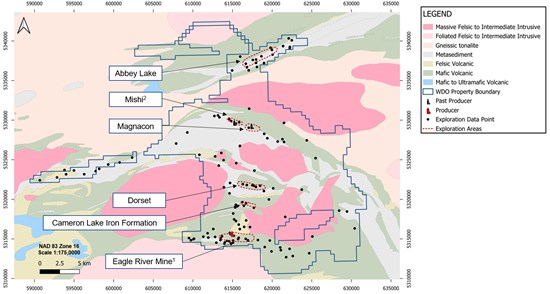
Figure 1: Eagle River Exploration Targets
To view an enhanced version of this graphic, please visit:
https://images.newsfilecorp.com/files/2397/302774_40f46fa094d9a83e_001full.jpg
Notes to Figure 1:
Eagle River Mine refers to the location of the mine, as well as the In-Shell Potential, Near-Shell Extensions, Near-Shell High-Grade Extensions, and High-Grade Corridor exploration targets.
Mishi refers to the location of the historical Mishi mine, as well as the Mishi deep targets and Mishi near surface exploration targets.
The exploration targets presented herein were derived from an evaluation of 164 individual exploration opportunities identified across the Eagle River property. Thirty of these opportunities were grouped and aggregated to define the reported exploration targets.
Collectively, these targets highlight the significant exploration potential that exists across the Eagle River property and support the Company's strategy of combining near-mine growth with district-scale discovery opportunities. The exploration target ranges are summarized in Table 1.
The potential quantity and grade of the exploration targets are conceptual in nature. There has been insufficient exploration to estimate and define a mineral resource, as defined by NI 43-101, and it is uncertain if further exploration will result in the target being delineated as a mineral resource.
An exploration target is used to provide a conceptual estimate of the potential quantity and grade of a mineral deposit, based on known and additional limited geological evidence. It is an early-stage assessment that will help to guide further exploration, but it is not a mineral resource or mineral reserve and should not be treated as such.
The exploration target is based on the Company's interpretation of multiple datasets across 164 identified targets. These datasets include but are not limited to core logs from diamond drilling, drillhole assay results, rock chip samples, surface and sub-surface geological mapping, induced polarization geophysical studies, airborne magnetic studies, detailed LiDAR surface topography, and geochemical surveys (soil, bark, rock chip and trench channel samples).
Table 1: Exploration Target Ranges for Eagle River
| Category | Exploration Target | OP/UG | Tier | Tonnage | Grade | Ounces |
| (kt) | (g/t Au) | (koz) | ||||
| Near Mine Exploration Targets | In-Shell Potential | UG | 4 | 350-550 | 5.0-9.0 | 60-160 |
| Near-Shell Extensions | UG | 5 | 1,000-1,900 | 8.0-11.0 | 260-660 | |
| Near-Shell High-Grade Extensions | UG | 5 | 120,180 | 16.0-21.0 | 60-120 | |
| High-Grade Corridor Targets | UG | 6 | 700-1,050 | 22.0-26.0 | 490-880 | |
| Subtotal | 2,170-3,680 | 12.5-15.5 | 870-1,820 | |||
| Historical Mine and Advanced Exploration Targets | Magnacon | UG | 4 | 1,500-2,100 | 3.0-7.0 | 140-470 |
| Mishi Deep Targets (T4) | UG | 4 | 350-600 | 3.5-4.5 | 40-90 | |
| Mishi Deep Targets (T6) | UG | 6 | 180-260 | 4.5-6.5 | 30-50 | |
| Mishi Near Surface | OP | 5 | 2,800-4,000 | 1.5-2.5 | 140-330 | |
| Subtotal | 4,830-6,970 | 2.2-4.2 | 350-940 | |||
| Greenfield Exploration Targets | Cameron Lake Iron Formation | OP | 4 | 9,100-13,000 | 0.6-0.9 | 180-370 |
| Dorset | OP | 4 | 3,200-4,650 | 0.9-1.4 | 90-210 | |
| Abbey Lake | OP | 5 | 950-1,350 | 1.5-2.5 | 50-110 | |
| Subtotal | 13,250-19,000 | 0.7-1.1 | 320-690 | |||
| Total Eagle River Mine | 20,150-29,640 | 2.4-3.6 | 1,540-3,450 |
Notes to Table 1:
The exploration targets presented herein represent conceptual estimates for multiple independent target areas across the Eagle River property. There has been insufficient exploration to estimate and define a mineral resource, as defined by NI 43-101, and it is uncertain if further exploration will result in the target being delineated as a mineral resource. The ranges have been aggregated for presentation purposes only and should not be interpreted as representing a single mineralized system, deposit, or potential for defining a mineral resource.
Tonnage, grade, and contained gold ranges have been rounded for presentation purposes. Minor differences may occur due to rounding and, therefore, the reported contained gold values may not reconcile with the reported tonnage and grade ranges.
Grade ranges reported for the subtotal and total exploration target lines were calculated as tonnage-weighted average grades using the corresponding minimum and maximum tonnage and grade estimates for the individual exploration targets included in each aggregation.
Near Mine Exploration Targets
The near-mine exploration targets are located within or adjacent to the existing Eagle River infrastructure and are associated with extensions of known mineralized systems. These targets are supported by drilling results, geological interpretation, and the demonstrated continuity of gold mineralization beyond currently defined mineral resources. Due to their proximity to existing underground development and processing infrastructure, these targets represent opportunities for future mineral resource growth through additional drilling, improved confidence in geological and grade continuity, and other technical data. They provide the shortest potential pathway for the conversion of exploration success into readily accessible mineral resources.
In-Shell Potential Target
The in-shell potential exploration target comprises mineralized material located within existing interpreted mineralized domains in proximity to the Eagle River infrastructure. Gold mineralization is associated with structurally controlled quartz-carbonate vein systems hosted within the Eagle River greenstone belt. Although these areas are supported by geological interpretation and drilling information, drill hole spacing is currently insufficient to support classification as a mineral resource. Due to their location within known mineralized systems and proximity to existing underground infrastructure, these targets may represent opportunities for near-mine mineral resource growth through additional drilling and improved geological confidence.
Near-Shell Extensions and Near-Shell High-Grade Extensions Targets
Targets comprise extensions to known mineralized systems located beyond the limits of the currently interpreted mineralized domains. The Near-shell extension targets represent broader mineralized corridors, while the near-shell high-grade extension targets represent discrete high-grade shoots identified within these corridors. These targets are supported by geological interpretation, drilling results, and the demonstrated continuity of mineralization along strike and at depth. Mineralized systems remain open in one or more directions, and there is currently insufficient information to define their ultimate extent. Future exploration will focus on testing these extensions to evaluate the continuity, geometry, and scale of mineralization and their potential contribution to future mineral resources.
High-Grade Corridor Targets
High-grade corridor targets comprise discrete areas projected along interpreted high-grade trends beyond the limits of currently defined mineralized domains and near-shell extensions. These targets are based on geological interpretation, structural continuity, and the spatial distribution of high-grade drill intercepts, but remain untested by drilling. The corridor targets are supported by historic mining and drill data up-plunge, which were used to help define the target projection.
Historical Mine and Advanced Exploration Targets
This category comprise former producing deposits and advanced-stage mineralized systems where historical mining, drilling, and geological interpretation have demonstrated the presence of significant gold mineralization. Exploration activities and re-evaluations completed since mining ceased have confirmed the continuation of mineralization beyond historical workings and pit limits, while several areas remain incompletely tested along strike and at depth. These targets include opportunities for both underground and open-pit resource expansion and represent potential growth within established mining camps and known mineralized corridors.
Magnacon Exploration Target
The Magnacon exploration target is located within the Mishibishu Deformation Zone, immediately adjacent to the Eagle River mill. Historical mining and current and historical drilling have demonstrated the presence of a gold-bearing system extending beyond the limits of historical workings. Mineralization remains open at depth and along strike, and the target benefits from its proximity to existing processing infrastructure.
Mishi Near Surface and Deep Targets (Tiers 4 and 6)
The Mishi near surface and underground exploration targets are located within the Mishibishu Deformation Zone and comprise extensions to the broader Mishi mineralized system beyond the limits of the current open pit mineral resource and historical mining areas. Exploration drilling has demonstrated the continuity of gold mineralization both along strike and at depth, with mineralization extending well beyond the current pit limits and into areas that may support underground extraction. The targets represent opportunities for both open-pit and underground mineral resource growth through the continued evaluation of known mineralized corridors and their extensions.
Greenfield Exploration Targets
The greenfield exploration targets are located outside the currently defined mining areas and are associated with prospective regional-scale geological structures and favourable host lithologies. These targets are supported by geological mapping, drilling, geophysical anomalies, surface sampling, and regional exploration programs. While generally less advanced than the near-mine and historical mine targets, they provide significant potential for the discovery of new gold deposits and the expansion of mineralized trends across the Eagle River property.
Cameron Lake Iron Formation
The Cameron Lake Iron Formation exploration target is located in the south-central portion of the Eagle River land package. Exploration drilling completed to date has identified a gold-bearing system associated with an extensive banded iron formation that remains open in multiple directions. Numerous additional airborne magnetic geophysical targets remain untested, highlighting the broader exploration potential of the district-scale iron formation.
Dorset
The Dorset exploration target is associated with the Dorset Deformation Zone, a regional structural corridor extending across the central portion of the Eagle River land package. Drilling has outlined a significant gold-bearing system and mineralization remains open in multiple directions. In addition, numerous gold occurrences and anomalous surface samples have been identified elsewhere along the corridor, indicating broader district-scale exploration potential.
Abbey Lake
The Abbey Lake exploration target is situated along the Iron Lake-Pukaskwa Deformation Zone, a regional-scale structure extending across the northern portion of the Eagle River land package. Limited historical drilling and surface sampling have confirmed the presence of gold mineralization; however, the majority of the structural corridor remains largely untested. The target represents a significant opportunity for the discovery of additional gold mineralization along a prospective regional trend.
Kiena
The Kiena property hosts a diverse range of exploration opportunities across the Kiena Mine complex and the broader regional land package. These include mine-proximal extensions of known mineralized systems near existing underground infrastructure, historical mining areas where mineralization remains open beyond previous development, and regional targets associated with prospective structural corridors and favourable geological settings. (Figure 2).
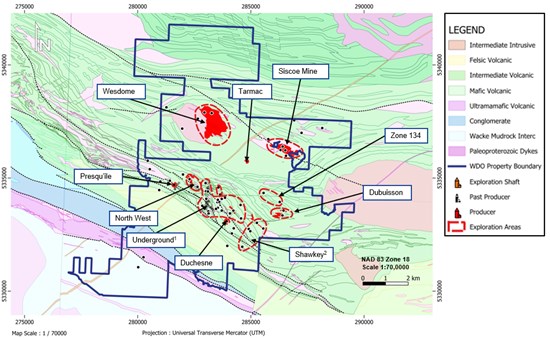
Figure 2: Kiena Exploration Targets
To view an enhanced version of this graphic, please visit:
https://images.newsfilecorp.com/files/2397/302774_40f46fa094d9a83e_002full.jpg
Notes to Figure 2:
Underground refers to the location of the main mining activities at the Kiena property, as well as the near mine, Norbenite Footwall, VC, and K109 exploration targets.
Shawkey refers to the location of the Shawkey 22 and Shawkey 10 exploration targets.
The exploration targets presented herein were derived from an evaluation of 63 individual exploration opportunities identified across the Kiena property. Twenty-five of these opportunities were grouped and aggregated to define the reported exploration targets.
Collectively, these targets demonstrate the significant potential for continued mineral resource growth and new discoveries across the Kiena property. The exploration target ranges are summarized in Table 2.
The potential quantity and grade of the exploration target are conceptual in nature. There has been insufficient exploration to estimate and define a mineral resource, as defined by NI 43-101, and it is uncertain if further exploration will result in the target being delineated as a mineral resource.
An exploration target is used to provide a conceptual estimate of the potential quantity and grade of a mineral deposit, based on known and additional limited geological evidence. It is an early-stage assessment that will help to guide further exploration, but it is not a mineral resource or mineral reserve and should not be treated as such.
The exploration target is based on the Company's interpretation of multiple datasets across 63 identified targets. These datasets include but are not limited to diamond drilling, drillhole assay results, rock chip samples, surface and sub-surface geological mapping, induced polarization geophysical studies, airborne magnetic geophysical surveys, detailed LiDAR surface topography, and geochemical surveys.
Table 2: Exploration Target Ranges for Kiena
| Category | Exploration Target | Tier | Tonnage | Grade | Ounces |
| (kt) | (g/t Au) | (koz) | |||
| Near Mine Exploration Targets | Norbenite Footwall | 5 | 560-800 | 7.0-12.0 | 130-310 |
| Kiena Deep | 5 | 100-300 | 6.7-24.0 | 20-230 | |
| Kiena Deep | 6 | 120-370 | 10.0-13.2 | 40-150 | |
| Northwest | 5 | 350-500 | 4.0-7.5 | 45-120 | |
| Dubuisson | 5 | 900-1,300 | 2.4-7.9 | 70-325 | |
| VC | 6 | 170-240 | 5.2-7.3 | 30-55 | |
| Presqu'ile | 5 | 140-200 | 2.1-14.0 | 10-90 | |
| K109 | 4 | 40-60 | 3.7-5.7 | 5-10 | |
| Subtotal | 2,380-3,770 | 4.5-10.8 | 350-1,290 | ||
| Historical Mine and Advanced Exploration Targets | Siscoe Mine | 4 | 960-1,400 | 8.3-11.7 | 250-520 |
| Wesdome | 4 | 2,500-3,600 | 2.0-6.6 | 160-760 | |
| Shawkey 22 | 5 | 580-830 | 3.0-5.0 | 55-135 | |
| Shawkey 10 | 4 | 260-310 | 4.0-9.5 | 35-115 | |
| Subtotal | 4,300-6,140 | 3.7-7.7 | 500-1,530 | ||
| Greenfield Exploration Targets | Duchesne | 5 | 220-310 | 2.0-5.0 | 15-50 |
| Tarmac | 5 | 150-210 | 2.0-6.0 | 10-40 | |
| Subtotal | 370-520 | 2.0-5.4 | 25-90 | ||
| Total Kiena | 7,050-10,430 | 3.8-8.7 | 895-2,910 |
Notes to Table 2:
The exploration targets presented herein represent conceptual estimates for multiple independent target areas across the Kiena property. There has been insufficient exploration to estimate and define a mineral resource, as defined by NI 43-101, and it is uncertain if further exploration will result in the target being delineated as a mineral resource. The ranges have been aggregated for presentation purposes only and should not be interpreted as representing a single mineralized system, deposit, or potential for defining a mineral resource.
Tonnage, grade, and contained gold ranges have been rounded for presentation purposes. Minor differences may occur due to rounding and, therefore, the reported contained gold values may not precisely reconcile with the reported tonnage and grade ranges.
- Grade ranges reported for the subtotal and total exploration targets lines were calculated as tonnage-weighted average grades using the corresponding minimum and maximum tonnage and grade estimates for the individual exploration targets included in each aggregation.
Near Mine Exploration Targets
The near-mine exploration targets at Kiena are located within or adjacent to the existing Kiena Mine infrastructure and are associated with known mineralized corridors and extensions of established gold-bearing structures. These targets are considered prospective due to their proximity to existing mineral resources, favourable geological setting, and supporting drill results.
Norbenite Footwall
The Norbenite Footwall exploration target is located immediately below the Kiena Deep deposit in the footwall behind A Zone and the Norbenite Fault, a major structural feature that separates the target area from the currently defined Kiena Deep mineralization. Gold mineralization is associated with quartz veins hosted predominantly within competent basaltic rocks and is characterized by the presence of pyrite and locally visible gold. The exploration potential is supported by the continuation of favourable host lithologies and mineralized structures on the other side of the Norbenite Fault, as well as historical drilling that intersected gold mineralization within the target area. From older and recent drilling, it shows a zone spreading over 150 metres vertically with potential of up-dip extension to a near 300 metres, just above existing footwall zones. There is also potential for extension at depth.
Kiena Deep (Tiers 5 and 6)
Down-plunge extension of the Kiena Mine mineralized system below the current mineral resource footprint. The target is supported by the continuation of the host stratigraphy, favorable structural controls, and the presence of high-grade gold mineralization at depth. Mineralization remains open down-plunge, and additional drilling is required to evaluate the continuity, extent, and economic significance of the system beyond the currently defined resources.
Northwest
The Northwest exploration target is located northwest of the Kiena Mine infrastructure and is associated with a mineralized zone striking approximately N330° and dipping moderately to steeply northeast, proximal to the Norbenite fault corridor. Historical drilling has identified gold mineralization hosted within structurally controlled quartz-vein systems and associated alteration zones. Existing geological modelling outlines a mineralized body with substantial strike and vertical continuity; however, mineralization remains open in several directions and warrants additional drilling to evaluate its full extent and potential.
Dubuisson
The Dubuisson exploration target is located approximately 3.5 kilometres east of the Kiena shaft and central mine infrastructure, within the Dubuisson Formation. Gold mineralization is hosted within brittle, fractured, albitized, carbonated, and chloritized diorite and feldspar porphyry dykes emplaced within a strongly deformed ultramafic sequence. Mineralization is closely associated with sub-horizontal extensional quartz-carbonate-albite-chlorite-tourmaline veining containing pyrite and native gold and commonly occurs adjacent to talc-chlorite shear zones. Multiple mineralized lenses have been identified within two main zones, the Dubuisson North Zone and Dubuisson South Zone, demonstrating significant vertical and lateral continuity. The exploration target encompasses extensions beyond the currently modelled mineralized lenses where geological continuity and limited drilling indicate potential for additional mineralization. The style of mineralisation suggests that it may also be amenable to a bulk tonnage style of extraction.
VC
The VC Zone target represents the potential extension of mineralization north of the S50 Zone within the Kiena Deep mining environment. The target is supported by historical drilling, existing Mineral resources, and the interpreted continuity of the mineralized system along the Norbenite structural corridor.
Presqu'île
The Presqu'île exploration target comprises extensions to the currently defined Presqu'île mineral resource. The target is based on the interpretation of favourable geological and structural controls that continue beyond the limits of the existing mineral resource and remain only partially tested by drilling. Historical drilling and geological modelling indicate that mineralization may be constrained to the waste near the contact between porphyritic basalt and komatiite; however, the system remains open to the west, with opportunities for additional resource growth through systematic step-out drilling. The exploration target represents areas where geological continuity is interpreted but where drill density is currently insufficient to support mineral resource classification.
K109
The sector K109 is composed of four lenses, mainly in basalt, with occasional contacts with komatiites and the presence of veining of quartz, chlorite, carbonate with presence pf pyrrhotite and stockwork of quartz, tourmaline, carbonate [containing] sulphides. The grade continuity is not always present, low deformation and the envelope generally around two metres with dilution.
The first official resource for the K109 area (inferred resource only) was prepared for year-end 2023. The exploration drift at the 109 level in Kiena mine, was developed with the initiative of crossing at proximity of the second lens. The target remains open for further investigation.
Historical Mine and Advanced Exploration Targets
The historical mine exploration targets comprise former producing areas and associated mineralized corridors where historical mining and drilling demonstrate the presence of significant gold mineralization. These areas remain incompletely tested and offer potential for the identification of additional mineralized zones beyond the limits of historical development.
Siscoe Mine
The Siscoe Mine exploration target is located within the K-Shear deformation corridor in the northeastern portion of the Kiena land package. The target encompasses extensions to the historical Siscoe Mine as well as underexplored portions of the K-Shear structure, which extends across a significant portion of the property. Historical mining, historical drilling, and recent geological interpretations indicate potential for the continuation of gold mineralization beyond the limits of historical workings and within unexplored segments of the deformation corridor. Additional drilling and geological evaluation are required to assess the extent and continuity of mineralization.
Wesdome
The Wesdome exploration target encompasses the historical Wesdome deposit area, located along the northwest extension of the K-shear that hosts the K Zone at the historic Siscoe Mine. The area is underlain predominantly by mafic volcanic rocks of the Dubuisson Formation, intrusive rocks of the Snowshoe Batholith, and numerous dyke swarms. Gold mineralization is associated with several structurally controlled zones, including the Wesdome A, B, C, and D zones. The main mineralized zone is Wesdome A, characterized by quartz-carbonate veining associated with pyrite, which has been defined over a strike length of approximately 1 kilometre and to a vertical depth of 500m. The zone is oriented N300° and dips 45-50° to the southwest. The Wesdome B Zone comprises a strong subvertical shear zone containing quartz-tourmaline-pyrite veins, while the C and D zones consist of weaker shear structures hosting quartz-carbonate vein mineralization accompanied by pyrite and minor sulphides. Historical exploration and underground development demonstrate the presence of a significant mineralized system; however, several structural interpretations remain untested and additional drilling is required to evaluate extensions and potential connections with the broader Siscoe mineralized corridor.
Shawkey 22 and 10
The Shawkey exploration target is located in the southeastern portion of the Kiena land package within the southern structural corridor. Gold mineralization is associated with structurally controlled quartz-carbonate veining and alteration developed within a regional deformation zone that extends across the property, whilst Shawkey 10 also includes diorite hosted mineralization associated with quartz tourmaline veining, similar to the Dubuisson deposit.
The target area includes the Shawkey 22 Zone, where historical and recent drilling has outlined a mineralized system over a broad strike extent and to several hundred metres below surface. The exploration potential is supported by drilling results demonstrating the continuity of gold mineralization along strike and at depth, together with its location within a prospective regional corridor situated between the Kiena Mine and other significant gold deposits in the Val-d'Or mining district.
The style of mineralization at Shawkey suggests that, subject to further drilling and technical evaluation, it may also support bulk tonnage mining methods, similar to Dubuisson. Additional drilling is required to further evaluate the continuity, extent, and grade distribution of the mineralized system.
Greenfield Exploration Targets
The greenfield exploration targets are located outside the currently defined mining areas and are supported by favourable geological settings, structural interpretation, historical drilling, and exploration results. These targets represent opportunities for the discovery of new mineralized systems and the expansion of known mineralized trends across the property.
Duchesne
The Duchesne exploration target is located in the southeastern portion of the Kiena regional land package within the southern deformation corridor. Gold mineralization is interpreted to be structurally controlled and associated with deformation-related quartz-carbonate veining developed within favourable host rocks.
The exploration potential is supported by historical drilling and geological interpretation indicating the presence of a mineralized system extending over a meaningful strike length and depth extent. Recent exploration activities have contributed to an improved understanding of the geometry and controls on mineralization, supporting the potential for additional discoveries within the target area.
Further drilling and geological evaluation are required to better define the continuity and extent of mineralization.
Tarmac
The Tarmac exploration target is located within the northern deformation corridor of the Kiena regional land package and is spatially associated with the contact of a recently interpreted intrusive unit. Historical drilling has intersected high-grade gold mineralization; however, exploration activity has been limited over the past several decades. The target remains open in multiple directions and represents an opportunity to evaluate the continuity and extent of mineralization through additional drilling and geological interpretation.
CONFERENCE CALL AND WEBCAST
Management will host a conference call and webcast tomorrow Thursday, June 25, 2026 at 8:30 a.m. ET. A question-and-answer session will follow management's prepared remarks. Details of the webcast are as follows:
| Date and time: | Thursday, June 25, 2026 at 8:30 a.m. ET |
| Dial-in numbers: | To access the call by telephone, dial 1.646.968.2525 or 1.888.596.4144 (toll-free). The event passcode is: 8215935. Please allow up to 10 minutes to be connected. |
| Webcast link: | https://events.q4inc.com/attendee/540996049 Pre-registration is required for this event. It is recommended you join 10 minutes prior to the start of the event. The webcast can also be accessed from the home page of the Company's website at www.wesdome.com. |
TECHNICAL DETAILS
The Company will file technical reports prepared in accordance with NI 43-101, which can be found on SEDAR+ at www.sedarplus.ca and at www.wesdome.com within 45 days of the date of this news release. For readers to fully understand the information in this news release, reference should be made to the full text of the technical reports, once filed, including all assumptions, qualifications and limitations therein. Additional information regarding data verification, exploration information, known legal, social, environmental or other risks that could affect Wesdome's operations or its mineral resources or reserves, can be found in the technical reports. The technical reports are intended to be read as a whole, and sections should not be read or relied upon out of context.
QUALIFIED PERSONS
The scientific and technical information in this news release was provided, reviewed and approved by the following individuals, all of whom are independent "Qualified Persons" for the purposes of NI 43-101, as set out in the tables below. The Qualified Persons have, collectively, verified the data disclosed and data underlying the information or opinions contained in the news release, without restrictions or limitations. Data verification was completed through a combination of site visits and review against original drill materials. Such Qualified Persons are satisfied as to the appropriateness and quality of the technical work completed and accept responsibility for the disclosure, in accordance with Canadian regulatory requirements set out in NI 43-101.
Eagle River Preliminary Feasibility Study
| Qualified Person | Company | Subject / Field |
| Souvik Banerjee | SRK Consulting (Canada) Inc. | Data verification and mineral resources estimates |
| Benny Zhang | SRK Consulting (Canada) Inc. | Mineral reserves and mining methods |
| Benjamin Ollila | SRK Consulting (Canada) Inc. | Geomechanics |
| Anthony Fedec | SRK Consulting (Canada) Inc. | Underground dewatering |
| Denis Vachon | SRK Consulting (Canada) Inc. | Hydrogeology |
| Gary M. Poxleitner | SRK Consulting (Canada) Inc. | Mining capital and operating costs |
| John Bowling | SRK Consulting (U.S.) Inc. | Ventilation |
| Chris Dougherty | Nordmin Engineering Ltd. | Mine shaft |
| Harold Harkonen | Nordmin Engineering Ltd. | Underground electrical supply |
| David Frost | DRA Americas Inc. | Mineral processing, metallurgical testwork and recovery methods |
| Marcello Locatelli | Captrics Consulting Inc. | Surface infrastructure |
| Prabhat Habbu | WSP Canada Inc. | Tailings management |
| Andrew Lampman | Blue Heron Solutions for Environmental Management Inc. | Environment, social, permitting and closure |
| Andrew Sinclair | Stantec Consulting Ltd. | Water management |
Kiena Feasibility Study
| Qualified Person | Company | Subject / Field |
| Eric Lecomte | Norda Stelo | Mineral reserve estimates, mining methods, capital and operating costs consolidation, economic analysis |
| David Sims | Norda Stelo | Hydrogeology |
| Denys Vermette | Norda Stelo | Environment |
| Éric Tremblay | Norda Stelo | Power supply and underground electric grid |
| Simon Veilleux | Norda Stelo | Surface infrastructure |
| Ali Jalbout | Asa Geotech | Geotechnical |
| Francis Couture | 1823 | Water management |
| Ganan Nadarajah | WSP | Tailings management facilities |
| Jean-François St-Laurent | SRK Consulting | Waste stockpile |
| Jean-Louis Roberge | SLR Consulting | Backfill |
| Pierre Roy | Soutex | Mineral processing, metallurgical testing and recovery methods |
Additional scientific and technical information contained in this news release that was not prepared by the independent Qualified Persons identified above was provided, reviewed, and approved by Renan Lopes, P.Geo., Director, Mineral Resources, Near Mine Geology and Underground Exploration, and Serge Gonthier, P.Geo. (OGQ #578), Principal Geologist, Resources and Geology, both of Wesdome and each a Qualified Persons as defined by NI 43-101.
ABOUT WESDOME
Wesdome is a Canadian-focused gold producer with two high-grade underground assets - Eagle River in Ontario and Kiena in Quebec. The Company's primary goal is to responsibly leverage its operating platform and high-quality brownfield and greenfield exploration pipeline to build a growing value-driven Canadian gold producer.
FOR FURTHER INFORMATION
| Raj Gill SVP, Corporate Development and Investor Relations Phone: +1.416.360.3743 E-Mail: invest@wesdome.com | Trish Moran Vice President, Investor Relations Phone: +1.416.564.4290 E-mail: trish.moran@wesdome.com |
FORWARD-LOOKING STATEMENTS
This news release contains "forward-looking information" which may include, but is not limited to, statements with respect to the Company's updated mineral reserve and mineral resource estimate; the Company's eight-year reserve life at Eagle River and Kiena; Consolidated production growing to up to 230,000 ounces per year by 2028; all-in sustaining costs remaining broadly stable through to 2028 supporting strong margins; the Company's cash-generating capacity of over $1 billion over the next three years; the growth in production and reserves through anticipated resource conversion and exploration success at both Eagle River and Kiena, including potentially higher production levels than those contemplated in the reserve-based mine plan; the Company's three year production and cost outlook, including its assumptions relating to gold production, gold prices, all-in sustaining costs per ounce of gold sold, capital investments and exchange rates; Eagle River's expected stable production profile of approximately 100,000 ouncers per year through 2028 together with its higher throughput levels and planned development rates; the Company's capital plans at Eagle River and Kiena; Continued productivity and cost improvements for Eagle River's operations potentially on the order of 10% to 15%; Kiena's improved mine plan flexibility resulting from expansion beyond Kiena Deep; Kiena's anticipated stable production profile to 2033 through operating execution, resource conversion and extension targets; the increase to Kiena Deep's annual gold production by 10% to 15% annually in the first five years relative to the reserve plan; the near-mine resource growth resulting from the Company's potential gold mineralization of between 2.4 to 6.3 million ounces from exploration targets grading between 0.6 to 26.0 g/t; and other statements that are not historical facts. Often, but not always, forward-looking statements can be identified by the use of words such as "plans", "expects", "is expected", "budget", "scheduled", "estimates", "forecasts", "intends", "anticipates", or "believes" or variations (including negative variations) of such words and phrases, or state that certain actions, events or results "may", "could", "would", "might" or "will" be taken, occur or be achieved. Forward-looking statements involve known and unknown risks, uncertainties and other factors which may cause the actual results, performance or achievements of Wesdome to be materially different from any future results, performance or achievements expressed or implied by the forward-looking statements. Forward-looking statements contained herein are made as of the date of this press release and Wesdome disclaims any obligation to update any forward-looking statements, whether as a result of new information, future events or results or otherwise. There can be no assurance that forward-looking statements will prove to be accurate, as actual results and future events could differ materially from those anticipated in such statements.
Forward-looking statements are based on certain key assumptions and the opinions and estimates of management and the Qualified Persons, as of the date such statements are made, and they involve known and unknown risks, uncertainties and other factors which may cause the actual results, performance or achievements of the Company to be materially different from any other future results, performance or achievements expressed or implied by the forward looking statements. In addition to assumptions and other factors already discussed in this news release, such factors include, among others, fluctuations in metal prices and foreign exchange rates; risks arising from the current economic environment and the impact on operating costs and other financial metrics, including risks of recession; the speculative nature of mineral exploration, development and production, including changes in mineral production performance, exploitation and exploration results; changes in tax, tariff, and royalty regimes in the jurisdictions in which the Company operates, sells it concentrates. or which are otherwise applicable to the Company's business, operations, or financial condition; possible inaccurate estimates relating to future production, operating costs and other costs for operations; possible variations in ore grade and recovery rates; inherent uncertainties in respect of conclusions of economic evaluations, economic studies and mine plans; the Company's dependence on continually developing, replacing and expanding its mineral reserves; the ability of the Company to extend the mine life of its two projects; risks related to the possibility that future exploration results will not be consistent with the Company's expectations, that quantities or grades of reserves will be diminished, and that resources may not be converted to reserves; risks related to the financial results of operations, changes in interest rates, and the Company's ability to finance its operations; the impact of global liquidity and credit availability on the timing of cash flows and the values of assets and liabilities based on projected future cash flows; accidents, labour or other stakeholder disputes and other risks inherent to the mining industry; failure to achieve certain cost savings; risks related to the Company's ability to manage environmental and social matters, including risks and obligations related to closure of the Company's mining properties; risks related to climate change, including extreme weather events, resource shortages, emerging policies and increased regulations relating to related to greenhouse gas emission levels, energy efficiency and reporting of risks; the commencement, continuation or escalation of geopolitical crises and armed conflicts; opposition by social, community, first nations and non-governmental organizations to the Company's mining projects; uncertainties with respect to realizing the anticipated benefits from the development of the Company's exploration and development projects; cyber-attacks and other cybersecurity risks; competition in the mining industry; claims or litigation; limitations on insurance coverage; changes in laws and regulations applicable to the Company and its business and operations; the Company's ability to successfully obtain all necessary permits and other approvals required to conduct its operations; employee relations, including unionized and non-union employees, and the Company's ability to retain key personnel and attract other highly skilled employees; unanticipated title disputes; volatility in the price of the common shares of the Company; damage to the Company's reputation due to the actual or perceived occurrence of any number of events, including negative publicity with respect to the Company's handling of environmental matters or dealings with community groups, whether true or not; as well as those risk factors discussed or referred to in the technical reports to be filed on SEDAR+ (www.sedarplus.ca).
In addition, the Company has made certain assumptions about its three year outlook, including assumptions about: production and cost profile expectations; the ability to execute our mine plans, including the timing thereof; our ability to obtain all required approvals and permits; cost estimates in respect of operating and exploration activities; changes in the Company's input costs; geotechnical risk; the impact of inflation; the geopolitical, economic, permitting and legal climate that we operate in; potential disruptions relating to natural disasters such as forest fires or severe weather; operational exposure to diseases, epidemics and pandemics; timing, cost and results of our construction, improvements and exploration; rising costs or availability of labour, electricity, supplies, fuel and equipment; the future price of gold and other commodities; exchange rates; relationships with communities, governments and other stakeholders; compliance with debt obligations; anticipated values, costs, expenses and working capital requirements; production and metallurgical recoveries; mineral reserves and resources; and the impact of acquisitions, dispositions, suspensions or delays on our business and the ability to achieve our goals. In addition, except where otherwise stated, we have assumed a continuation of existing business operations on substantially the same basis as exists at the time of this press release. Even though our management believes that the assumptions made and the expectations represented by such statements or information are reasonable in the circumstances, there can be no assurance that the forward-looking statement or information will prove to be accurate. Many assumptions may be difficult to predict and are beyond the Company's control.
Furthermore, should one or more of the risks, uncertainties or other factors materialize, or should underlying assumptions prove incorrect, actual results may vary materially from those described in forward-looking statements or information. These risks, uncertainties and other factors including the risk factors discussed in the sections titled "Cautionary Note Regarding Forward Looking Information" and "Risks and Uncertainties" in Wesdome's most recent Annual Information Form. Readers are urged to carefully review the detailed risk discussion in Wesdome's most recent Annual Information Form which is available on SEDAR+ (www.sedarplus.ca).
Mineral resources are not mineral reserves, and do not have demonstrated economic viability, but do have reasonable prospects for economic extraction. Indicated mineral resources are sufficiently well defined to allow geological and grade continuity to be reasonably assumed and permit the application of technical and economic parameters in assessing the economic viability of the resource. Inferred mineral resources are estimated on limited information not sufficient to verify geological and grade continuity or to allow technical and economic parameters to be applied. Inferred mineral resources are too speculative geologically to have economic considerations applied to them to enable them to be categorized as mineral reserves. There is no certainty that mineral resources of any category can be upgraded to mineral reserves through continued exploration.
The Company's mineral reserve and mineral resource figures are estimates, and Wesdome can provide no assurances that the indicated levels of gold will be produced, or that Wesdome will receive the metal prices assumed in determining its mineral reserves. Such estimates are expressions of judgment based on knowledge, mining experience, analysis of drilling results, and industry practices. Valid estimates made at a given time may significantly change when new information becomes available. While Wesdome believes that these mineral reserve and mineral resource estimates are well established, and the best estimates of the Company's management, by their nature mineral reserve and mineral resource estimates are imprecise and depend, to a certain extent, upon analysis of drilling results and statistical inferences, which may ultimately prove unreliable. If the Company's mineral reserve or mineral reserve estimates for its properties are inaccurate or are reduced in the future, this could have an adverse impact on Wesdome's future cash flows, earnings, results, operations and financial condition.
The statements relating to the Company's exploration targets provided herein, including potential grade and quantity are conceptual in nature only since there has been insufficient exploration to define a mineral resource, as defined by NI 43-101, and it is uncertain if further exploration will result in the target being delineated as a mineral resource. There can be no assurance that such statements will prove to be accurate, as actual results and future events could differ materially from those anticipated in such statements.
APPENDIX
NON-IFRS PERFORMANCE MEASURES
Wesdome uses non-IFRS performance measures throughout this news release as it believes that these generally accepted industry performance measures provide a useful indication of the Company's operational performance. These non-IFRS performance measures do not have standardized meanings defined by IFRS and may not be comparable to information in other gold producers' reports and filings. Accordingly, it is intended to provide additional information and should not be considered in isolation or as a substitute for measures of performance prepared in accordance with IFRS. A reconciliation of the non-IFRS measures used herein can be found in the Company's most recently filed Management's Discussion and Analysis dated May 12, 2026, which is available on SEDAR+ (www.sedarplus.ca). The non-IFRS performance measures include:
- Sustaining capital and growth capital
- AlSC and AISC per ounce of gold sold
- Free cash flow and free cash flow per share
Sustaining Capital and Growth Capital
Sustaining capital expenditures are generally defined as expenditures that support the ongoing operation of the asset or business without any associated increase in capacity, life of assets or future earnings. This measure is being used by management to understand the ongoing capital cost required to maintain operations at current levels.
Growth capital expenditures are generally defined as capital expenditures that expand existing capacity, increase life of assets and/or increase future earnings. This measure is used by management to understand the costs of developing new operations or major projects at existing operations where these projects will materially increase production from current levels.
AISC and AISC per Ounce of Gold Sold
AISC includes mine site operating costs incurred at the Company's mining operations, sustaining mine capital and development expenditures, mine site exploration and evaluation expenditures and equipment lease payments related to the mine operations and corporate and general expenses. The Company believes that this measure represents the total cash costs of producing gold from current operations and provides the Company and other stakeholders with additional information that illustrates its operational performance and ability to generate cash flow. This cost measure seeks to reflect the total cost of gold production from current operations on a per ounce of gold sold basis. New project and growth capital are not included. Wesdome is targeting to begin calculating AISC in accordance with the World Gold Council guidelines starting in the 2027 calendar year in conjunction with IFRS 18 reporting changes, ensuring alignment with industry standards and improved comparability for investors.
Free Cash Flow and Free Cash Flow per Share
Free cash flow is a non-IFRS measure and is calculated by taking net cash provided by operating activities less cash used in capital expenditures and lease payments as reported in the Company's financial statements. Free cash flow is a useful indicator of the Company's ability to operate without reliance on additional borrowing or usage of existing cash. Free cash flow per share is calculated by dividing free cash flow by the weighted average number of shares outstanding for the period.
TECHNICAL REPORT SUMMARIES
Eagle River Technical Report Summary
| Key Metrics | 2026 | 2027 | 2028 | 2029 | 2030 | 2031 | 2032 | 2033 | |
| Mill Feed | kt | 265 | 369 | 376 | 371 | 382 | 383 | 380 | 369 |
| Mill Feed Grade | g/t Au | 12.9 | 8.8 | 8.2 | 7.2 | 6.6 | 5.6 | 5.2 | 5.3 |
| Recovery | % | 96.6 | 96.1 | 95.9 | 95.7 | 95.5 | 95.0 | 94.9 | 94.9 |
| Gold Production | koz | 106 | 100 | 95 | 82 | 77 | 65 | 61 | 60 |
| Operating Costs | |||||||||
| Mining | $/t milled | $256 | $205 | $216 | $224 | $215 | $213 | $211 | $197 |
| Processing | $/t milled | $99 | $84 | $89 | $98 | $84 | $81 | $81 | $82 |
| SG&A | $/t milled | $201 | $126 | $115 | $112 | $103 | $97 | $89 | $76 |
| Total Cost per Tonne Milled | $/t milled | $556 | $415 | $420 | $434 | $402 | $391 | $381 | $354 |
| Capital Expenditures | |||||||||
| Sustaining Capital | $M | $37 | $53 | $41 | $37 | $26 | $29 | $19 | $1 |
| Growth Capital | $M | $45 | $52 | $36 | $16 | $0 | $1 | $0 | $0 |
| Total Capital Costs | $M | $81 | $105 | $77 | $52 | $26 | $29 | $19 | $1 |
Kiena Technical Report Summary
| Key Metrics | 2026 | 2027 | 2028 | 2029 | 2030 | 2031 | 2032 | 2033 | |
| Mill Feed | kt | 307 | 352 | 359 | 309 | 295 | 339 | 312 | 281 |
| Mill Feed Grade | g/t Au | 8.6 | 8.9 | 8.4 | 10.2 | 9.3 | 8.1 | 8.3 | 7.5 |
| Recovery | % | 98.5 | 98.5 | 98.5 | 98.5 | 98.5 | 98.3 | 98.3 | 98.2 |
| Gold Production | koz | 84 | 99 | 96 | 99 | 87 | 86 | 81 | 67 |
| Operating Costs | |||||||||
| Mining | $/t milled | $260 | $245 | $250 | $264 | $281 | $246 | $242 | $190 |
| Processing | $/t milled | $52 | $49 | $48 | $54 | $55 | $50 | $51 | $45 |
| SG&A | $/t milled | $99 | $86 | $84 | $98 | $103 | $89 | $90 | $83 |
| Total Cost per Tonne Milled | $/t milled | $411 | $380 | $383 | $416 | $439 | $386 | $383 | $318 |
| Capital Expenditures | |||||||||
| Sustaining Capital | $M | $54 | $54 | $31 | $20 | $25 | $33 | $29 | -- |
| Growth Capital | $M | $47 | $14 | $12 | $13 | $21 | -- | -- | -- |
| Total Capital Costs | $M | $101 | $68 | $43 | $33 | $46 | $33 | $29 | -- |
ENDNOTES
Refer to "Non-IFRS Performance Measures" for the reconciliation of non-IFRS measurements to the financial statements.
Approximately 27.2 to 40.1 Mt grading 2.7 - 4.9 g/t for an exploration target of 2.4 - 6.3 Moz Au. The potential quantity and grade are conceptual in nature. There has been insufficient exploration to estimate and define a mineral resource, as defined by NI 43-101, and it is uncertain if further exploration will result in the target being delineated as a mineral resource.
![]()
To view the source version of this press release, please visit https://www.newsfilecorp.com/release/302774
Source: Wesdome Gold Mines Ltd.

