
BlackRock American Income Trust Plc - Portfolio Update
PR Newswire
LONDON, United Kingdom, July 22
BLACKROCK AMERICAN INCOME TRUST PLC (LEI:549300WWOCXSC241W468)
All information is at 30 June 2026 and unaudited.
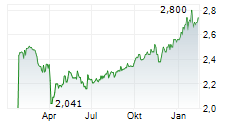
Performance at month end with net income reinvested
One Month | Three Months | Six Months | One Year | Three Years | Five Years | |
Net asset value | 5.0 | 14.8 | 20.5 | 38.0 | 54.6 | 70.7 |
Share price | 4.0 | 17.9 | 23.3 | 49.5 | 70.3 | 86.2 |
Russell 1000 Value Index | 3.9 | 13.1 | 17.8 | 31.2 | 56.5 | 76.8 |
Russell 1000 Value Index (Net 15% WHT Total Return)* | 3.8 | 13.1 | 17.7 | 30.9 | 55.0 | 74.0 |
*The Company's performance reference index (the Russell 1000 Value Index) may be calculated on either a gross or a net return basis. Net return (NR) indices calculate the reinvestment of dividends net of withholding taxes using the tax rates applicable to non-resident institutional investors and hence give a lower total return than indices where calculations are done on a gross basis. As the Company is subject to the same withholding tax rates for the countries in which it invests, the NR basis is felt to be the most accurate, appropriate, consistent and fair comparison of performance returns for the Company.
At month end
Net asset value - capital only: | 269.11p |
Net asset value - cum income: | 269.55p |
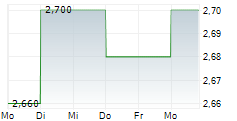
Share price: | 273.00p |
Premium to cum income NAV: | 1.3% |
Net yield 1 : | 5.1% |
Total assets including current year revenue: | £162.7m |
Net cash: | 0.6% |
Ordinary shares in issue 2 : | 60,360,138 |
Ongoing charges 3 : | 0.73% |
1 Based on one quarterly dividend of 3.23p per share declared on 07 August 2025 and one quarterly dividend of 3.44p per share declared on 03 November 2025 for the year ended 31 October 2025 and based on one quarterly dividend of 3.55p per share declared on 02 February 2026 and one quarterly dividend of 3.75p declared on 01 May 2026 for the year ending 31 October 2026, and based on the share price as at close of business on 30 June 2026.
² Excluding 35,001,167 ordinary shares held in treasury.
³ The Company's ongoing charges calculated as a percentage of average daily net assets and using the management fee and all other operating expenses excluding finance costs, direct transaction costs, custody transaction charges, VAT recovered, taxation and certain non-recurring items for the year ended 31 October 2025.
Sector Analysis | Total Assets (%) |
Information Technology | 19.7 |
Financials | 17.9 |
Health Care | 12.9 |
Industrials | 12.4 |
Consumer Discretionary | 11.7 |
Consumer Staples | 6.2 |
Energy | 5.9 |
Materials | 3.5 |
Communication Services | 3.2 |
Utilities | 2.9 |
Real Estate | 2.5 |
Net Current Assets | 1.2 |
----- | |
100.0 | |
===== | |
Country Analysis | Total Assets (%) |
United States | 98.8 |
Net Current Assets | 1.2 |
---- | |
100.0 | |
===== | |
#
Top 10 Holdings | Country | % Total Assets |
Amazon | United States | 6.0 |
Apple | United States | 5.0 |
Microsoft | United States | 3.8 |
Berkshire Hathaway | United States | 2.7 |
JPMorgan Chase | United States | 2.4 |
Bank Of America | United States | 1.9 |
Exxon Mobil | United States | 1.8 |
Procter & Gamble | United States | 1.7 |
Intel | United States | 1.5 |
Abbott Laboratories | United States | 1.5 |
Travis Cooke and Muzo Kayacan, representing the Investment Manager, noted:
For the month ended 30 June 2026, the Company's NAV returned 5.0%, marginally outperforming the Russell 1000 Value Index which returned 3.8% net of fees.
AI infrastructure demand continued to influence equity market leadership, particularly for semiconductor equipment, memory, optical connectivity and data-centre infrastructure. However, the same theme also created pockets of volatility as investors debated capital intensity, margins and valuation risk across mega-cap technology and related infrastructure names. Meanwhile the Federal Reserve ('Fed') kept policy unchanged in June, maintaining the federal funds target range at 3.50%-3.75%, while inflation data released during the month showed CPI still running well above the Fed's target. This reinforced a higher-for-longer rate narrative. But U.S. activity data remained constructive, with May retail sales rising and the June Institute for Supply Management Manufacturing Purchasing Managers' Index staying in expansion territory at 53.3, helped by continued growth in new orders. That backdrop was supportive for economically sensitive areas such as Industrials and Financials.
Positive sector contributions to portfolio performance came from positions in Information Technology, Financials, Consumer Discretionary, Communication Services and Industrials. In Information Technology, overweights in semiconductor equipment and semiconductor manufacturers were the key driver as AI-related capital spending continued to support the sector. Overweights in banks were rewarded as the outlook for interest rates remained supportive for net interest income. Sector detraction was concentrated in Materials, Real Estate and Energy. Within Materials, positions in chemicals and aluminum/steel were pain points, while Energy overweights detracted as oil prices continued to retreat from the levels seen in April and May.
Macro and fundamental insights contributed positively, with industry and style timing signals capturing the strength in semiconductors, financials and industrial cyclicals. Quality-oriented signals were effective, especially those favouring companies with stronger management forecasts, better capital efficiency, lower idiosyncratic risk and more durable balance-sheet characteristics. Sentiment Insights detracted. The main weakness came from trend, thematic and hedge-fund-positioning indicators, which struggled as some crowded and momentum-exposed areas of the market experienced some volatility.
22 July 2026
Latest information is available by typing blackrock.com/uk/braion the internet, "BLRKINDEX" on Reuters, "BLRK" on Bloomberg or "8800" on Topic 3 (ICV terminal). Neither the contents of the Manager's website nor the contents of any website accessible from hyperlinks on the Manager's website (or any other website) is incorporated into, or forms part of, this announcement.

