BlackRock American Income Trust Plc - Portfolio Update
PR Newswire
LONDON, United Kingdom, July 23
BLACKROCK AMERICAN INCOME TRUST PLC (LEI:549300WWOCXSC241W468)
All information is at 30 June 2025 and unaudited.
Performance at month end with net income reinvested
| One Month | Three Months | Six Months | One Year | Three Years | Five Years |
Net asset value | 1.8 | -1.2 | -1.7 | -0.2 | 15.1 | 52.2 |
Share price | -0.7 | 0.6 | 0.1 | 3.1 | 18.0 | 59.2 |
Russell 1000 Value Index | 1.8 | -2.2 | -3.1 | 4.9 | 27.1 | 73.1 |
Russell 1000 Value Index (Net 15% WHT Total Return)*
| 1.7 | -2.3 | -3.3 | 4.6 | 25.8 | 70.3
|
*The Company's performance reference index (the Russell 1000 Value Index) may be calculated on either a gross or a net return basis. Net return (NR) indices calculate the reinvestment of dividends net of withholding taxes using the tax rates applicable to non-resident institutional investors, and hence give a lower total return than indices where calculations are done on a gross basis. As the Company is subject to the same withholding tax rates for the countries in which it invests, the NR basis is felt to be the most accurate, appropriate, consistent and fair comparison of performance returns for the Company.
At month end
Net asset value - capital only: | 207.16p |
Net asset value - cum income: | 207.39p |
Share price: | 194.00p |
Discount to cum income NAV: | 6.5% |
Net yield1: | 4.7% |
Total assets including current year revenue: | £117.0m |
Net gearing: | 0.3% |
Ordinary shares in issue2: | 56,431,142 |
Ongoing charges3: | 1.06% |
1 Based on two quarterly dividends of 2.00p per share declared on 1 August 2024 and 13 November 2024 for the year ended 31 October 2024, one quarterly dividend of 2.00p per share declared on 1 April 2025 and one quarterly dividend of 3.03p per share declared on 15 May 2025 for the year ending 31 October 2025 and based on the share price as at close of business on 30 June 2025.
² Excluding 38,930,163 ordinary shares held in treasury.
³ The Company's ongoing charges calculated as a percentage of average daily net assets and using the management fee and all other operating expenses excluding finance costs, direct transaction costs, custody transaction charges, VAT recovered, taxation and certain non-recurring items for the year ended 31 October 2024.
Sector Analysis | Total Assets (%) |
Financials | 22.2 |
Industrials | 14.1 |
Health Care | 12.8 |
Information Technology | 11.8 |
Consumer Discretionary | 8.9 |
Communication Services | 7.3 |
Consumer Staples | 7.0 |
Energy | 5.6 |
Utilities | 4.2 |
Real Estate | 3.2 |
Materials | 3.0 |
Net Current Liabilities | -0.1 |
| ----- |
| 100.0 |
| ===== |
|
|
Country Analysis | Total Assets (%) |
United States | 100.1 |
Net Current Liabilities | -0.1 |
| ----- |
| 100.0 |
| ===== |
|
|
#
Top 10 Holdings | Country | % Total Assets |
JPMorgan Chase | United States | 3.1 |
Alphabet | United States | 2.8 |
Berkshire Hathaway | United States | 2.8 |
Walmart | United States | 2.6 |
Amazon | United States | 2.5 |
Bank Of America | United States | 2.3 |
Morgan Stanley | United States | 1.8 |
Charles Schwab | United States | 1.8 |
Medtronic | United States | 1.7 |
Pfizer | United States | 1.7 |
|
|
|
| ||
Travis Cooke and Muzo Kayacan, representing the Investment Manager, noted:
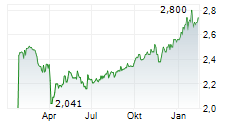
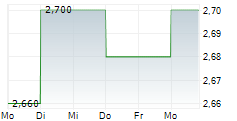
For the month ended 30 June 2025, the Company's NAV rose by 1.8% in sterling terms, in line with the Russell 1000 Value Index, which gained 1.7%. However, the share price lagged, declining by 0.7% over the same period in sterling terms.
At the sector level, an overweight position in Health Care was particularly beneficial, with positioning supported by value and momentum signals. In particular, an overweight exposure in Cardinal Health contributed, as the stock rallied following its Investor Day, where the company's raised earnings guidance reaffirmed strong long-term growth targets and expanded its share buyback programme¹.
An underweight allocation to Real Estate was less successful; however, this was not driven by allocation, as the sector faced only modest headwinds over the month. Instead, the underperformance stemmed almost entirely from an overweight position in Equinix, which shed 18% of its market value following the announcement of aggressive capital expenditure plans and lowered guidance for future earnings growth during its Analyst Day2.
At the signal level, sentiment-oriented insights continued their strong performance, particularly through guiding strong selection in Financials. Once again, insights leveraging text mining of management earnings calls delivered robust results, as did slower-moving short interest signals.
In contrast, quality signals - particularly those evaluating balance sheet strength via metrics such as expected default frequency - were less effective over the month. These signals were wrongfooted by a broad-based risk-on rally, driven by falling rate expectations and renewed soft-landing optimism. Investor appetite shifted toward higher-beta, more speculative names, with fundamentals like leverage and earnings stability temporarily overshadowed by liquidity-driven sentiment and momentum in growth assets3.
Positioning Changes
At the sector level, the largest buy was of Industrials, which moved from a small underweight position to a modest overweight, driven by strong momentum and sentiment signals. Real Estate was the largest trim, driven by negative views from quality signals.
1Cardinal Health, "Cardinal Health Details Momentum and Updated Long-Term Value Creation Plans at Investor Day", June 2025
2Reuters "Equinix shares fall as revenue, capital spending forecast disappoint investors", June 2025
3Reuters, "Trading Day: Markets 'run it hot'", June 2025
Source: BlackRock.
23 July 2025
Latest information is available by typing blackrock.com/uk/brai on the internet, "BLRKINDEX" on Reuters, "BLRK" on Bloomberg or "8800" on Topic 3 (ICV terminal). Neither the contents of the Manager's website nor the contents of any website accessible from hyperlinks on the Manager's website (or any other website) is incorporated into, or forms part of, this announcement.
Release |


