BlackRock World Mining Trust Plc - Portfolio Update
PR Newswire
LONDON, United Kingdom, November 21
BLACKROCK WORLD MINING TRUST PLC (LEI) - LNFFPBEUZJBOSR6PW155
All information is at
31 October 2025and unaudited.
Performance at month end with net income reinvested | |||||
| |||||
| One | Three | One | Three | Five |
| Month | Months | Year | Years | Years |
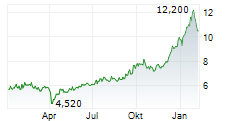
Net asset value | 3.9% | 30.3% | 32.2% | 40.8% | 111.0% |
Share price | -3.1% | 19.8% | 29.2% | 27.9% | 116.0% |
MSCI ACWI Metals & Mining 30% Buffer 10/40 Index (Net)* | 2.8% | 27.9% | 30.9% | 54.7% | 101.9% |
| |||||
* (Total return) Sources: BlackRock, MSCI ACWI Metals & Mining 30% Buffer 10/40 Index, Datastream | |||||
At month end
Net asset value (including income) 1 : | 727.97p |
Net asset value (capital only): | 720.34p |
Share price: | 659.00p |
Discount to NAV 2 : | 9.5% |
Total assets: | £1,454.1m |
Net yield 3 : | 3.5% |
Net gearing: | 9.4% |
Ordinary shares in issue: | 186,683,036 |
Ordinary shares held in Treasury: | 6,328,806 |
Ongoing charges 4 : | 0.95% |
Ongoing charges 5 : | 0.84% |
1 Includes net revenue of 7.63p.
2 Discount to NAV including income.
3 Based on the third interim dividend of 5.50p per share declared on 15 November 2024 with ex date 28 November 2024 and paid 20 December 2024 and the final dividend of 6.50p per share declared on 6 March 2025 with ex date 20 March and pay date 27 May 2025 in respect of the year ended 31 December 2024, and a first interim dividend of 5.50p per share declared on 21 May 2025 with ex date 29 May 2025 and pay date 27 June 2025, in respect of the year ending 31 December 2025 and second interim dividend of 5.50p per share declared on 3 September 2025 with ex date 11 September 2025 and pay date 3 October 2025.
4 The Company's ongoing charges are calculated as a percentage of average daily net assets and using the management fee and all other operating expenses, excluding finance costs, direct transaction costs, custody transaction charges, VAT recovered, taxation and certain other non-recurring items for the year ended 31 December 2024.
5 The Company's ongoing charges are calculated as a percentage of average daily gross assets and using the management fee and all other operating expenses, excluding finance costs, direct transaction costs, custody transaction charges, VAT recovered, taxation and certain other non-recurring items for the year ended 31 December 2024.
Country Analysis | Total |
Global | 54.3 |
Canada | 11.7 |
Latin America | 9.9 |
United States | 7.9 |
Australasia | 7.0 |
South Africa | 5.8 |
Other Africa | 2.8 |
Indonesia | 0.4 |
Net Current Assets | 0.2 |
----- | |
Sector Analysis | Total |
Gold | 35.2 |
Diversified | 26.2 |
Copper | 20.8 |
Steel | 5.7 |
Platinum Group Metals | 3.5 |
Industrial Minerals | 3.3 |
Iron Ore | 1.3 |
Uranium | 1.2 |
Aluminium | 0.9 |
Nickel | 0.6 |
Silver | 0.6 |
Zinc | 0.5 |
Net Current Assets | 0.2 |
----- | |
Ten largest investments |
|
|
|
Company | Total Assets % |
|
|
Vale: Equity | 5.4 |
Debenture | 2.5 |
Agnico Eagle Mines | 6.8 |
BHP: |
|
Equity | 3.9 |
Royalty | 1.7 |
Rio Tinto | 5.5 |
Newmont | 4.8 |
Barrick Mining | 4.7 |
Anglo American | 4.3 |
AngloGold Ashanti Plc | 3.9 |
Kinross Gold | 3.9 |
Wheaton Precious Metals | 3.7 |
Asset Analysis | Total Assets (%) |
Equity | 96.9 |
Bonds | 1.7 |
Convertible Bond | 0.6 |
Preferred Stock | 0.6 |
Net Current Assets | 0.2 |
----- | |
100.0 | |
Commenting on the markets, Evy Hambro and Olivia Markham, representing the Investment Manager noted: |
Markets: October was a relatively flat month for the mining sector, after a strong rally during September. Potential contributors to the pause in performance included the weakening of industrial output in China with its Manufacturing PMI falling to 49 from 49.8 in September (marking the seventh consecutive month of industrial contraction), U.S - China trade uncertainty and China's Golden Week National Day holiday. Gold equities dragged on the sector's performance during a period of heightened volatility for the price of gold. They exhibited a high sensitivity to the decline in the gold price in the second half of the month, which outweighed gains seen earlier in the period. Overall, the gold price rose 3.8% over the 1-month period, finishing at US$3,979/oz. The copper price rose by 6.3% over the period to finish at US$10,873/tonne, driven by continued demand strength in areas such as electrification, AI data centre buildouts and increasing adoption of renewables, as well as supply chain disruptions at major mines. For instance, Coldeco's recorded its lowest monthly copper output since 2003 due to an accident in the El Teniente mine earlier in July, whilst Freeport McMoran's Grasberg mine in Indonesia remained offline. The bulk commodities exhibited more modest gains, with the iron ore (62% fe.) price rising +3.7%, as China stocked up its reserves during the month, which may signal improving sentiment despite ongoing weak steel demand from the property sector. Outlook: Near term, the mining sector faces a headwind of uncertainty surrounding China's economy. That said, the country's anti-involution measures could be a cause for optimism, and we are seeing green shoots of improvement in economic data. Trade relations with the US remains a risk. Longer-term, we are excited by mined commodity demand coming from infrastructure build out related to multi-decade structural trends: rising power demand, artificial intelligence adoption and the low carbon transition. Increased geopolitical risk appears to have accelerated government action in these areas. On the supply side, mining companies have focused on capital discipline in recent years, meaning they have opted to pay down debt, reduce costs and return capital to shareholders, rather than investing in production growth. This is limiting new supply coming online and supporting commodity prices and there is unlikely to be a quick fix, given the time lags involved in investing in new mining projects. The cost of new projects has also risen significantly and recent M&A activity in the sector suggests that, like us, strategic buyers see an opportunity in existing assets in the listed market, currently trading well below replacement costs. High-profile operational disruption, most notably in copper, has exacerbated these issues. Recent action from governments suggest they are increasingly focused on securing metals and minerals supply but we believe this is still being underappreciated by markets. Lastly, we see an exciting outlook for gold producer earnings and it is our largest sub-sector exposure today. The gold price has risen substantially and looks well-supported by structural drivers: inflation eroding the purchasing power of fiat currency, high government debt and elevated geopolitical risk. Meanwhile, the substantial cost inflation that held back the sub-sector from 2020-2024 appears to be over and given our expectation for subdued energy prices, we could start to see these costs declining. Despite recent strong performance from gold equities, they still appear unloved amongst generalists and look attractive in our view relative to gold and their historic valuations. |
21 November 2025 Latest information is available by typing www.blackrock.com/uk/brwm on the internet. Neither the contents of the Manager's website nor the contents of any website accessible from hyperlinks on the Manager's website (or any other website) is incorporated into, or forms part of, this announcement. |
Release |


