


VANCOUVER, British Columbia, Feb. 10, 2026 (GLOBE NEWSWIRE) -- Imperial Metals Corporation (the "Company" or "Imperial") (TSX:III) reports that 2025 metal production from Mount Polley mine was 30.715 million pounds of copper and 37,555 ounces of gold. The mine production exceeded the 2025 target of 25.0 - 27.0 million pounds for copper production and met the target of 35 - 40 thousand ounces for gold production.
Mount Polley Mine - Production
During 2025, 6,714,195 tonnes of ore were treated, which was flat compared to 2024, and 30.715 million pounds copper (down 14.0% from 2024) and 37,555 ounces gold (down 4% from 2024) were produced.
The majority of the mill feed during the fourth quarter was from Phase 5 and low grade stockpiles. This led to lower grades and lower copper recovery during the period. The Phase 4 and 5 pushbacks of the Springer Pit generated approximately 50% of the mill feed during the quarter with the remainder coming from lower grade stockpiles. Phase 4 mining will be completed in February 2026.
| Mount Polley Mine Production | Three Months Ended December 31 | Year Ended December 31 | ||||||
| 2025 | 2024 | 2025 | 2024 | |||||
| Ore milled - tonnes | 1,452,466 | 1,660,937 | 6,714,195 | 6,741,127 | ||||
| Ore milled per calendar day - tonnes | 15,788 | 18,054 | 18,395 | 18,418 | ||||
| Grade % - copper | 0.193 | 0.306 | 0.255 | 0.292 | ||||
| Grade g/t - gold | 0.216 | 0.256 | 0.254 | 0.263 | ||||
| Recovery % - copper | 75.5 | 82.5 | 81.4 | 82.3 | ||||
| Recovery % - gold | 65.4 | 69.9 | 68.5 | 68.6 | ||||
| Copper - 000's pounds | 4,660 | 9,242 | 30,715 | 35,700 | ||||
| Gold - ounces | 6,589 | 9,564 | 37,555 | 39,108 | ||||
The 2026 production target for Mount Polley mine is 19 - 21 million pounds copper and 40,000 - 44,000 ounces gold. The majority of the mill feed in 2026 will come from the Phase 5 pushback in the Springer Pit which will be supplemented with low grade stockpiles to supply the mill feed.
Red Chris mine 2025 production will be released when the reconciled information is received from Newmont Corporation.
Mount Polley Exploration Update
Imperial reports additional results from the Mount Polley 2025 Phase 2 exploration program which had three goals: to test a high-grade zone beneath the Wight Pit (see previous News Release January 22, 2026); to expand and determine the boundaries for mineralization in a potential C2 open pit expansion and find the boundaries of the higher gold grade encountered at depth in the C2 zone; and to test beneath the previously mined Bell Pit for depth extension. The intervals were analyzed for both total copper and non-sulphide copper. The ratio of non-sulphide to total copper is key to determining copper recovery from the often highly oxidized near surface mineralization in C2 zone. Two holes were drilled beneath the previously mined Bell Pit for depth extension.
Figure 1 - Plan Map.

Thirteen drill holes intersected significant gold and copper values near surface in the C2 zone. Of note, drill hole C2-25-123 intersected 82.5 metres grading 0.45% copper and 0.88 g/t gold from a depth of 30.0 metres. That intercept included 47.5 metres grading 0.56% copper and 1.22 g/t gold from a depth of 57.5 metres.
Table 1: Significant results from near surface C2 zone drilling (See Figures 2 and 3, Section A-A' and B-B').
| Hole ID | From (m) | To (m) | Width (m) | Cu (%) | Au (g/t) | CuOx Ratio%* | ||||||
| C2-25-123 | 30.0 | 112.5 | 82.5 | 0.45 | 0.88 | 49 | ||||||
| Including | 57.5 | 105.0 | 47.5 | 0.56 | 1.22 | 54 | ||||||
| C2-25-124 | 21.0 | 45.0 | 24.0 | 0.25 | 0.32 | 38 | ||||||
| C2-25-127 | 35.0 | 50.0 | 15.0 | 0.13 | 0.17 | 8 | ||||||
| C2-25-128 | 100.0 | 120.0 | 20.0 | 0.16 | 0.35 | 4 | ||||||
| C2-25-129 | 65.0 | 90.0 | 25.0 | 0.32 | 0.54 | 3 | ||||||
| And | 110.0 | 125.0 | 15.0 | 0.24 | 0.28 | 29 | ||||||
| C2-25-130 | 47.5 | 65.0 | 17.5 | 0.18 | 0.37 | 2 | ||||||
| And | 145.0 | 160.0 | 15.0 | 0.27 | 0.25 | 26 | ||||||
| C2-25-131 | 52.0 | 82.5 | 30.0 | 0.20 | 0.10 | 32 | ||||||
| C2-25-132 | 105.0 | 117.5 | 12.5 | 0.25 | 0.55 | 27 | ||||||
| C2-25-133 | 105.0 | 135.0 | 30.0 | 0.15 | 0.27 | 40 | ||||||
| C2-25-135 | 87.5 | 99.0 | 11.5 | 0.20 | 0.36 | 12 | ||||||
| C2-25-136 | 12.5 | 65.0 | 52.5 | 0.16 | 0.17 | 56 | ||||||
| C2-25-137 | 16.5 | 142.5 | 126.0 | 0.20 | 0.27 | 39 | ||||||
| Including | 99.4 | 132.5 | 33.1 | 0.28 | 0.39 | 32 | ||||||
| C2-25-139 | 42.5 | 90.0 | 47.5 | 0.27 | 0.35 | 31 | ||||||
| C2-25-142 | 6.0 | 50.0 | 44.0 | 0.42 | 0.39 | 59 | ||||||
| And | 250.0 | 390.0 | 140.0 | 0.19 | 0.30 | 7 | ||||||
| *CuOx Ratio% = (Copper Oxide%/ Total Copper %) * 100 | ||||||||||||
Five drill holes targeted mineralization beneath the near surface C2 zone. Hole C2-25-139 which targeted the northwestern extent of the inferred deep C2 zone and intersected significant shallow mineralization starting at 42.5 metres depth but was unsuccessful at intercepting the deeper C2 zone. The shallow interval intersected 47.5 metres grading 0.27% copper and 0.35 g/t gold from a depth of 42.5 metres.
All the remaining drill holes were successful in intercepting deeper mineralization. Hole C2-25-142 intersected both shallow and deep mineralization, returning 44.0 metres grading 0.42% copper and 0.39 g/t gold from a depth of 6.0 metres, and 140.0 metres grading 0.19% copper and 0.30 g/t gold from a depth of 250.0 metres. Hole C2-25-138 also targeted the deep C2 zone target and intersected 77.5 metres grading 0.49% copper and 0.82 g/t gold from a depth of 277.5 metres. Including 45.0 metres grading 0.72% copper and 1.10 g/t gold from a depth of 277.5 metres.
Figure 2 - Section A - A'.
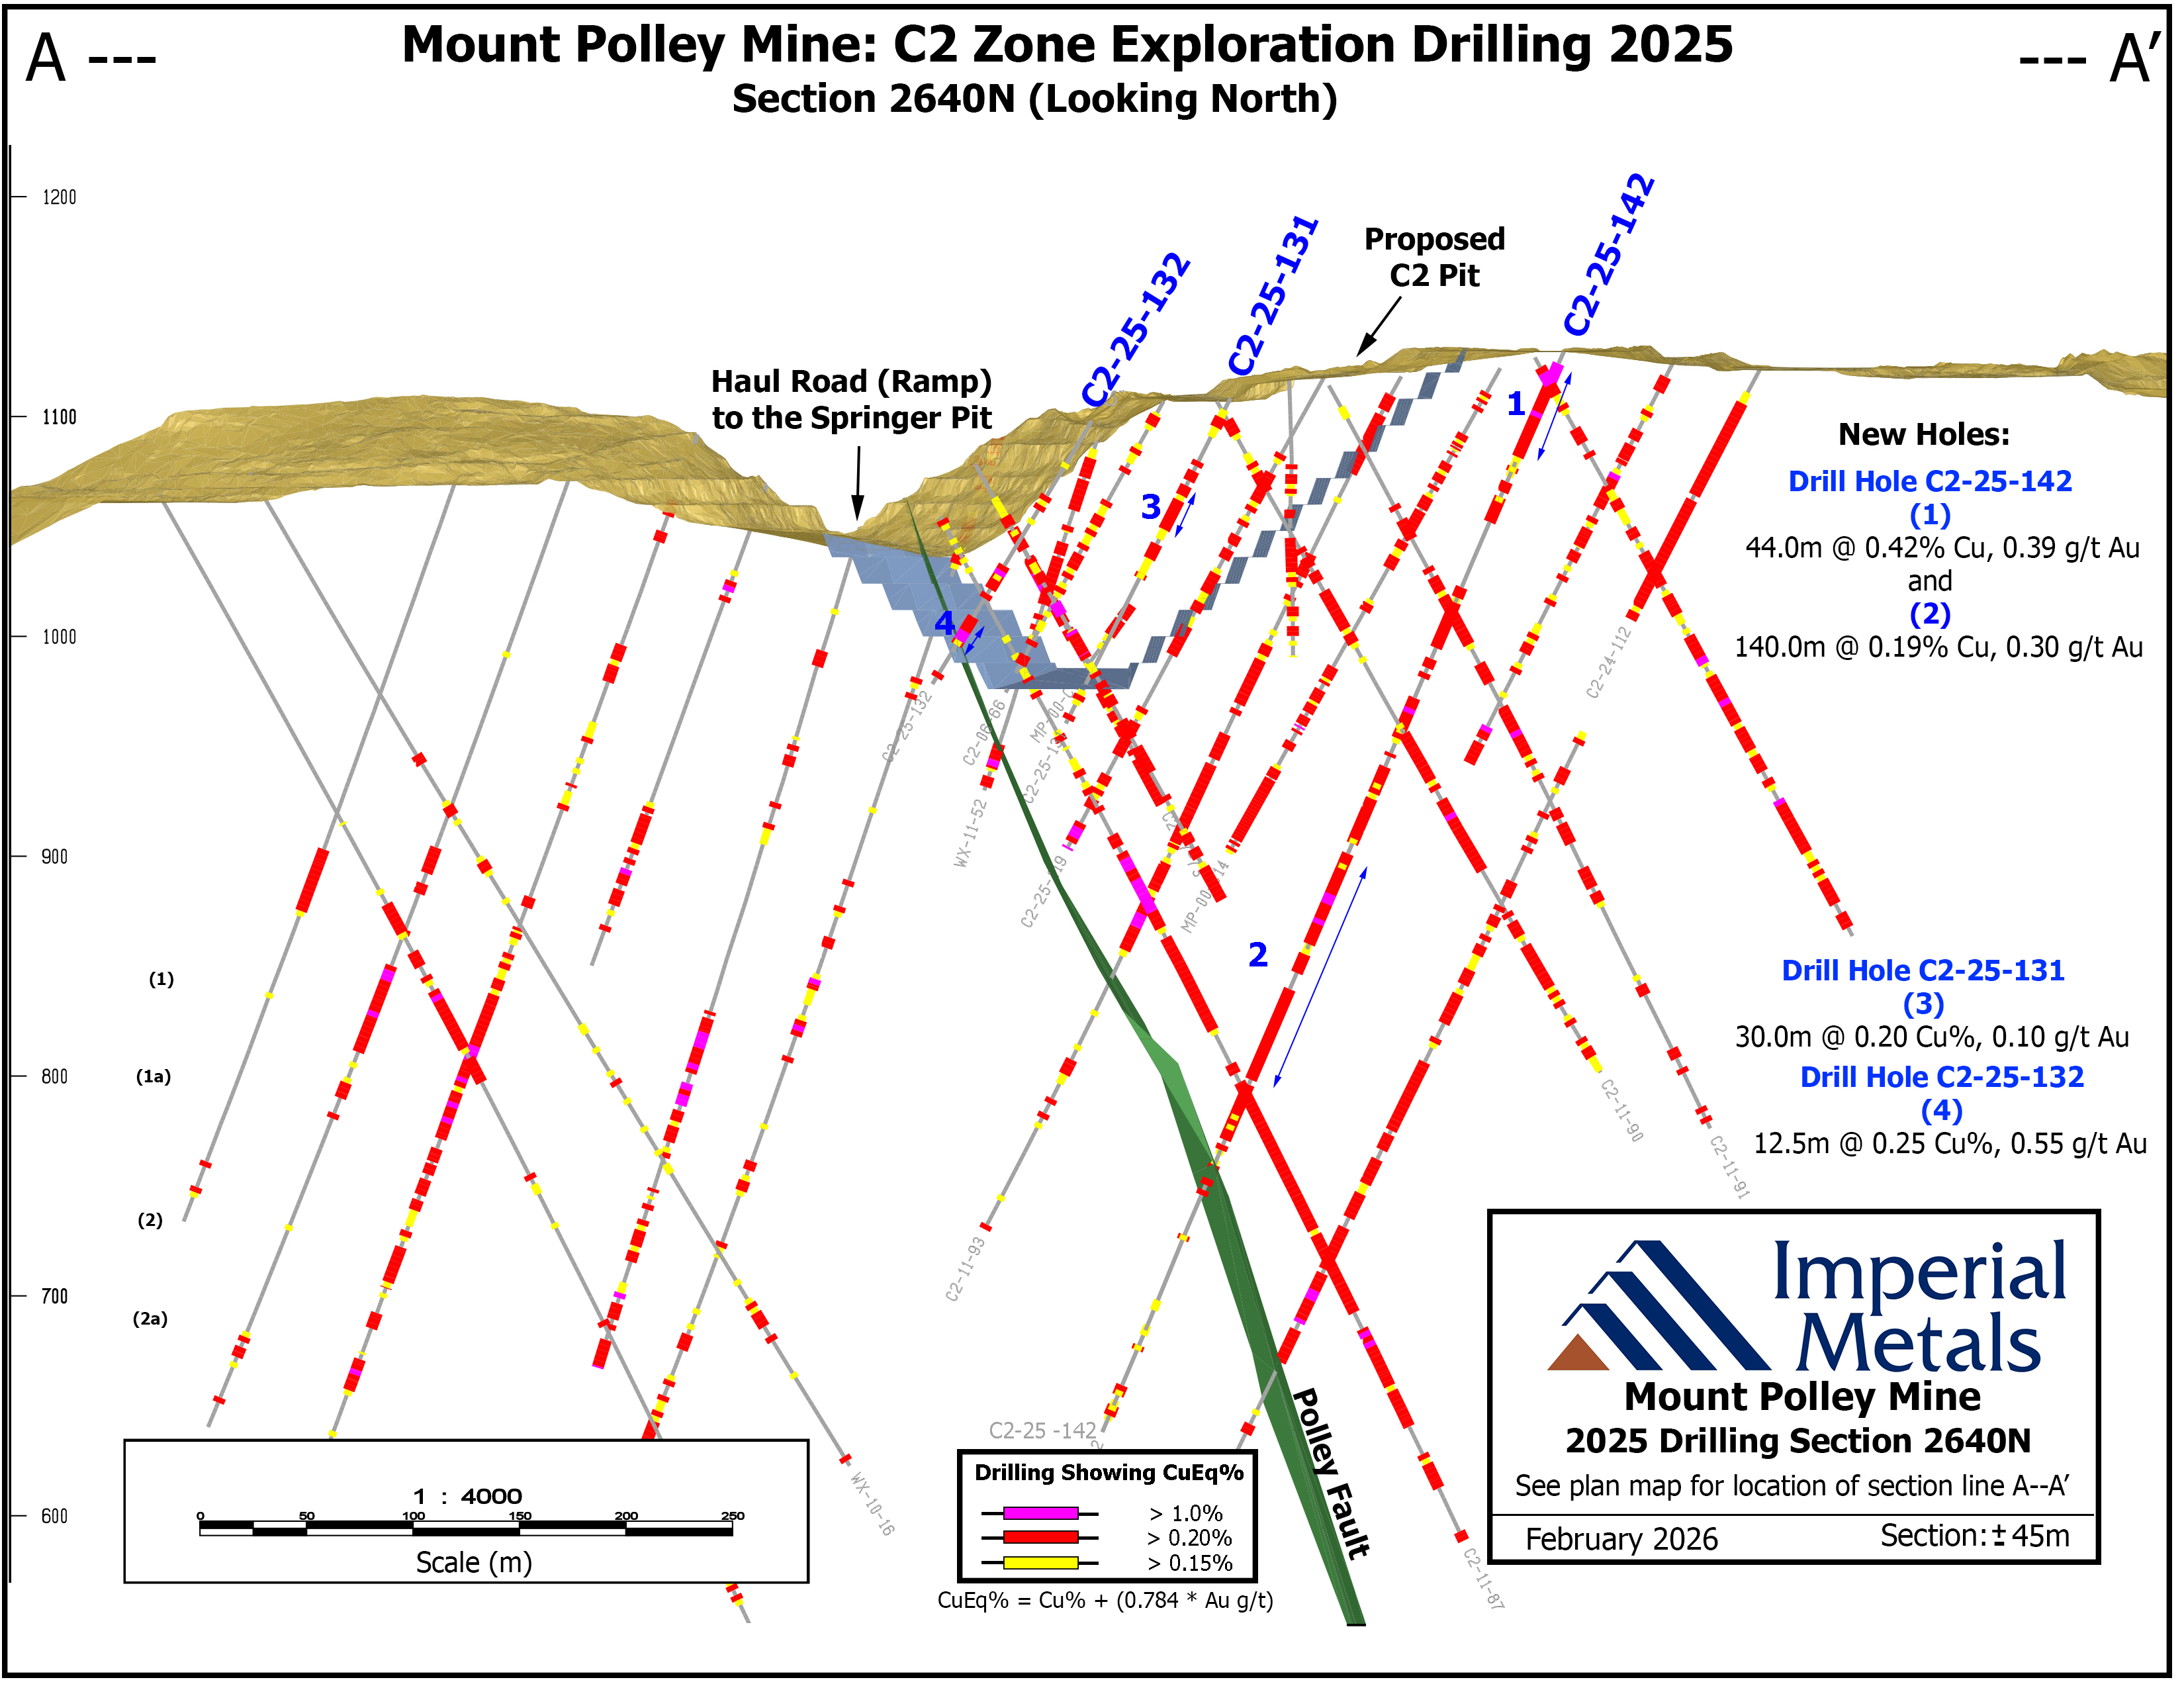
Figure 3 - Section B - B'.
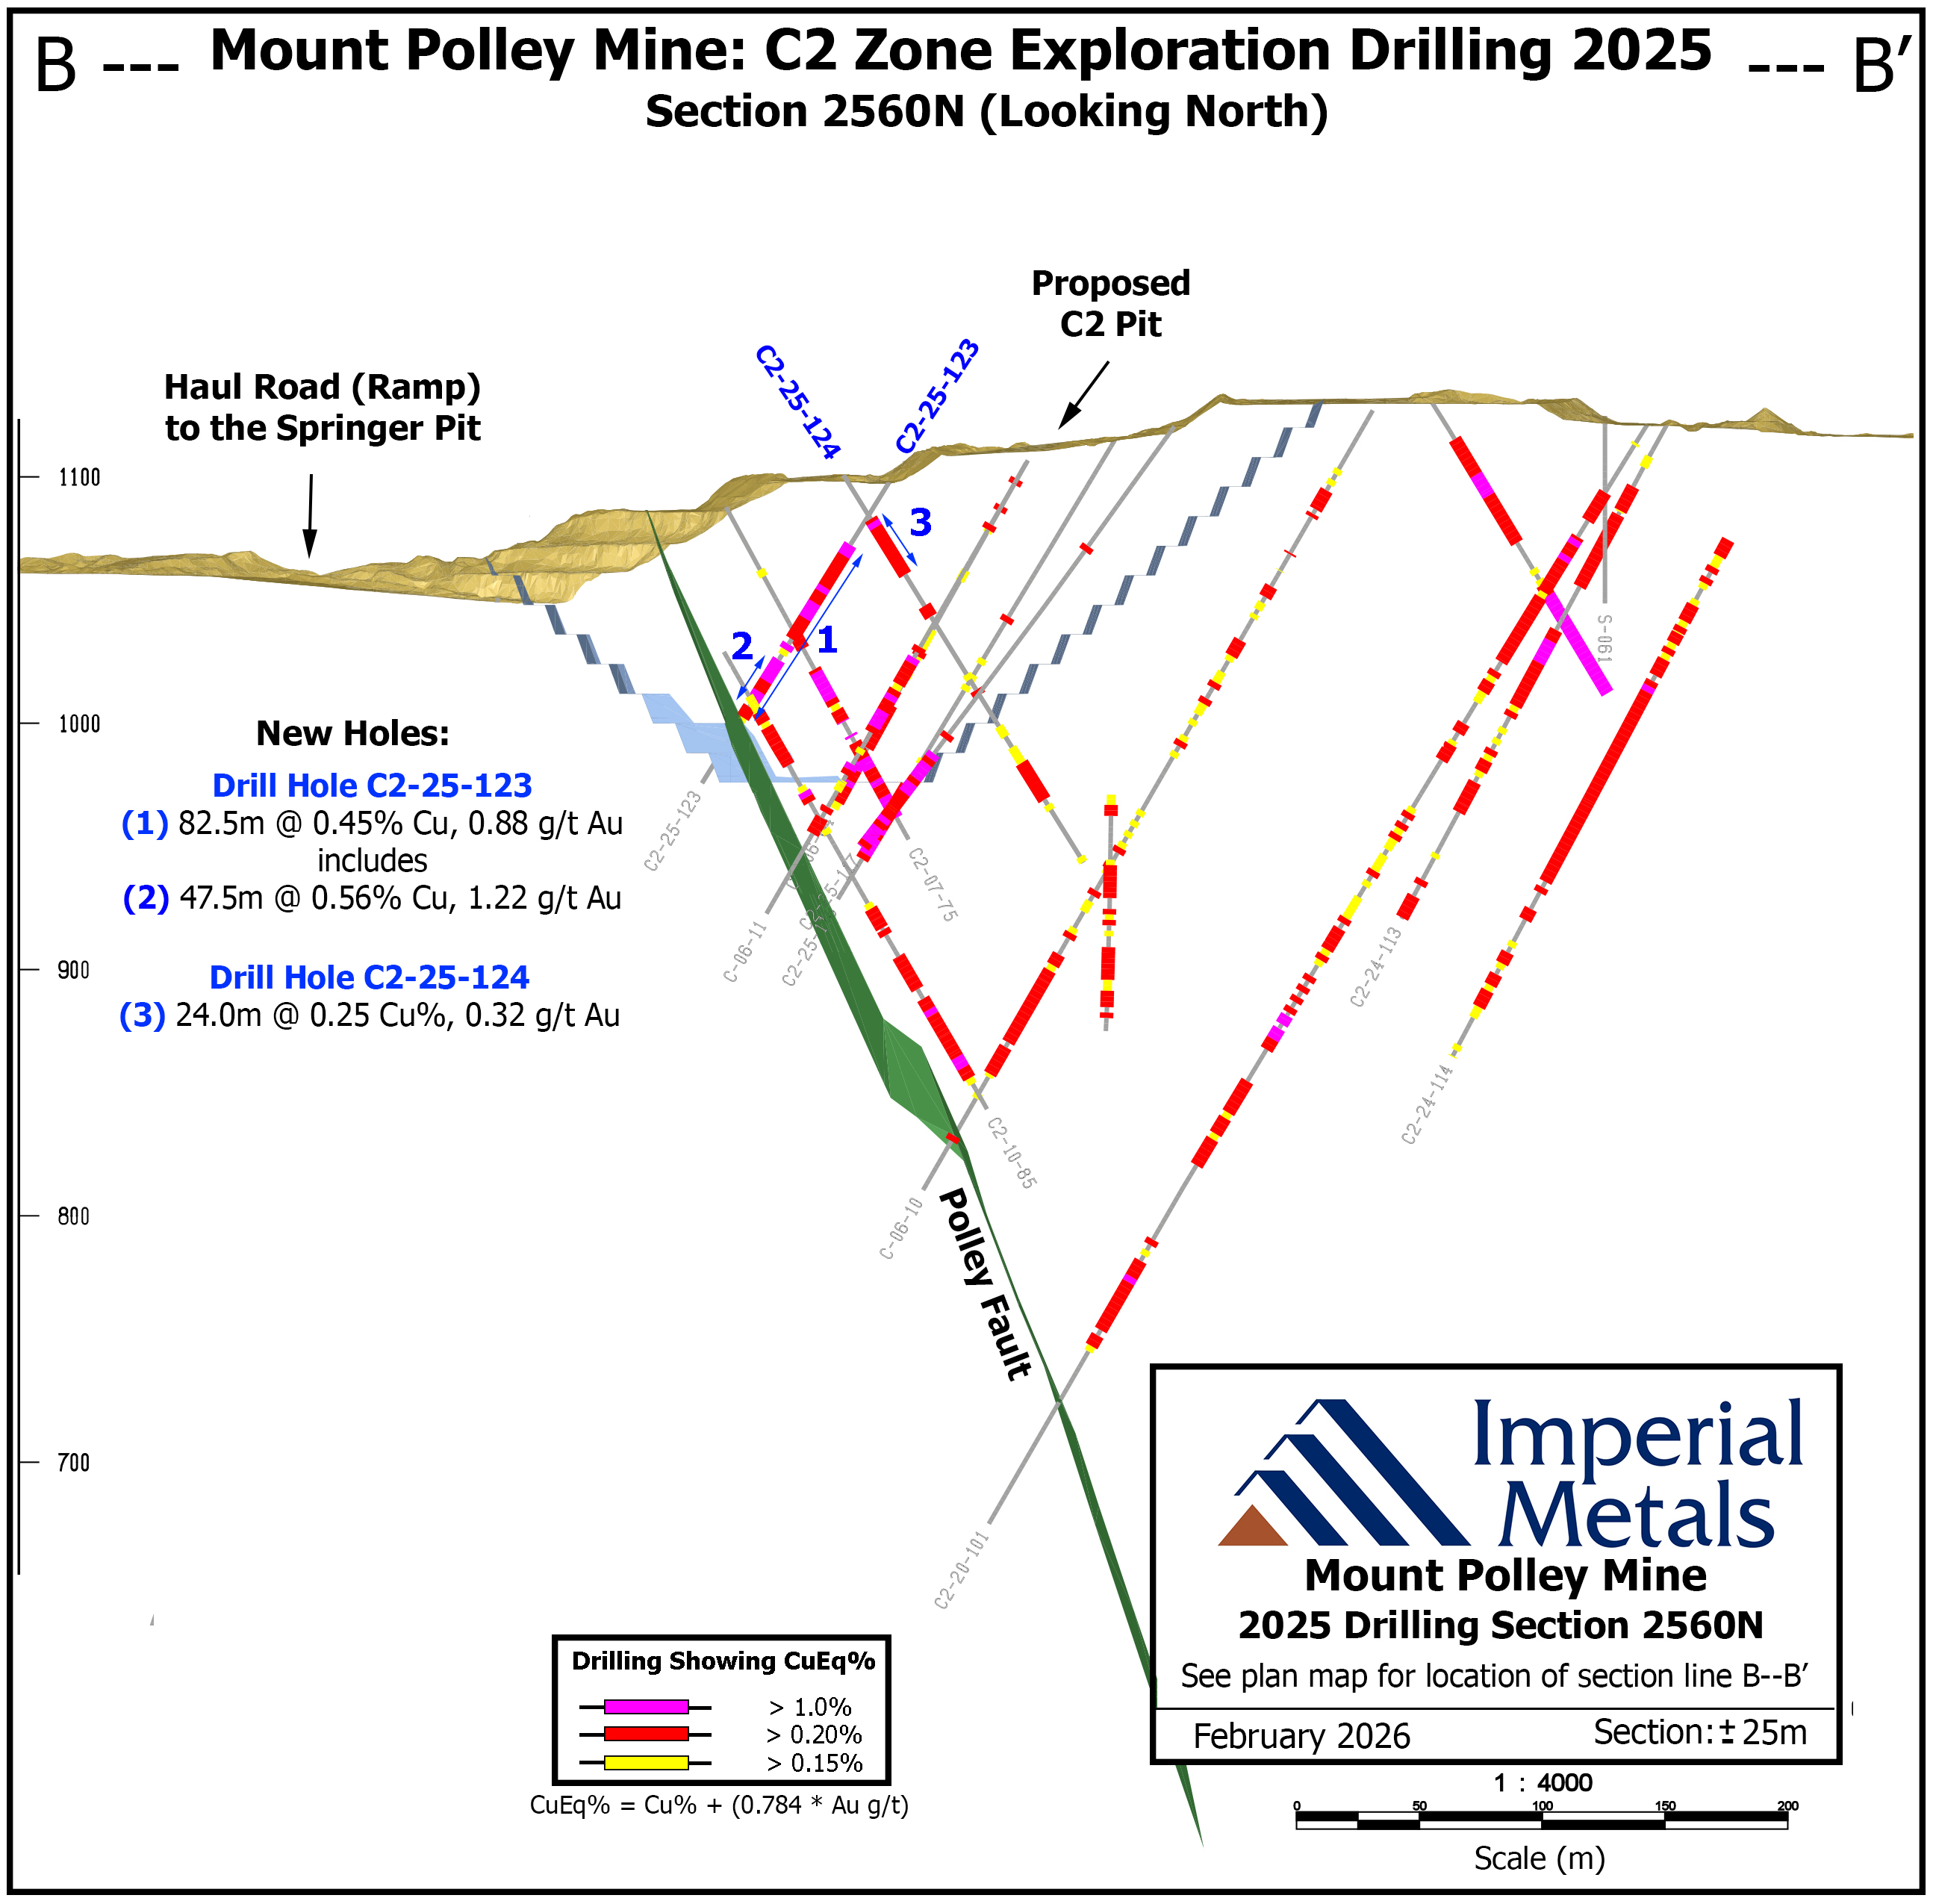
Table 2: Significant results from deep C2 zone drilling (See Figure 4, Section C - C').
| Hole ID | From (m) | To (m) | Width (m) | Cu (%) | Au (g/t) | |||||
| C2-25-126 | 292.5 | 312.5 | 20.0 | 0.29 | 0.44 | |||||
| And | 427.5 | 442.5 | 15.0 | 0.26 | 0.40 | |||||
| C2-25-138 | 277.5 | 355.0 | 77.5 | 0.49 | 0.82 | |||||
| including | 277.5 | 322.5 | 45.0 | 0.72 | 1.10 | |||||
| C2-25-140 | 222.5 | 230.0 | 7.5 | 0.40 | 1.29 | |||||
| And | 255.0 | 260.0 | 5.0 | 0.49 | 1.01 | |||||
| C2-25-141 | 302.5 | 437.5 | 135.0 | 0.35 | 0.53 | |||||
| including | 305.0 | 322.5 | 17.5 | 0.56 | 0.60 | |||||
| And | 373.7 | 402.5 | 28.8 | 0.74 | 1.24 | |||||
Figure 4 Section C - C'.

Two drill holes, BD-25-36 and BD-25-37, were collared east of the Bell Pit and oriented west, testing beneath the previously mined Bell Pit for depth extension. The two holes were both successful at extending the Bell mineralization deeper than previously tested. Hole BD-25-37 intersected 235.0 metres grading 0.22% copper and 0.27 g/t gold from a depth of 62.5 metres including 45.0 metres grading 0.35% copper and 0.51 g/t gold from a depth of 250.0 metres.
Table 3: Significant results from the Bell Zone drilling.
| Hole ID | From (m) | To (m) | Width (m) | Cu (%) | Au (g/t) | |||||
| BD-25-36 | 125.0 | 180.0 | 55.0 | 0.33 | 0.41 | |||||
| including | 150.0 | 167.5 | 17.5 | 0.69 | 0.75 | |||||
| and | 210.0 | 353.1 | 143.1 | 0.29 | 0.33 | |||||
| including | 290.9 | 353.1 | 62.2 | 0.37 | 0.50 | |||||
| BD-25-37 | 62.5 | 297.5 | 235.0 | 0.22 | 0.27 | |||||
| and | 250.0 | 295.0 | 45.0 | 0.35 | 0.51 | |||||
The next phase of diamond drilling is scheduled to start in February 2026 and will initially follow up on the successful results from the first drilling campaign in more than a decade in the Bell Pit area.
Steve Robertson, P.Geo., Imperial's Vice President Corporate Development has reviewed the production disclosures contained in this news release and is the designated Qualified Person as defined by National Instrument 43-101.
Jim Miller-Tait, P.Geo., Imperial's Vice President Exploration, has reviewed this news release as the designated Qualified Person as defined by National Instrument 43-101 for the Mount Polley exploration program. Samples reported were analyzed at Activation Laboratories Ltd. located in Kamloops. A full QA/QC program using blanks, standards and duplicates was completed for all diamond drilling samples submitted to the labs. Significant assay intervals reported represent apparent widths. Insufficient geological information is available to confirm the geological model and true width of significant assay intervals.
About Imperial
Imperial is a Vancouver based exploration, mine development and operating company with holdings that include the Mount Polley mine (100%), the Huckleberry mine (100%), and the Red Chris mine (30%). Imperial also holds a portfolio of 23 greenfield exploration properties in British Columbia.
Imperial Contacts
Brian Kynoch - President - 604.669.8959
Steve Robertson- VP Corporate Affairs - 604.669.8959
Jim Miller-Tait - VP Exploration - 604.669.8959
Cautionary Note Regarding Forward-Looking Statements
Certain information contained in this news release are not statements of historical fact and are "forward-looking" statements. Forward-looking statements relate to future events or future performance and reflect Imperial management's expectations or beliefs regarding future events and include, but are not limited to statements regarding expectations with respect to: the completion of mining of the Phase 4 pushback and continuation of stripping of the Phase 5 pushback at Mount Polley mine's Springer Pit; the source of the majority of Mount Polley's mill feed coming from the Phase 5 pushback with some supplementation derived from low grade stockpiles; Mount Polley mine's 2026 production targets; the release of production results from the Red Chris mine; and the next phase of Mount Polley mine's diamond drilling program starting in February 2026 to follow up on the recent drill results from the Bell pit area.
In certain cases, forward-looking statements can be identified by the use of words such as "plans", "expects" or "does not expect", "is expected", "is targeted", "targets", "outlook", "budget", "scheduled", "estimates", "forecasts", "intends", "anticipates" or "does not anticipate", or "believes", or variations of such words and phrases or statements that certain actions, events or results "may", "could", "would", "might" or "will be taken", "occur" or "be achieved" or the negative of these terms or comparable terminology. By their very nature forward-looking statements involve known and unknown risks, uncertainties and other factors which may cause the actual results, performance or achievements of Imperial to be materially different from any future results, performance or achievements expressed or implied by the forward-looking statements.
In making the forward-looking statements in this news release, Imperial has applied certain factors and assumptions that are based on information currently available to Imperial as well as Imperial's current beliefs and assumptions. These factors and assumptions and beliefs and assumptions include, the risk factors detailed from time to time in Imperial's interim and annual financial statements and management's discussion and analysis of those statements, and the Company's current Annual Information Form, all of which are filed and available for review on SEDAR+ at www.sedarplus.com. Although Imperial has attempted to identify important factors that could cause actual actions, events or results to differ materially from those described in forward-looking statements, there may be other factors that cause actions, events or results not to be as anticipated, estimated or intended, many of which are beyond Imperial's ability to control or predict. There can be no assurance that forward-looking statements will prove to be accurate, as actual results and future events could differ materially from those anticipated in such statements. Accordingly, readers should not place undue reliance on forward-looking statements and all forward-looking statements in this news release are qualified by these cautionary statements.
Photos accompanying this announcement are available at
https://www.globenewswire.com/NewsRoom/AttachmentNg/8b882f30-f5c2-4aee-b30a-1fc172b5b55e
https://www.globenewswire.com/NewsRoom/AttachmentNg/8d80b553-91fe-427b-ace8-01aee3fba973
https://www.globenewswire.com/NewsRoom/AttachmentNg/96299a3d-9e13-4007-974a-2e562f217256
https://www.globenewswire.com/NewsRoom/AttachmentNg/2f2c78d4-d461-48d9-b147-2eb212a6f480

