


- Hub and Spoke Mine Plan in Central Newfoundland: Three deposits, Hammerdown, Orion and Stog'er Tight, centered around the Company's Pine Cove Mill
- Robust Economics:
- After-tax NPV5%[1] of $199.2 M[2] using a base case scenario (variable price deck: long-term price of US$3,475/oz averaging US$3,656/oz Au[3])
- After-tax NPV5% of $415.1 M using an upside scenario (US$5,000/oz Au)
- Solid Production over an Extended Mine Life:
- 251,287 oz Au produced over a 13-year LOM[4]
- Average LOM total cash costs[5] and AISC[6] of US$2,149/oz Au and US$2,429/oz Au
- Total after-tax free cash flow[7] of $243.3 M
- Additional Value Potential from Exploration Upside:
- Deposits open laterally and to depth; additional target areas being evaluated
- Exploration planned to commence H2/26
All amounts in Canadian dollars unless stated otherwise
Toronto, Ontario--(Newsfile Corp. - February 26, 2026) - New Found Gold Corp. (TSXV: NFG) (NYSE American: NFGC) ("New Found Gold" or the "Company") is pleased to announce the results of a positive Preliminary Economic Assessment ("PEA") and updated mineral resource estimate ("MRE") for the Company's 100% owned Hammerdown Gold Project ("Hammerdown" or the "Project"), which includes the Hammerdown deposit, Orion deposit and Stog'er Tight deposit (collectively, the "Deposits") and the Pine Cove Mill ("Pine Cove" or the "Mill"), located in Newfoundland and Labrador, Canada. The Deposits are evaluated with a Hub and Spokes model centred around Pine Cove, with the Hammerdown deposit currently being ramped up to commercial production.
"Today's updated mineral resource and life of mine plan for Hammerdown demonstrates cashflow generation from operations which will offset overhead and exploration costs as we continue to fast-track our flagship Queensway Gold Project towards production in H2/27, taking full advantage of the tremendous synergies through our strategic purchase of Pine Cove and the Nugget Pond gold circuit. This purchase accelerates the development of Queensway by two to three years, coinciding with this exciting gold market," commented Keith Boyle, Chief Executive Officer.
"Our team has a demonstrated track record of exploration success in the discovery of orogenic gold deposits in central Newfoundland. With the completion of the Maritime Resources Corp. acquisition just over three months ago, we have commenced evaluation of the exploration upside of the Project. As part of our Hub and Spoke strategy, the mine plan brings in additional resources with the inclusion of the Orion and Stog'er Tight deposits, which were not contemplated in previous mine plans. We look forward to commencing exploration work on our new landholdings later this year," continued Mr. Boyle.
[1] NPV5% = net present value at a 5 percent discount rate.
[2] M = million.
[3] oz Au = ounces of gold; Base case gold price US$4,132 in Year 1, US$4,000 in Year 2, US$3,775 in Year 3, US$3,600 in Year 4 and 5 and US$3,475 thereafter.
[4] LOM = life-of-mine.
[5] Cash cost is a Non-GAAP measure; See notes below for additional information regarding cash costs.
[6] AISC = all in sustaining costs; Note AISC is a Non-GAAP measure; See notes below for additional information regarding AISC.
[7] Free cash flow is a Non-GAAP measure; See notes below for additional information regarding free cash flow.
Project Overview
Hammerdown includes the Company's 100% owned Hammerdown property and Pine Cove property (Figure 1). The Hammerdown property includes the Hammerdown deposit and the Orion deposit; the Pine Cove property includes the Stog'er Tight deposit and Pine Cove, a fully permitted processing plant and tailings facility.
The Hammerdown deposit is an open-pit mining deposit with first gold pour in November 2025 and is currently ramping up gold production. Hammerdown is located in the north-central portion of the island of Newfoundland in the Province of Newfoundland and Labrador ("NL") on the east coast of Canada. The Hammerdown and Orion deposits are located approximately 95 kilometres ("km") by road from Pine Cove, which includes a fully permitted and operating processing plant and tailings facility. Commercial production at the Hammerdown deposit is expected to be achieved in H2/26. The Stog'er Tight deposit is located on the Pine Cove property, 4 km east of Pine Cove. The Company's 100% owned flagship Queensway Gold Project ("Queensway") is located approximately 270 km by road from Pine Cove and approximately 15 km west of the town of Gander.
Key Outcomes of the PEA:
- The PEA has returned an after-tax NPV5% of $199.2 M at the base case gold price (variable price deck: long-term price of US$3,475/oz averaging US$3,656/oz Au) and an after-tax NPV5% of $415.1 M at the upside gold price of US$5,000 (Table 1),
- Over a 13-year period, the total mill feed throughput is expected to be 3.2 million tonnes ("Mt"), with an average mined grade of 2.19 grams of gold per tonne ("g/t Au"), a post-sorting mill feed head grade of 2.89 g/t Au and average annual gold production of approximately 19.3 thousand ounces ("koz") of gold per annum (Figure 2),
- Average LOM cash costs and AISC of US$2,149/oz and US$2,429/oz, respectively,
- Total capital costs (with contingency) are estimated at $24.3 M and reclamation, and closure costs are estimated at $18.0 M,
- The PEA mine plan was developed from Measured and Indicated Mineral Resources of 3,328 kt grading 2.43 grams per tonne ("g/t") gold containing 260,000 ounces of gold and Inferred Mineral Resources of 2,132 kt grading 2.34 g/t gold containing 161,000 ounces of gold.
LOM Plan:
- 13-year open pit project commencing in 2026, including one year of stockpile rehandling in 2038 (Figure 2),
- Continuation of the conventional open pit truck-and-shovel operation executed by a mining contractor, as currently underway at the Hammerdown deposit,
- Process plant feed rate of 700 tonnes per day ("tpd") with the addition of sorting at the Hammerdown and Orion deposits,
- Hammerdown deposit pit mined in multiple phases, followed by the Orion deposit pit and four Stog'er Tight deposit pits sequentially,
- The Hammerdown deposit accounts for 75% of mineralized material mined (82% of recovered gold), with mining taking place in this zone from year 1 to year 10 and the Orion and Stog'er Tight deposits account for 25% of mineralized material mined (18% of recovered gold), which will be mined from year 8 to year 12,
- The average material mined, consisting of mineralized material, waste rock and overburden, is 12,300 tpd during the LOM, ranging between 11,800 tpd and 18,400 tpd from year 1 to year 6 and between 2,500 tpd and 13,700 tpd from year 7 to year 12,
- The average strip ratio over the LOM is 11.4, with total material mined of 54.1 Mt including 4.4 Mt of mineralized material at an average grade of 2.19 g/t Au,
- With sorting, a total of 3.2 Mt of mineralized material at an average grade of 2.89 g/t Au will be processed with total gold recovery of 251.3 koz of gold;
- Process plant average gold recovery for the zones being mined from year 1 to year 4 is estimated to be 87.2% and 84.3% thereafter, with LOM average gold recovery of 85.5%.
Table 1: Hammerdown Gold Project PEA Summary: Key Metrics and Project Economics.
| Production1 | 2026 PEA | Units |
| LOM | 13 | years |
| Total Potential Mill Feed Tonnage | 3,159 | kt |
| Average Mined Grade | 2.19 | g/t Au |
| Mill Feed Head Grade (Post-Sorting) | 2.89 | g/t Au |
| Cut-off Grade (Range Depending on Deposit) | 0.41-0.56 | g/t Au |
| Process Plant Average Gold Recovery | 85.5 | % |
| Contained Gold | 306.6 | koz |
| Recovered Gold | 251.3 | koz |
| Average Annual Gold Production | 19.3 | koz/yr |
| Average Mineralized Material Mining Rate (Post Sorting) | 700 | tpd |
| Strip Ratio | 11.4:1 | waste:ore |
| Operating & Capital Costs1 | ||
| Total Operating Costs1,2 | 725.9 | $M |
| Sustaining Capital Costs (with contingency) | 97.7 | $M |
| Total Capital Costs (with Contingency) | 24.3 | $M |
| Reclamation and Closure Capital | 18.0 | $M |
| Royalty NSR | 17.4 | $M |
| Total Cash Cost | 2,149 | US$/oz Au |
| AISC (LOM) | 2,429 | US$/oz Au |
| Financial Summary | ||
| Gold Price (Average LOM Base Case) | 3,656 | US$/oz Au |
| Exchange Rate | 1.39 | C$/US$ |
| Discount Rate | 5 | % |
| Pre-Tax NPV5% (Base Case Gold Price: US$3,656 average LOM) | 318.5 | $M |
| After-Tax NPV5% (Base Case Gold Price: US$3,656 average LOM) | 199.2 | $M |
| Pre-Tax NPV5% (Upside Gold Price: US$5,000) | 680.8 | $M |
| After-Tax NPV5% (Upside Case Gold Price: US$5,000) | 415.1 | $M |
| Internal Rate of Return | N/A | - |
| Payback Period | N/A | - |
Notes:
1 Denotes a "specified financial measure" within the meaning of National Instrument 52-112 - non-GAAP and Other Financial Measures Disclosure. See note on "Non-IFRS Financial Measures".
2 Total operating costs refer to onsite charges that cover open pit mining, processing and material handling, and onsite general and administrative costs.
3 AISC is calculated as the sum of doré transportation, treatment and refining charges, royalties, onsite operating costs, and sustaining capital costs, divided by the quantity of ounces sold.
The PEA is preliminary in nature, it includes Inferred Mineral Resources that are considered too speculative geologically to have economic considerations applied to them that would enable them to be categorized as Mineral Reserves, and there is no certainty that the PEA will be realized. No Mineral Reserves are defined for the Project.
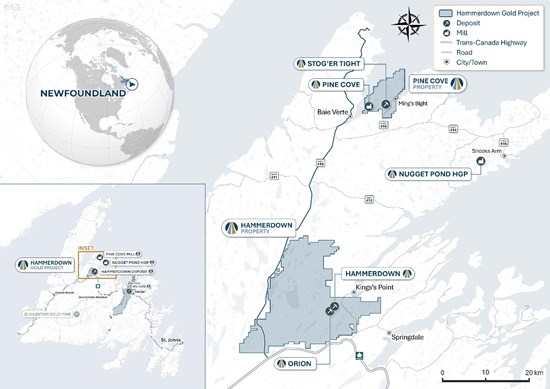
Figure 1: Hammerdown Gold Project: Location Map.
To view an enhanced version of this graphic, please visit:
https://images.newsfilecorp.com/files/7337/285504_5cc229df2479f9df_001full.jpg
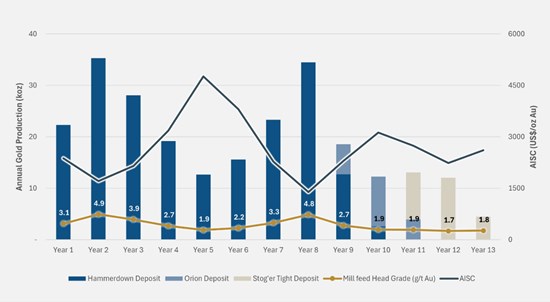
Figure 2: Hammerdown Gold Project: Gold Production by Year with Mill Feed Head Grade and AISC.
To view an enhanced version of this graphic, please visit:
https://images.newsfilecorp.com/files/7337/285504_5cc229df2479f9df_002full.jpg
Mineral Resource Estimate
Mineral Resources are reported for the Hammerdown, Orion, and Stog'er Tight deposits, which are planned to share Pine Cove. Measured and Indicated Mineral Resources ("M&I") for the projects combined total 3.328 Mt at an average gold grade of 2.43 g/t Au for 260,000 contained ounces of gold. Inferred Mineral Resources total 2.132 Mt at an average grade of 2.34 g/t Au for 161,000 ounces of gold (Table 2).
Table 2: Hammerdown Gold Project Consolidated MRE (effective date January 22, 2026)12.
| Property | Deposit | Mining Method | Category | Tonnage (kt) | Grade (g/t Au) | Contained Oz (koz)3 |
| Hammerdown | Hammerdown | Open Pit | Measured | 271 | 8.24 | 72 |
| Indicated | 1,823 | 1.96 | 115 | |||
| Measured & Indicated | 2,094 | 2.77 | 187 | |||
| Inferred | 973 | 2.59 | 81 | |||
| Hammerdown | Orion | Open Pit | Indicated | 598 | 1.75 | 33.6 |
| Inferred | 91 | 1.92 | 5.6 | |||
| Underground | Indicated | 636 | 1.92 | 39.3 | ||
| Inferred | 523 | 2.16 | 36.2 | |||
| Pine Cove | Stog'er Tight | Open Pit | Inferred | 545 | 2.16 | 37.8 |
| Total | ||||||
| Measured | 271 | 8.24 | 72 | |||
| Indicated | 3,057 | 1.91 | 188 | |||
| Measured & Indicated | 3,328 | 2.43 | 260 | |||
| Inferred | 2,132 | 2.34 | 161 | |||
Notes:
1 Refer to the Appendix to see MRE notes and data verification for each deposit.
2 The mineral resource database was closed on June 16, 2025, and contains 93,818 metres ("m") of drilling in 1,108 diamond drill holes ("DDH") and 310 m in 86 channels at Hammerdown, 46,017.34 m of drilling in 219 DDH at the Orion deposit and 35,246.42 m of drilling in 523 DDH at the Stog'er Tight deposit that were used to inform the MRE presented. The Qualified Person ("QP"), as defined by National Instrument 43-101 - Standards of Disclosure of Mineral Projects ("NI 43-101"), responsible for the MRE were Christian Beaulieu of Mineralis Consulting Services Inc. for the Hammerdown deposit, Chafana Sako of Norda Stelo Inc. for the Orion and Stog'er Tight deposits, and Stephen Coates of Evomine Consulting Inc. for constraining volumes on all deposits.
3 Numbers may not total due to rounding.
Comparison of PEA Relative to 2022 Feasibility Study
The following section provides a comparison of the updated Mineral Resources reported herein to the technical report titled "Feasibility Study Technical Report: Hammerdown Gold Project, Newfoundland" with an effective date of August 15, 2022, prepared by JDS Energy and Mining Inc. for Maritime Resources Corp. (the "2022 Feasibility Study", Table 3).
Changes to the Hammerdown deposit MRE in the 2022 Feasibility Study primarily reflect the application of new estimation parameters informed by increased data confidence from the tightly spaced grade control drilling completed in 2024 and 2025. Specifically, tighter distance constraints were applied to high grade intervals, which affected overall grade and ultimately reduced it relative to the previous estimate. Additional changes include an increase in resources classified as inferred due to missing data validation needed to confirm the positions of historically mined out underground stopes. New optimization parameters also contribute to loss in contained ounces, as well as additional depletion of historically mined stopes. The methodology used to report the MRE in a narrow-vein environment also contributes to lower grades as more waste is accounted for as must-take material. Adjusted cut-off grades and the reporting methodology contributed to the increase in contained metal. The Orion and Stog'er Tight deposits were not included in the 2022 Feasibility Study.
Table 3: Hammerdown Gold Project Consolidated MRE Compared to 2022 Feasibility Study3.
| 2026 PEA1, 4 | 2022 Feasibility Study (open pit only)2, 3 | |||||
| Resource Category | Tonnage (kt) | Grade (g/t Au) | Contained Oz (koz) | Tonnage (kt) | Grade (g/t Au) | Contained Oz (koz) |
| Measured | 271 | 8.24 | 72 | 698 | 5.47 | 123 |
| Indicated | 3,057 | 1.91 | 188 | 2146 | 3.00 | 207 |
| Measured & Indicated | 3,328 | 2.43 | 260 | 2845 | 3.61 | 330 |
| Inferred | 2,132 | 2.34 | 161 | 302 | 1.31 | 13 |
Notes:
1 Using a cut-off grade of 0.35 g/t Au for Hammerdown (excluding Wisteria), 0.48 g/t Au for Hammerdown Wisteria area, 0.47 g/t Au for Orion open pit, 1.13 g/t Au for Orion underground and 0.42 g/t Au for Stog'er Tight open pit.
2 2022 Feasibility Study, with an effective date of August 15, 2022, prepared by JDS Energy and Mining Inc. for Maritime Resources Corp.
3 The Orion and Stog'er Tight deposits were not included in the 2022 Feasibility Study.
4 Refer to the Appendix for additional MRE notes.
Mining
The PEA contemplates open pit mining from the Hammerdown, Orion and Stog'er Tight deposits, designed as conventional truck and shovel open pit operations operated by a contractor. Run of mine ("ROM") mineable material from the Hammerdown and Orion deposits will be sent to the on-site crushing and sorting plant to produce mill feed that will be hauled to Pine Cove for final processing. A total of 4,354 Mt of ROM mineable material is scheduled to be mined from all open pits with a diluted grade averaging 2.19 g/t Au. A total of 48.0 Mt of non-acid generating waste rock will also be produced and stored in a waste rock stockpile adjacent to the open pits. The open pits have been designed and scheduled to maximize project NPV. Pit slope optimization has been undertaken based on geotechnical data collected between 2020 and 2021. The Hammerdown deposit's open pit development consists of two phases of pushbacks with overburden thickness averaging less than 2 m.
Mining will be completed by conventional drilling, blasting, loading and hauling on 4 m benches in mineralized material and 8 m benches in waste where practical at the Hammerdown deposit and 5 m benches at the Orion and Stog'er Tight deposits. Waste loading and haulage will be handled by 3 m3 hydraulic excavators and 41-tonne payload articulated haul trucks. Mineralized material loading and hauling will be handled by a fleet of 2 m3 hydraulic excavators with a 7 m3 front end loader as backup and 38 tonne payload articulated haul trucks.
Grade control in the open pit is a key part of the mining process and will be accomplished through a combination of 4 to 5 m bench heights with 2 m flitches, controlled blasting, 50,000 m of close spaced diamond drilling (15 m centres, 10 m vertically) to identify and report vein orientations and grades to the mine planners, selective excavation under GPS control, and mine geological control. The sorting process is integrated to remove dilution taken with the narrow veins during the mining process.
Processing and Recovery
Pine Cove was commissioned on low grade stockpiles in 2025 and commenced processing Hammerdown deposit mineable material in Q4/25.
The mineralized material from the Hammerdown, Orion and Stog'er Tight deposits will be processed at Pine Cove, a fully permitted processing plant and in-pit tailings facility. Mineable material from the three deposits will be trucked to the Mill and processed at a nominal rate of 700 tpd. The flowsheet consists of a ball mill and flotation circuit that produces a gold-pyrite concentrate, cyanide leach, filtration and Merrill Crowe gold recovery circuit.
The process plant average gold recovery for the zones being mined from year 1 to year 4 is estimated to be 87.2% and 84.3% thereafter, with LOM average gold recovery of 85.5%.
The Company has recently purchased a sorter which it plans to commission in H2/26. Sorting at the Hammerdown deposit is expected to commence in 2027, at the Orion deposit in 2033 and once commenced, continue over the LOM at these two deposits.
Additional Value Potential from Exploration Upside
Hammerdown hosts multiple gold-bearing trends with potential for resource growth and new discovery over the 44,650 hectare land package. To date, only limited near surface work has been completed across large portions of the land holdings, yet the Project presents a broad pipeline of early- to advanced-stage exploration targets. Near resource expansion opportunities remain strong at the Hammerdown, Orion, and Stog'er Tight deposits, where drilling to date has largely been confined to the upper 220 m with minimal lateral testing along key structural corridors (Figure 3). The limited deeper testing that has been completed to date has intersected mineralisation at vertical depths of up to 400 m at the Orion deposit, highlighting the opportunity for continued resource growth at depth.
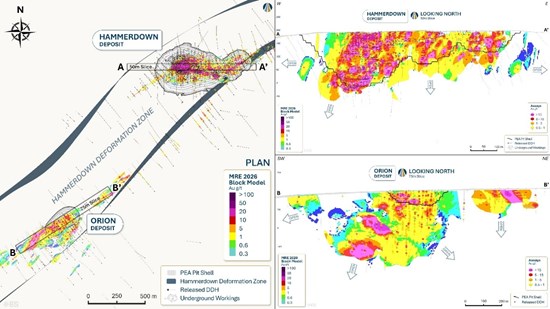
Figure 3: Hammerdown Gold Project: Hammerdown and Orion Deposit Longitudinal Sections.
To view an enhanced version of this graphic, please visit:
https://images.newsfilecorp.com/files/7337/285504_5cc229df2479f9df_003full.jpg
Looking ahead, the Company plans to advance step out drilling around existing mineral resources while evaluating high priority regional targets along prospective trends, including the Hammerdown Deformation Zone, Whisker Valley, El Strato, Scrape, Goldenville, and Deer Cove (Figure 4).
In 2026, exploration activities will emphasize comprehensive data compilation, geological interpretation, and systematic targeting to support a long-term discovery strategy and inform well-designed programs for 2027 and beyond.
Concurrently, drilling is scheduled to begin in H1/26 to derisk the deeper portions of the Hammerdown deposit mine plan. Regional initiatives will focus on building foundational datasets, including property wide geophysics, reconnaissance soil sampling, and prospecting, to guide future exploration and enhance the geological understanding across the broader land package.
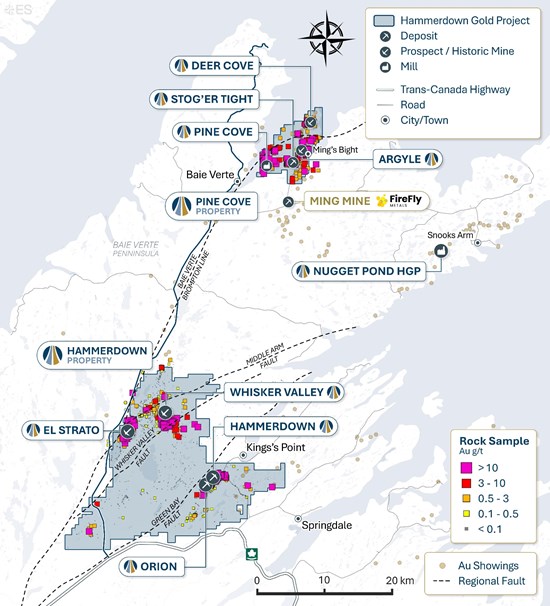
Figure 4. Hammerdown Gold Project: Exploration Potential.
To view an enhanced version of this graphic, please visit:
https://images.newsfilecorp.com/files/7337/285504_5cc229df2479f9df_004full.jpg
Qualified Persons and Technical Information
The PEA was prepared by consultants who are independent of New Found Gold, each of whom are QPs as defined by NI 43-101. Each of the QPs have reviewed and confirmed that this news release fairly and accurately reflects, in the form and context in which it appears, the information contained in the respective sections of the PEA for which they are responsible. The following acted as QPs under NI 43-101 as authors of the PEA:
William Richard McBride, P.Eng., WSP Canada Inc., responsible for Introduction, Market Studies and Contracts, compiling of Capital and Operating Costs, Economic Analysis.
Dachun (David) Jin, P.Eng., WSP Canada Inc., responsible for Project Infrastructure, Electrical and Water Management Capital Costs.
Stephen Coates, P.Eng., Evomine Consulting Inc., responsible for Mineral Reserve Estimate, Mining Methods, Project Infrastructure, Subsection for haul roads and stockpiles, LOM Plan, Mining Capital and Operating Costs.
Christian Beaulieu, P.Geo., Minéralis Consulting Services Inc., responsible for Property Description and Location, Accessibility, Climate, Local Resources, Infrastructure, and Physiography, History, Geological Setting and Mineralization (Hammerdown deposit), Deposit Types (Hammerdown deposit) Exploration (Hammerdown deposit), Drilling (Hammerdown deposit), Sample Preparation, Analyses, and Security (Hammerdown deposit), Data Verification (Hammerdown deposit only), Mineral Resource Estimate (Hammerdown deposit), Adjacent Properties.
Michael Levy, P.Eng., JDS Energy & Mining Inc. responsible for Geotechnical Analysis and Slope Design Parameters for Hammerdown, Orion and Stog'er Tight deposits open pits.
Chafana Hamed Sako, P.Geo., Norda Stelo Inc., responsible for Geological Setting and Mineralization (Orion deposit), Deposit Types (Orion deposit), Exploration (Orion deposit), Drilling (Orion deposit), Sample Preparation, Analyses, and Security (Orion deposit), Data Verification (Orion deposit), Mineral Resource Estimate (Orion and Stog'er Tight deposits).
James Guiraud, P.Geo., Norda Stelo Inc., responsible for Geological Setting and Mineralization (Stog'er Tight deposit), Deposit Types (Stog'er Tight deposit), Exploration (Stog'er Tight deposit), Drilling (Stog'er Tight deposit), Sample Preparation, Analyses, and Security (Stog'er Tight deposit), Data Verification (Stog'er Tight deposit).
Stacy J. Freudigmann, P.Eng., Canenco Consulting Corp., responsible for Mineral Processing and Metallurgical Testing, Recovery Methods , Sorting and Crushing Plant Capital and Operating Costs.
Sheldon H. Smith, P.Geo., Stantec Consulting Ltd., responsible for Property Description and Location - Subsection for environmental risks and liabilities, Mining Methods - Subsection for hydrogeology and geochemistry, Environmental Studies, Permitting, and Social or Community Impact, Closure Costs.
J. Alex Mcintyre, P.Eng., Knight Piesold Ltd., responsible for Project Infrastructure - Subsection for tailings, Environmental Studies, Permitting, and Social or Community Impact - Subsection for closure, TSF Operating Costs.
Neil J. Lincoln, P.Eng., Lincoln Metallurgical, Inc., responsible for Recovery Methods - input, Mill Capital and Operating Costs, general and administrative ("G&A") costs, Haulage.
Mr. Keith Boyle, P.Eng., CEO of New Found Gold, is the Company's QP under NI 43-101 and has reviewed and assumes responsibility for the scientific and technical content in this press release.
Technical Report
The complete NI 43-101 Technical Report pertaining to the PEA (the "Technical Report") will be filed within 45 days and will be available on the New Found Gold website, on SEDAR+ (www.sedarplus.ca) and on EDGAR (www.sec.gov/edgar).
About New Found Gold Corp.
New Found Gold is an emerging Canadian gold producer with assets in Newfoundland and Labrador, Canada. The Company holds a 100% interest in Queensway and Hammerdown, which includes fully permitted milling and tailings facilities. The Company is currently focused on advancing its flagship Queensway to production and bringing the Hammerdown deposit into commercial gold production.
In July 2025, the Company completed a PEA at Queensway (see New Found Gold press release dated July 21, 2025). Recent drilling continues to yield new discoveries along strike and down dip of known gold zones, pointing to the district-scale potential that covers a +110 km strike extent along two prospective fault zones at Queensway.
Through 2025 New Found Gold built a new board of directors and management team and has a solid shareholder base which includes cornerstone investor Eric Sprott. The Company is focused on growth and value creation.
Keith Boyle, P.Eng.
Chief Executive Officer
New Found Gold Corp.
Contact
For further information on New Found Gold contact us through our investor inquiry form at https://newfoundgold.ca/contact/ or contact:
Fiona Childe, Ph.D., P.Geo.
Vice President, Communications and Corporate Development
Phone: +1 (416) 910-4653
Email: contact@newfoundgold.ca
Follow us on social media at https://www.linkedin.com/company/newfound-gold-corp and https://x.com/newfoundgold.
Neither the TSX Venture Exchange nor its Regulation Services Provider (as that term is defined in the policies of the TSX Venture Exchange) accepts responsibility for the adequacy or accuracy of this release.
Appendix
Hammerdown Deposit MRE
The mineralized domains at the Hammerdown deposit were modeled by using drillhole assay data in Leapfrog Geo ("Leapfrog") and categorized as either vein-hosted or disseminated mineralization. Vein-hosted zones (Hammerdown, Muddy Shag and Rumbullion areas) were modeled using a nominal 0.50 g/t Au cut-off and capture discrete high-grade veins within broader deformation corridors. Disseminated mineralization (Wisteria area) was modeled using a 0.35 g/t Au cut-off to define broader, lower-grade zones.
The following updated Hammerdown deposit MRE is effective as of January 22, 2026 and incorporates 93,818 m of drilling in 1,108 DDH and 310 m in 86 channels (Table 4).
Table 4: Hammerdown Deposit Updated MRE (effective date January 22, 2026).
| Deposit | Mining Method | Category | Tonnage (kt) | Grade (g/t Au) | Contained Oz (koz) |
| Hammerdown1 | Open Pit | Measured | 271 | 8.24 | 72 |
| Indicated | 1,823 | 1.96 | 115 | ||
| Total Measured & Indicated | 2,094 | 2.77 | 187 | ||
| Inferred | 973 | 2.59 | 81 |
Hammerdown MRE Notes:
- The Mineral Resources described above have been prepared in accordance with the CIM Standards (Canadian Institute of Mining, Metallurgy and Petroleum, 2014).
- The effective date of the MRE is January 22nd, 2026 with a database cut-off date of June 16, 2025 and using a depletion surface of December 31st, 2025 .
- The lower cut-offs used to report open pit Mineral Resources are 0.48 g/t Au for the Wisteria area and 0.35 g/t Au for all other areas within the Hammerdown deposit pit optimization.
- The Hammerdown deposit has been classified as Measured, Indicated and Inferred Mineral Resources according to drill spacing and confidence in the historical stope placement.
- Bulk density was assigned based on historical and recent specific gravity measurements. A single value of 2.81 g/cm3 was used, and 1.9 g/cm3 for backfill material within historical stopes.
- The MRE is based on a subblocked model with a main block size of 2.5 m x 1 m x 4 m, and subblocks of 0.16 m x 0.06 m x 2 m. Gold grades were composited to 1-m length and estimated with ID3 and high-grade spatial restrictions.
- The open pit MRE is reported inside mineable shapes constrained by an open pit optimization to respect Reasonable Prospect of Eventual Economic Extraction (RPEEE). No mining dilution and losses are added to the MRE; however, must-take material is accounted for in open pit mineable shapes.
- Open pit optimization and cut-off grade assume long-term gold price of US$ 3,500/oz, and a US$/C$ exchange rate of 1.40, slope angles of 50°, bench height of 4 m, minimum mining width of 1.5 m, metallurgical recoveries of 92%, mining costs of C$10/t mined, processing costs of C$40/t processed, transport costs of C$25/t processed and general and administrative costs of C$10/t processed.
- Tonnage has been expressed in the metric system, and gold metal content has been expressed in troy ounces. The tonnages have been rounded to the nearest 1,000 tons, and the metal content has been rounded to the nearest 1,000 ounces. Totals may not add up due to rounding errors.
- These Mineral Resources are not Mineral Reserves as they have not demonstrated economic viability. The quantity and grade of reported Inferred Mineral Resources in this news release are uncertain in nature and there has been insufficient exploration to define these resources as indicated or measured; however, it is reasonably expected that the majority of Inferred Mineral Resources could be upgraded to Indicated Mineral Resources with continued exploration.
- The QP is not aware of any factors or issues that materially affect the MRE other than normal risks faced by mining projects in the province in terms of environmental, permitting, taxation, socio-economic, marketing, and political factors, and additional risk factors regarding Indicated and Inferred Resources.
Orion Deposit MRE
The updated Orion deposit MRE was prepared by Norda Stelo using Leapfrog geo 2025.3 ("Leapfrog 2025.3") and Leapffog Edge 2025.3 ("Edge"). Leapfrog 2025.3 was used to model the lithologies and mineralized zones. The estimation, which consisted of 3D block modelling and grade interpolation, was performed with Edge. Statistical studies, capping and variography were completed using Edge, Snowden Supervisor v.9 ("Supervisor") and Microsoft Excel. Grades were interpolated using ordinary kriging. The updated MRE is reported above a 0.47 g/t Au cut-off for an open-pit scenario and at 1.13 g/t Au for an underground scenario.
The following Orion deposit MRE is effective as of January 22, 2026, and incorporates 46,017.34 m in 219 DDH (Table 5).
Table 5: Orion deposit MRE (effective date January 22, 2026).
| Deposit | Mining Method | Category | Tonnage (kt) | Grade (g/t Au) | Contained Oz (koz) |
| Orion2 | Open Pit | Indicated | 598 | 1.75 | 33.6 |
| Inferred | 91 | 1.92 | 5.6 | ||
| Underground | Indicated | 636 | 1.92 | 39.3 | |
| Inferred | 523 | 2.16 | 36.2 | ||
| Total Indicated | 1.234 | 1.84 | 72.9 | ||
| Total Inferred | 614 | 2.12 | 41.8 |
Orion MRE Notes:
- These Mineral Resources are not Mineral Reserves as they do not have demonstrated economic viability. The MRE follows current CIM Definition Standards (2014) and CIM MRMR Best Practice Guidelines (2019).
- The QPs for the MRE, as defined by NI 43-101, are Chafana Sako, P.Geo. of Norda Stelo and Stephen Coates, P.Eng. of Evomine. The effective date is January 22, 2026.
- The estimation encompasses thirty seven (37) zones and a dilution envelope using Leapfrog 2025.3 and interpolated using Edge.
- 1.0-m composites were calculated within the mineralized zones using the grade of the adjacent material when assayed or a value of zero when not assayed. High-grade capping on composites (supported by statistical analysis) was set between 5.0 and 70.0 g/t Au for envelopes.
- The estimate was completed using a sub-block model in Edge, with a parent block size of 5 m x 5 m x 5 m (X,Y,Z) and a sub-block size of 0.625 m x 0.625 m x 0.625 m (X,Y,Z).
- Grade interpolation was obtained by the Ordinary Kriging (OK) method using hard boundaries.
- Density values of 2.7 to 2.83 g/cm3 were assigned to all mineralized zones.
- Mineral Resources were classified as Indicated and Inferred Mineral Resources. The Inferred Mineral Resource category is defined for blocks estimated if the 1 to 5 holes closest to the block have an average distance < 35 to 55 m and if the block was estimated with pass 1 or 2 and there is reasonable geological and grade continuity.
- The MRE is locally pit constrained. The pit-constrained results are presented undiluted and are considered to have reasonable prospects of economic viability. The pit-constrained MRE is reported at a 0.42 g/t Au cut-off grade. The cut-off was calculated using the following parameters: gold price = US$ 3,500/oz; USD:CAD exchange rate = 1.40; mining cost = CA$10.00/t; processing + G&A costs = CA$48.50/t; bedrock slope angle of 50° and mill recovery = 92%. The underground mineral resource estimate is reported at a cut-off grade of 1.13 g/t Au. The underground mineral resources estimate was based on potential long hole mining method depending on the orientation of the mineralization. The cut-off grade was calculated using the following parameters: mining cost = CA$ 100.00; processing cost and G&A = CA$ 82.02; selling costs = CA$ 4.89; gold price = US$ 3,500/oz; USD:CAD exchange rate = 1.40; and mill recovery = 92%.
- The cut-off grades should be re-evaluated in light of future prevailing market conditions (metal prices, exchange rates, mining costs etc.). The number of metric tons (tonnes) was rounded to the nearest thousand, following the recommendations in NI 43-101. Any discrepancies in the totals are due to rounding effects. The metal contents are presented in troy ounces (tonnes x grade / 31.10348). The QPs are not aware of any known environmental, permitting, legal, title-related, taxation, socio-political, or marketing issues or any other relevant issue not reported in the Technical Report that could materially affect the MRE.
Stog'er Tight Deposit MRE
The Stog'er Tight deposit MRE was prepared by Norda Stelo using Leapfrog 2025.3 and Edge. Leapfrog was used to model the lithologies and mineralized zones. The estimation, which consisted of 3D block modelling and grade interpolation, was performed with Edge. Statistical studies, capping and variography were completed using Supervisor and Microsoft Excel. Grades were interpolated using ordinary kriging. The updated MRE is reported above a 0.42 g/t Au cut-off for an open-pit scenario.
The following MRE is effective as of January 22, 2026 and incorporates 35,246.42 m in 523 DDH (Table 6).
Table 6: Stog'er Tight MRE (effective date January 22, 2026).
| Deposit | Mining Method | Category | Tonnage (kt) | Grade (g/t Au) | Contained Oz (koz) |
| Stog'er Tight3 | Open Pit | Total Inferred | 545 | 2.16 | 37.8 |
Stog'er Tight MRE Notes:
- This MRE follows current CIM Definition Standards (2014) and CIM MRMR Best Practice Guidelines (2019).
- The QPs for the MRE, as defined by NI 43-101, are Chafana Sako, P.Geo. of Norda Stelo and Stephen Coates, P.Eng. of Evomine. The effective date is January 22, 2026.
- The estimation encompasses twelve (12) zones and a dilution envelope using Leapfrog 2025.3 and interpolated using Edge.
- 1.0-m composites were calculated within the mineralized zones using the grade of the adjacent material when assayed or a value of zero when not assayed. High-grade capping on composites (supported by statistical analysis) was set at 30.0 g/t Au for envelopes.
- The estimate was completed using a sub-block model in Edge, with a parent block size of 3 m x 3 m x 3 m (X,Y,Z) and a sub-block size of 0.75 m x 0.75 m x 0.75 m (X,Y,Z).
- Grade interpolation was obtained by the Ordinary Kriging (OK) method using hard boundaries.
- Density values of 2.8 to 2.9 g/cm3 were assigned to all mineralized zones.
- Mineral Resources were classified as Indicated and Inferred Resources. Indicated resources are defined for blocks were estimated if the 2 holes closest to the block have an average distance < 30 m with pass 1 or 2, and there is reasonable geological and grade continuity. The inferred category is defined for blocks estimated if the 1 hole closest to the block have an average distance < 60 m and if the block was estimated with pass 3 and there is reasonable geological and grade continuity.
- The MRE is locally pit constrained. The pit-constrained results are presented undiluted and are considered to have reasonable prospects of economic viability. The pit-constrained MRE is reported at a 0.48 g/t Au cut-off grade. The cut-off was calculated using the following parameters: gold price = US$ 3,500/oz; USD:CAD exchange rate = 1.40; mining cost = CA$10.00/t; processing + G&A costs = CA$82.02/t; bedrock slope angle of 50° and mill recovery = 92%.
- The cut-off grades should be re-evaluated in light of future prevailing market conditions (metal prices, exchange rates, mining costs etc.).
- The number of metric tons (tonnes) was rounded to the nearest thousand, following the recommendations in NI 43-101. Any discrepancies in the totals are due to rounding effects. The metal contents are presented in troy ounces (tonnes x grade / 31.10348).
- The QPs are not aware of any known environmental, permitting, legal, title-related, taxation, socio-political, or marketing issues or any other relevant issue not reported in the Technical Report that could materially affect the MRE.
Data Verification
The data used in the Hammerdown MRE is supported by Quality Assurance and Quality Control ("QA/QC") procedures, such as the insertion of certified standards and blanks into the sample stream and the utilization of certified independent analytical laboratories for all assays. The QA/QC data and methodology on the project were reviewed and will be summarized in the Technical Report.
Hammerdown Deposit MRE
Christian Beaulieu, P.Geo. of Mineralis Consulting Services Inc., an independent QP in accordance with the requirements of NI 43-101, has reviewed the adequacy of sample preparation, security, and analytical procedures conducted by New Found Gold from 2018 through to the effective date of the Hammerdown deposit MRE. This review found no material issues or inconsistencies that could adversely affect the quality or reliability of the data. The QP is of the opinion that:
- New Found Gold's sample preparation procedures are appropriate for the deposit type and mineralization style.
- Analytical methods used, including fire assay, are suitable for determining gold grades in the Hammerdown deposit.
- The QA/QC program, which includes certified reference materials ("CRMs"), blanks, and field and coarse duplicates, is well-structured, meets industry standards, and provides confidence in the assay data.
- Sample security measures and chain of custody protocols are sufficient to ensure the integrity of the data.
Overall, Mr. Beaulieu is of the opinion that New Found Gold's sampling, analytical methods, and QA/QC program meet industry standards and are suitable for use in the Hammerdown deposit MRE. While some CRMs show minor bias, they are not judged to materially impact the validity of the database and are conservative in nature.
Data verification for the drill hole database included comparing gold assay values used to support the Hammerdown deposit MRE against the original analytical certificates from Eastern Analytical Ltd. ("EAL") in Springdale, NL, the primary laboratory used by New Found Gold between 2018 and 2025.
Mr. Beaulieu identified no material discrepancies that would impact the validity of the Hammerdown deposit MRE and is of the opinion that the verification process confirms the reliability of the assay database, ensuring its suitability for use for the Hammerdown deposit MRE.
In accordance with NI 43-101, Mr. Beaulieu, conducted a site visit to the Hammerdown deposit and related facilities on May 12 to May 13, 2025 and on October 15 to October 16, 2025.
During these visits, Mr. Beaulieu inspected and reviewed the logging environment and procedures for data collection and sampling. He also examined core samples from the Wisteria, Hammerdown and Rumbullion areas of the Hammerdown deposit. In addition, he interviewed New Found Gold's personnel and gathered information necessary for completing the Hammerdown deposit MRE and accompanying Technical Report.
Mr. Beaulieu also inspected mineralized intervals from drill hole cores and from surface mineralization (outcrops) relevant to the Hammerdown deposit MRE and verified collar locations using a handheld GPS and visually comparing mineralization with interpreted drilling sections. New Found Gold provided full access to all facilities and personnel during the visit. Mr. Beaulieu was accompanied by New Found Gold personnel: Jason Flight, P.Geo. (Senior Project Geologist), Larry Pilgrim, P.Geo. (Project Manager, NL Properties) and Paul LeGrow, P.Geo (Geologist).
Orion Deposit MRE
Chafana Sako, P.Geo. of Norda Stelo, an independent QP in accordance with the requirements of NI 43-101, has reviewed the adequacy of sample preparation, security, and analytical procedures conducted by New Found Gold from 2011 through to the effective date for the Orion deposit. This review found no material issues or inconsistencies that could adversely affect the quality or reliability of the data. The QP is of the opinion that:
- NFG's sample preparation procedures are appropriate for the deposit type and mineralization style.
- Analytical methods used, including fire assay, are suitable for determining gold grades in the Orion deposit.
- The QA/QC program, which includes CRMs, blanks, and duplicates, is well-structured, meets industry standards, and provides confidence in the assay data.
- Sample security measures and chain of custody protocols are sufficient to ensure the integrity of the data.
Overall, Mr. Sako is of the opinion that NFG's sampling, analytical methods, and QA/QC program meet industry standards and are suitable for use in the Orion deposit MRE.
Data verification for the drill hole database included comparing gold assay values used to support the Orion deposit MRE against the original analytical certificates from EAL in Springdale, NL, the primary laboratories used by New Found Gold between 2011 and 2022.
Mr. Sako found no material discrepancies identified that would impact the validity of the Orion deposit MRE and is of the opinion that the verification process confirms the reliability of the assay database, ensuring its suitability for use for this MRE.
Stog'er Tight Deposit MRE
Chafana Sako, P.Geo. of Norda Stelo, an independent QP in accordance with the requirements of NI 43-101, has reviewed the adequacy of sample preparation, security, and analytical procedures conducted by New Found Gold from 2014 through to the effective date for the Stog'er Tight deposit MRE. This review found no material issues or inconsistencies that could adversely affect the quality or reliability of the data. The QP is of the opinion that:
- NFG's sample preparation procedures are appropriate for the deposit type and mineralization style.
- Analytical methods used, including fire assay, are suitable for determining gold grades in the Stog'er Tight deposit.
- The QA/QC program, which includes CRMs, blanks, and duplicates, is well-structured, meets industry standards, and provides confidence in the assay data.
- Sample security measures and chain of custody protocols are sufficient to ensure the integrity of the data.
Overall, Mr. Sako is of the opinion that New Found Gold's sampling, analytical methods, and QA/QC program meet industry standards and are suitable for use in the Stog'er Tight deposit MRE.
Data verification for the drill hole database included comparing gold assay values used to support the Stog'er Tight deposit MRE against the original analytical certificates from EAL in Springdale, NL, the primary laboratories used by New Found Gold between 2014 and 2021.
Mr. Sako found no material discrepancies identified that would impact the validity of the Stog'er Tight deposit MRE and is of the opinion that the verification process confirms the reliability of the assay database, ensuring its suitability for use for this MRE.
In accordance with NI 43-101, James Guiraud, P.Geo., of Norda Stelo, conducted a site visit to the Stog'er Tight deposit and related facilities on October 5 to 10, 2025. During this visit, he inspected and reviewed the logging environment and procedures for data collection and sampling. He also examined core samples from the Stog'er Tight deposit. In addition, he interviewed New Found Gold's personnel and gathered information necessary for completing Stog'er Tight deposit MRE and accompanying Technical Report.
Mr. Sako also inspected drill collars and drill hole cores relevant to this MRE, verifying collar locations and visually comparing mineralization with interpreted drilling sections. New Found Gold provided full access to all facilities and personnel during the visit.
Exploration Data
Figure 4 presents a compilation of historic and recent rock sample results collected by Maritime Resources Corp. ("Maritime"), Signal Gold Inc. ("Signal Gold"), as well as previous operators. Rock samples were obtained during prospecting programs, geological mapping, channel sampling, and diamond drilling campaigns. Sampling media include, outcrop and channel samples, interpreted to represent in place bedrock; float samples of uncertain origin that may have been transported by glacial or surficial processes; subcrop samples derived from low lying or partially exposed material that may reflect underlying bedrock but cannot be assumed to be in situ; and diamond drill core.
Historic operators employed a variety of location control methods, including cut lines and non GPS techniques, resulting in variable positional accuracy for older sample data. In contrast, Maritime and Signal Gold used handheld GPS units for geological mapping, prospecting, and a combination of handheld GPS and high-precision Trimble Differential GPS system for drill hole collar and channel sample locations.
Recent analytical work completed by Maritime and Signal Gold was performed by EAL of Springdale, NL. EAL is accredited to ISO 17025:2005 for a defined scope of analytical procedures and is independent of New Found Gold. Samples were delivered to the laboratory in sealed plastic bags by field personnel. At EAL, samples were dried, crushed, and pulped. Crushing was completed to approximately 80% passing -10 mesh, after which a riffle splitter was used to obtain a ~250 g subsample. This subsample was pulverized using a ring mill to 95% passing -150 mesh. A 30 g aliquot was selected from the pulped material for fire assay analysis.
EAL maintains a comprehensive internal QA/QC program including the routine insertion of standards, blanks, and duplicates within each analytical batch. In addition, for drill core and channel sampling only, Maritime and Signal Gold inserted CRMs, blanks, and duplicate samples into the sample stream to monitor assay accuracy and precision during drilling campaigns. Umpire check assays were periodically completed at an independent secondary laboratory to assess potential analytical bias, involving re-analysis of selected pulps and rejects. The EAL internal QA/QC program was relied on for grab samples.
Historical QA/QC information provided by prior operators is incomplete and cannot be fully verified. Database records indicate that the majority of historical analyses were performed by EAL; however, the absence of documented QA/QC protocols limits the ability to assess data reliability for older sampling.
Cautionary Statement
The PEA is preliminary in nature. It includes Inferred Mineral Resources that are considered too speculative geologically to have economic considerations applied to them that would enable them to be categorized as Mineral Reserves and there is no certainty that the PEA will be realized.
Forward-Looking Information
This press release contains certain "forward-looking statements" within the meaning of Canadian securities legislation, including statements regarding bringing the recently acquired Hammerdown deposit into commercial production in H2/26; ramping up Pine Cove to full production; statements relating to Hammerdown's on-island processing, hauling, sorting and tailing facilities; advancing Queensway toward production in H2/27; commissioning of a sorter in H2/26; future exploration programs at Hammerdown and the timing and focus thereof; and continuing focused exploration at Queensway to grow resources and support future expansions. Although the Company believes that such statements are reasonable, it can give no assurance that such expectations will prove to be correct. Forward-looking statements are statements that are not historical facts; they are generally, but not always, identified by the words "expects", "plans", "anticipates", "believes", "interpreted", "intends", "estimates", "projects", "aims", "suggests", "indicate", "often", "target", "future", "likely", "pending", "potential", "encouraging", "goal", "objective", "prospective", "possibly", "preliminary", and similar expressions, or that events or conditions "will", "would", "may", "can", "could" or "should" occur, or are those statements, which, by their nature, refer to future events. The Company cautions that forward-looking statements are based on the beliefs, estimates and opinions of the Company's management on the date the statements are made, and they involve a number of risks and uncertainties. Consequently, there can be no assurances that such statements will prove to be accurate and actual results and future events could differ materially from those anticipated in such statements. Except to the extent required by applicable securities laws and the policies of the TSX Venture Exchange, the Company undertakes no obligation to update these forward-looking statements if management's beliefs, estimates or opinions, or other factors, should change. Factors that could cause future results to differ materially from those anticipated in these forward-looking statements include risks associated with the Company's ability to complete exploration and drilling programs as expected, possible accidents and other risks associated with mineral exploration operations, the risk that the Company will encounter unanticipated geological factors, risks associated with the interpretation of exploration results and the results of the metallurgical testing program, the possibility that the Company may not be able to secure permitting and other governmental clearances necessary to carry out the Company's exploration plans, the risk that the Company will not be able to raise sufficient funds to carry out its business plans, and the risk of political uncertainties and regulatory or legal changes that might interfere with the Company's business and prospects. The reader is urged to refer to the Company's Annual Information Form and Management's Discussion and Analysis, publicly available through the Canadian Securities Administrators' System for Electronic Document Analysis and Retrieval (SEDAR+) at www.sedarplus.ca for a more complete discussion of such risk factors and their potential effects.
Non-GAAP Financial Measures
The Company has included certain non-GAAP financial measures in this press release. These financial measures are not defined under International Financial Reporting Standards ("IFRS") and should not be considered in isolation. The Company believes that these financial measures, together with financial measures determined in accordance with IFRS, provide investors with an improved ability to evaluate the underlying performance of the Company. The inclusion of these financial measures is meant to provide additional information and should not be used as a substitute for performance measures prepared in accordance with IFRS. These financial measures are not necessarily standard and therefore may not be comparable to other issuers.
All-in Sustaining Cost
All in sustaining cost is a non-GAAP financial measure calculated based on guidance published by the World Gold Council ("WGC"). The WGC is a market development organization for the gold industry and is an association whose membership comprises leading gold mining companies. Although the WGC is not a mining industry regulatory organization, it worked closely with its member companies to develop these metrics. Adoption of the all-in sustaining cost metric is voluntary and not necessarily standard, and therefore, this measure presented by the Company may not be comparable to similar measures presented by other issuers. The Company believes that the all-in sustaining cost measure complements existing measures and ratios reported by the Company.
All-in sustaining cost includes both operating and capital costs required to sustain gold production on an ongoing basis. Sustaining operating costs represent expenditures expected to be incurred at the Project that are considered necessary to maintain production. Sustaining capital represents expected capital expenditures comprising mine development costs, including capitalized waste, and ongoing replacement of mine equipment and other capital facilities, and does not include expected capital expenditures for major growth projects or enhancement capital for significant infrastructure improvements.
Cash Costs
Cash Costs are reflective of the cost of production. Cash Costs reported in the MRE include mining costs, processing and water treatment costs, general and administrative costs of the mine, refining and transportation costs, silver revenue credits and royalties.
Free Cash Flow
Free Cash Flows are revenues net of operating costs, royalties, working capital adjustments, capital expenditures and cash taxes. The Company believes that this measure is useful to readers in assessing the Company's ability to generate cash flows from Hammerdown.
Table 7: Hammerdown Gold Project: Mine Plan Summary.
| PRODUCTION | ||||||||||||||||
| YR1 | YR2 | YR3 | YR4 | YR5 | YR6 | YR7 | YR8 | YR9 | YR10 | YR11 | YR12 | YR13 | YR14 | |||
| Total | Units | 2026 | 2027 | 2028 | 2029 | 2030 | 2031 | 2032 | 2033 | 2034 | 2035 | 2036 | 2037 | 2038 | 2039 | |
| Mill feed production tonnage | 3,159 | k t | 256 | 256 | 256 | 256 | 256 | 256 | 256 | 256 | 256 | 256 | 256 | 256 | 91 | - |
| Mill feed head grades, Au | 2.89 | g/t | 3.11 | 4.92 | 3.92 | 2.68 | 1.87 | 2.25 | 3.27 | 4.85 | 2.75 | 1.94 | 1.92 | 1.68 | 1.75 | - |
| Ounce Production | 251,287 | oz | 22,29 | 35,288 | 28,080 | 19,18 | 12,66 | 15,59 | 23,322 | 34,474 | 18,557 | 12,252 | 13,068 | 12,028 | 4,476 | - |
| Commodity price, Au | 3,656 | US$/oz | 4,132 | 4,000 | 3,775 | 3,600 | 3,600 | 3,475 | 3,475 | 3,475 | 3,475 | 3,475 | 3,475 | 3,475 | 3,475 | - |
| Gross Revenue - US$ | 918.6 | MUS$ | 92.1 | 141.1 | 106.0 | 69.0 | 45.6 | 54.2 | 81.0 | 119.8 | 64.5 | 42.6 | 45.4 | 41.8 | 15.6 | - |
| Exchange Rate | 1.39 | CA$:US$ | 1.39 | 1.39 | 1.39 | 1.39 | 1.39 | 1.39 | 1.39 | 1.39 | 1.39 | 1.39 | 1.39 | - | - | - |
| Gross Revenue - CA$ | 1,276.8 | MCA$ | 128.0 | 196.2 | 147.3 | 96.0 | 63.4 | 75.3 | 112.6 | 166.5 | 89.6 | 59.2 | 63.1 | 58.1 | 21.6 | - |
| Selling Costs | 7.0 | MCA$ | 0.6 | 1.0 | 0.8 | 0.5 | 0.4 | 0.4 | 0.6 | 1.0 | 0.5 | 0.3 | 0.4 | 0.3 | 0.1 | - |
| Net Smelter Return | 1,269.8 | MCA$ | 127.4 | 195.2 | 146.5 | 95.4 | 63.0 | 74.9 | 112.0 | 165.5 | 89.1 | 58.8 | 62.7 | 57.7 | 21.5 | - |
| Royalites | 17.4 | MCA$ | 1.3 | 5.1 | 1.5 | 1.0 | 0.6 | 0.8 | 1.1 | 1.7 | 0.6 | 0.1 | 1.3 | 1.7 | 0.6 | - |
| Net Revenue | 1,252.4 | MCA$ | 126.1 | 190.1 | 145.1 | 94.5 | 62.4 | 74.1 | 110.8 | 163.9 | 88.5 | 58.7 | 61.4 | 56.0 | 20.8 | - |
| Operating Costs | 725.9 | MCA$ | 66.0 | 77.4 | 71.0 | 60.2 | 48.7 | 61.4 | 71.6 | 63.9 | 54.2 | 52.7 | 48.1 | 35.3 | 15.4 | - |
| Sustaining Capital Costs (incl. Contingency) | 97.7 | MCA$ | 5.6 | 0.3 | 10.5 | 23.2 | 34.1 | 19.9 | 0.4 | - | 3.7 | - | - | - | - | - |
| Capital Costs (incl. Contingency) | 24.3 | MCA$ | 24.3 | - | - | - | - | - | - | - | - | - | - | - | - | - |
| Other Costs | 18.0 | MCA$ | 1.3 | (0.1) | (0.5) | (0.5) | 1.4 | 1.2 | (0.2) | 0.6 | 0.4 | 6.5 | 0.2 | 0.2 | 0.2 | 7.2 |
| Taxes | 143.2 | MCA$ | 4.8 | 41.5 | 26.7 | 8.3 | - | - | 9.1 | 37.4 | 10.7 | - | 2.1 | 6.4 | 1.2 | (5.0) |
| Cash flow results | ||||||||||||||||
| Pre-tax cash flow | 386.5 | MCA$ | 28.8 | 112.5 | 64.0 | 11.7 | (21.9) | (8.4) | 39.1 | 99.3 | 30.1 | (0.5) | 13.1 | 20.5 | 5.2 | (7.2) |
| Cumulative Pre-Tax Cash Flow | MCA$ | 28.8 | 141.3 | 205.3 | 217.0 | 195.1 | 186.8 | 225.9 | 325.2 | 355.3 | 354.9 | 368.0 | 388.5 | 393.7 | 386.5 | |
| After-tax cash flow | 243.3 | MCA$ | 24.0 | 71.0 | 37.3 | 3.4 | (21.9) | (8.4) | 30.0 | 61.9 | 19.4 | (0.5) | 11.0 | 14.1 | 4.0 | (2.2) |
| Cumulative After-Tax Cash Flow | MCA$ | 24.0 | 95.0 | 132.3 | 135.7 | 113.8 | 105.4 | 135.4 | 197.4 | 216.8 | 216.4 | 227.4 | 241.5 | 245.5 | 243.3 | |
To view the source version of this press release, please visit https://www.newsfilecorp.com/release/285504
Source: New Found Gold Corp.

