

VANCOUVER, BC / ACCESS Newswire / January 5, 2026 / Aton Mining Inc. (AAN:TSX-V) ("Aton" or the "Company") is pleased to update investors on the results of metallurgical testwork from its Abu Marawat deposit ("Abu Marawat"). Abu Marawat is located within the Company's 100% owned Abu Marawat Concession ("the Concession"), in the Eastern Desert of Egypt.
Highlights:
Nine composite samples representing the main mineralisation types at Abu Marawat underwent preliminary metallurgical testwork investigating several different process options. The composite samples were prepared from selected diamond drill core intervals and RC chips;
The samples exhibit medium to hard grinding characteristics, with Bond Rod and Ball Mill Work Indices ranging from 12.8-17.1 kWh/t. Abrasion Indices indicate slightly to moderately abrasive behaviour. Sulphide composite AM-MET03 exhibits hard crushing characteristics, while oxide samples are classified as medium;
Whole ore cyanide leaching resulted in gold extractions ranging from 69.8% to 90.7%, and silver extractions between 48.3% and 88.4%. Cyanide consumption (3.2-9.2 kg/t) and lime consumption (0.6-12.0 kg/t) varied by ore type. Sulphide and transitional samples generally achieved the highest extraction efficiencies. Overall, the testwork demonstrated that gold is largely amenable to cyanide leaching, with silver recovery being more variable;
Copper rougher flotation achieved 67-92% copper recovery with concentrate grades of 4-19% Cu, depending on mineralisation type. Gold recovery in copper concentrates ranged from 40-75%, and silver from 56-80%. Several samples (e.g. Fin Vein transitional and CVZ oxide) produced high grade copper concentrates with significant precious metal enrichment;
Cleaner stages produced high grade copper concentrates (up to 45% Cu), but at the cost of significant recovery losses (often 10-40% Cu recovery in the cleaners). While copper and gold recoveries decreased in cleaner circuits, silver grades remained notably high. Silver consistently reported strongly to copper concentrates, frequently achieving 2-6 kg/t Ag in the cleaner products;
Zinc depression proved challenging when testing the transitional ore types, especially for the CVZ transitional composite, with zinc misreporting to copper concentrates even at elevated dosages of zinc depressants. In contrast, the Fin Vein transitional composite responded better, with improved zinc depression;
Saleable copper and zinc concentrates were achieved during testing of the CVZ sulphide composite sample. The copper circuit achieved a concentrate grade of 23.7% Cu at 48.3% recovery, whilst the zinc circuit achieved a concentrate grade of 60.4% Zn at 72.3% recovery;
Leaching of flotation tailings provided substantial incremental recovery, adding a further 60-86% gold extraction and 37-64% silver extraction from the final cleaner tailings;
SART testing exhibited a high degree of sulphide precipitation for dissolved copper, zinc, and silver (typically >97% precipitated from solution in 15 minutes), enabling significant cyanide regeneration. Gold extraction was limited (~62%) due to reduction to elemental gold and, possibly co-precipitation and entrainment.
Overall, metallurgical testing of the Abu Marawat composite samples demonstrated that:
The mineralisation responds strongly to conventional cyanide leaching, especially for gold;
High value copper concentrates containing significant silver credits are achievable, albeit with some recovery losses;
Zinc depression proved a challenge, especially in CVZ and Fin Vein transitional mineralisation types;
Zinc cleaner flotation can produce marketable high-grade concentrates with moderate recovery;
A flotation + leach flowsheet offers improved overall metal extraction; and
SART can be highly effective for cyanide recovery and base metal removal at Abu Marawat.
"These preliminary metallurgical testwork results from the Abu Marawat polymetallic mineralisation are most encouraging, and indicate that the oxide mineralisation types can be processed economically using a fairly conventional process route for copper ores with high cyanide soluble copper content, that is by producing a saleable copper concentrate with precious metal credits, a saleable sulphide concentrate from SART, and doré from a Merrill-Crowe circuit" said Tonno Vahk, CEO. "Transitional ores from the CVZ and Fin Vein can be processed by conventional flotation to produce a saleable zinc concentrate with copper, gold and silver credits, which also could potentially be sold as a precious metals concentrate. The CVZ and Fin Vein sulphide mineralisation can be processed by sequential flotation to produce saleable copper and zinc concentrates, containing very respectable gold and silver metal credits. The latest phase of drilling has also been completed at Abu Marawat and our consultants are about to commence work on updating the Abu Marawat mineral resource estimate. This preliminary metallurgical testwork programme has identified potential processing routes for the production of gold, silver, copper and zinc from Abu Marawat, allowing the Company to push ahead towards its goal of incorporating both the Abu Marawat and Semna deposits, where drilling is ongoing, into the Abu Marawat exploitation lease."
Abu Marawat gold-silver-copper-zinc project
The Abu Marawat gold-silver-copper-zinc deposit is located approximately 35km northeast of the Hamama West deposit and 10km north-northeast of the Semna gold mine project, and is accessed via a well maintained desert track from the Qena-Safaga highway, approximately 25km to the north (Figure 1). On March 1, 2012 Aton Resources, when formerly named Alexander Nubia International Inc, announced a maiden Inferred Mineral Resource at Abu Marawat, prepared by Roscoe Postle Associates Inc., in compliance with the requirements set out in Canada's National Instrument 43-101. The resource was subsequently restated in an updated Technical Report without amendment (see news release dated January 24, 2017), and which is available online at Aton's website at https://atonresources.com/investors/reports-and-presentations. This Inferred Mineral Resource was based on 98 diamond drill holes totalling 19,573 metres. 19 of these holes were drilled by a former property owner, Minex Minerals Egypt, a wholly owned subsidiary of Greenwich Resources Plc during the late 1980's, and the remainder were drilled by Aton in 2011. The Inferred Mineral Resource comprises 2.9 million tonnes at an average grade of 1.75 g/t Au, 29.3 g/t Ag, 0.77% Cu and 1.15% Zn, containing 162 thousand ounces of gold, 2.7 million ounces of silver, 49 million lbs of copper, and 73 million lbs of zinc, and was based on net smelter return ("NSR") cut-off grades.
During 2025 Aton completed a 113 hole diamond drilling programme (holes AMD-101 to AMD-213), for a total of 9,643 metres drilled (see news release dated October 2, 2025), focused primarily on the more gold and silver-rich parts of the CVZ and the Fin Vein, of which several holes were designed specifically for the collection of metallurgical testwork samples. In November 2025, Aton also completed a 71 hole reverse circulation percussion ("RC") drilling programme (holes AMP-214 to AMP-284), for a total of 6,647 metres drilled. The final results are not yet available for this RC programme, but are expected to be reported shortly.
The polymetallic mineralisation at Abu Marawat is interpreted as being mesothermal in origin, and occurs in a series of discrete and roughly parallel N-S to NNW-SSE trending veins and structures, of which the Fin Vein and the Central Vein zone ("CVZ") are the most significant, hosted within a sequence of intensely hydrothermally altered, felsic metavolcanic rocks. The Fin Vein and the CVZ are about 50-100m apart and have been traced for at least 800m in surface outcrop and drill holes. The bulk of the Inferred Mineral Resource at the Abu Marawat deposit encompasses parts of the CVZ and the Fin Vein, but there are also other subparallel mineralised veins to the east and to the west of these structures, such as the J Vein, the JVZ structure.
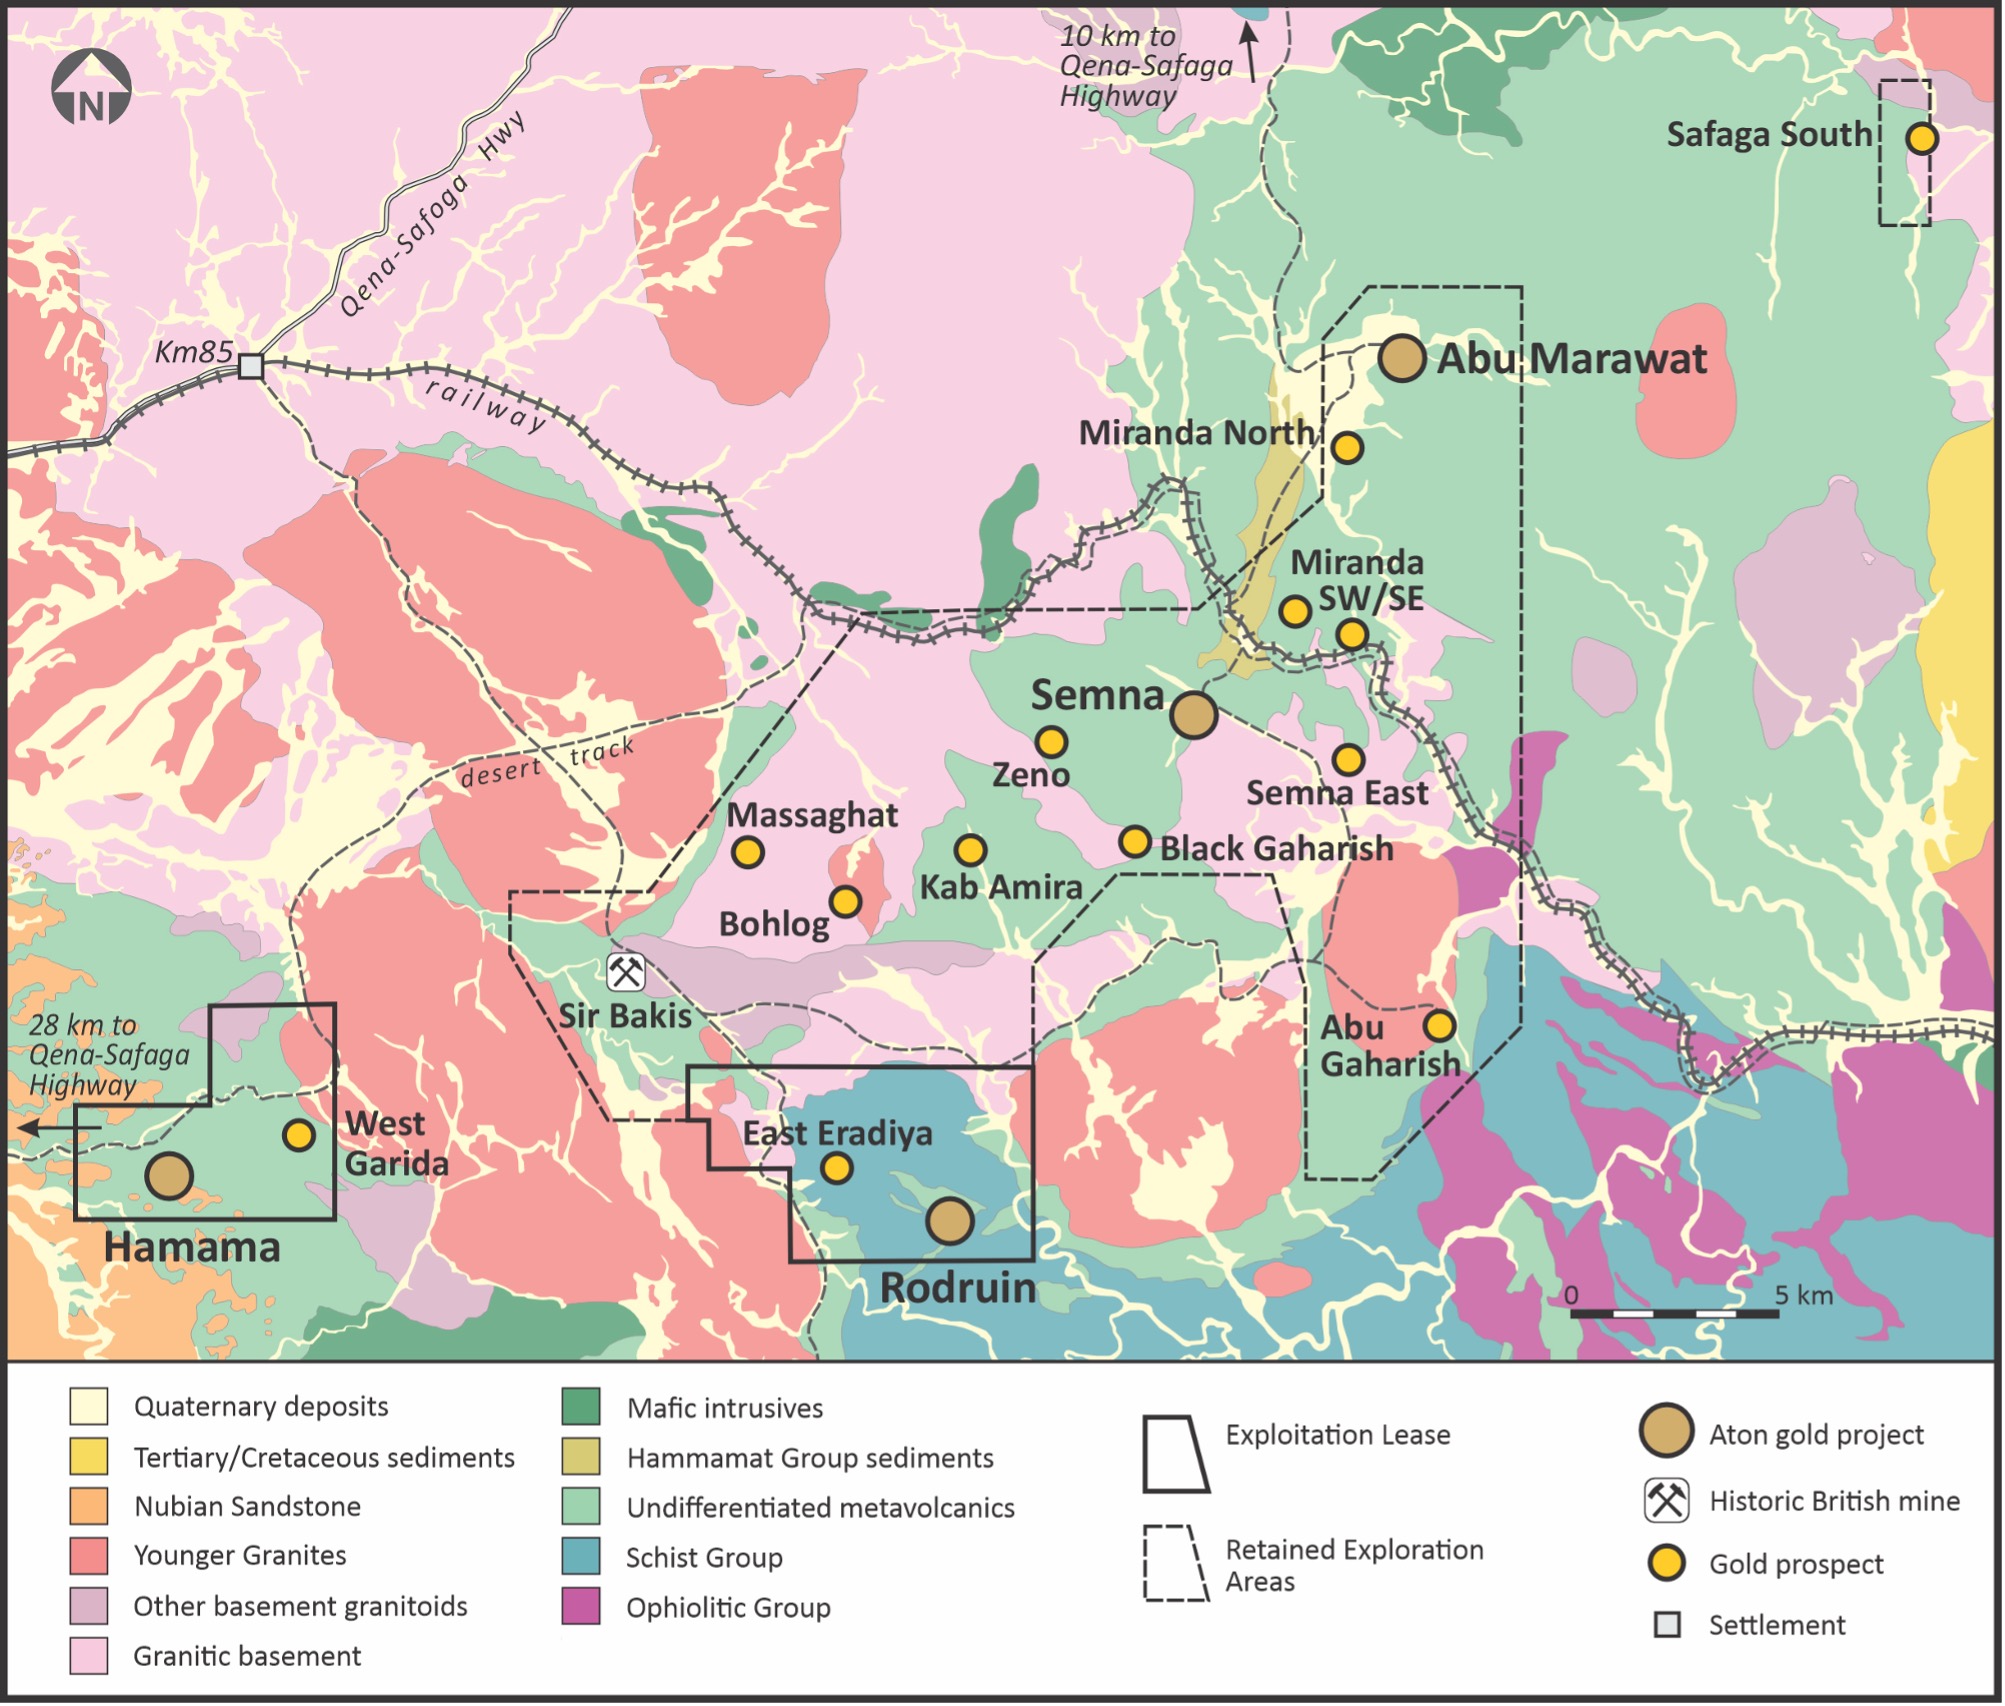
Figure 1: Geology plan of the Abu Marawat Concession, showing the location of the Abu Marawat deposit
Metallurgical testwork programme
Nine composite samples were prepared from the Abu Marawat deposit for metallurgical testing (AM-MET01 to AM-MET09), representing the oxide, transitional and sulphide mineralisation types associated with the CVZ, the Fin Vein and the JVZ structure.
The preliminary testwork programme was designed to evaluate several different options for processing copper ores with high cyanide soluble copper content, and surface mineral oxidation. Typically, when copper oxide-bearing gold mineralisation with high cyanide soluble copper content is processed via conventional CIL, this results in high cyanide consumption. The programme specifically focused on evaluating conventional cyanide leaching versus flotation-CIL for the oxide mineralisation. A limited programme of sulphidisation, acidification, re-cycling and thickening ("SART") testing was undertaken to determine the potential for recovering metals including copper, gold, silver and zinc from a gold cyanidation leach solution generated from a blend of oxide mineralisation from the CVZ.
The transitional and sulphide ores were also tested by conventional flotation to determine whether separate saleable copper and zinc concentrates could be produced.
Nine composite samples for metallurgical testwork were prepared, representing the main mineralisation types present at Abu Marawat. The samples were selected from diamond drill core (both HQ and PQ size, samples AM-MET01 to AM-MET08), and RC drill chips (sample AM-MET09). Details of the samples are provided in Table 1.
Sample ID | Sample type | Testwork planned | Material type | Aton estimated grades | |||
Au (g/t) | Ag (g/t) | Cu (%) | Zn (%) | ||||
AM-MET01 | Fin Vein oxide | comminution | PQ whole core | - | - | - | - |
AM-MET02 | CVZ oxide | comminution | PQ whole core | - | - | - | - |
AM-MET03 | CVZ transitional | comminution / flotation | PQ whole core | - | - | - | - |
AM-MET04 | Fin Vein transitional | leach test / flotation | PQ/HQ half core | 5.00 | 176 | 0.31 | 3.91 |
AM-MET05 | Fin Vein oxide | leach test | PQ/HQ half core | 4.78 | 103 | 0.44 | 3.80 |
AM-MET06 | CVZ oxide | leach test | HQ half core | 3.05 | 35.6 | 1.21 | 0.39 |
AM-MET07 | CVZ oxide | leach test | HQ half core | 2.64 | 34.3 | 0.79 | 1.23 |
AM-MET08 | JVZ oxide | leach test | PQ/HQ half core | 3.31 | 36.3 | 0.25 | 0.62 |
AM-MET09 | CVZ sulphide | leach test / flotation | RC chips | 4.37 | 99 | 0.38 | 4.36 |
Table 1: Abu Marawat metallurgical sample details
Aton dispatched the nine composite samples from Egypt, totalling 350 kg in weight, to SLR Consulting ("SLR"), for metallurgical testing at their laboratory, located in Cornwall, UK. The samples were delivered in two batches, with the initial set of eight diamond drill core samples weighing 330 kg dispatched to SLR during July 2025 (samples AM-MET01 to AM-MET08). Sample AM-MET09, weighing 19.5 kg, was dispatched from Egypt and received by SLR in October 2025. The testwork was conducted between July and November 2025.
A summary of the samples received and the testwork carried out on each sample is shown in Table 2 below.
Date received | Sample ID | Testwork completed | Mass (kg) |
15/7/2025 | AM-MET01 | comminution / whole ore leach | 68.3 |
AM-MET02 | comminution / whole ore leach | 70.1 | |
AM-MET03 | comminution / whole ore leach / flotation | 90.2 | |
AM-MET04 | whole ore leach / flotation | 16.4 | |
AM-MET05 | whole ore leach / flotation / leach | 22.2 | |
AM-MET06 | whole ore leach / flotation / leach | 20.7 | |
AM-MET07 | whole ore leach / flotation / leach | 21.1 | |
AM-MET08 | whole ore leach / flotation / leach | 21.5 | |
7/10/2025 | AM-MET09 | whole ore leach / flotation | 19.5 |
Total | 350.0 | ||
Table 2: Sample receipt summary
Head assays
A representative sub-sample of composite samples AM-MET01 to AM-MET08, and latterly AM-MET09, were extracted, pulverised to <75µm and submitted for chemical analysis for the following elements; Au, Ag, total Cu ("Cu (TOT)"), soluble Cu ("Cu (CN SOL)"), Pb, Zn, As, total S ("S(TOT)"), Hg and Te. The results of the head assays are provided in Table 3.
The Au head assays measured by screen fire assay (Table 3) show reasonably good correlation with the estimated grade of the composited drill core samples (Table 1). Ag, Cu, Pb and Zn head assays also showed reasonable correlation with the estimated grades of the composite samples. The reasonably good correlation in assay results indicates that the composite samples prepared for metallurgical testwork are representative of the drill core intervals sampled. Samples AM-MET01 to AM-MET03 consisted of whole core and were selected on the basis of the visual identification of mineralisation, however, no grades could be estimated for these samples prior to their selection, collection and dispatch from site.
Sample ID | Au (g/t) | Ag (g/t) | CuTOT (%) | CuCN-SOL (%) | Pb (%) | Zn (%) | STOT (%) | |
AM-MET011 | Fin Vein oxide | 11.5 | 184 | 0.63 | - | - | 5.80 | - |
AM-MET012 | Fin Vein oxide | 11.7 | 212 | 0.63 | 0.40 | - | 5.71 | 0.04 |
AM-MET021 | CVZ oxide | 15.1 | 104 | 1.82 | - | - | 0.83 | - |
AM-MET022 | CVZ oxide | 15.1 | 122 | 1.79 | 1.53 | - | 0.92 | 0.07 |
AM-MET03 | CVZ transitional | 1.6 | 42.0 | 0.38 | 0.13 | 0.00 | 1.56 | 2.51 |
AM-MET04 | Fin Vein transitional | 3.9 | 152 | 0.35 | 0.07 | 0.11 | 3.99 | 3.05 |
AM-MET05 | Fin Vein oxide | 5.6 | 96.9 | 0.46 | 0.29 | 0.18 | 4.20 | 0.04 |
AM-MET06 | CVZ oxide | 2.0 | 34.7 | 1.08 | 0.76 | 0.01 | 0.46 | 0.06 |
AM-MET07 | CVZ oxide | 2.8 | 36.6 | 0.52 | 0.28 | 0.04 | 1.81 | 0.05 |
AM-MET08 | JVZ oxide | 3.2 | 50.5 | 0.20 | 0.11 | 0.08 | 0.54 | 0.08 |
AM-MET09 | CVZ sulphide | 4.2 | 102 | 0.41 | 0.04 | 0.16 | 4.63 | 4.05 |
Average | 7.0 | 103 | 0.75 | 0.40 | 0.08 | 2.77 | 1.41 | |
Notes:
| ||||||||
Table 3: Head assay results
Comminution testwork
Bond low energy impact tests
Bond low energy impact testing was conducted to determine the typical energy required during crushing of the sample material, known as the Crusher Work Index. Testing was conducted on three of the composite samples AM-MET01, AM-MET02 and AM-MET03. The results of the Bond low energy impact tests are summarised in Table 4.
Sample ID | Specific gravity | Bond Crusher Work Index (kWh/t) |
| |
| ||||
AM-MET01 | Fin Vein oxide | 2.91 | 13.52 |
|
AM-MET02 | CVZ oxide | 2.89 | 12.97 |
|
AM-MET03 | CVZ transitional | 2.82 | 27.94 |
|
Table 4: Bond low energy impact test results
Based on the standard classification criteria, oxide samples AM-MET01 and AM-MET02 are classified as "medium", and the transitional sample AM-MET03 as "very difficult", with respect to crushability.
Bond abrasion index tests
Bond Abrasion Index testing was performed to provide an indication of the likely mill liner and grinding media wear rates experienced when processing material from the deposits. The results of the Bond Abrasion Index tests are summarised in Table 5 below. Based on the standard classification criteria, AM-MET01 and AM-MET03 are classified as being "moderately abrasive" and AM-MET02 as "slightly abrasive".
Sample ID | Bond Abrasion Index | ||
Value | Classification | ||
AM-MET01 | Fin Vein oxide | 0.5616 | Moderately abrasive |
AM-MET02 | CVZ oxide | 0.297 | Slightly abrasive |
AM-MET03 | CVZ transitional | 0.4438 | Moderately abrasive |
Table 5: Bond Abrasion Index test results
Bond Rod Mill Work Index tests
Bond Rod Mill Work Index (BRMWi) testing was conducted on the designated AM-MET samples, to determine the energy required to grind a sample from a feed size distribution (F100) of 100% passing 12.5mm to a product size distribution (P100) of 1.18mm using a standard Laarmann LMRM41 laboratory Bond rod mill. Table 6 shows the result of the Bond Rod Mill Work Index tests.
| Sample ID | ||
AM-MET01 | AM-MET02 | AM-MET03 | |
Fin Vein oxide | CVZ oxide | CVZ transitional | |
Closing screen (µm) | 1180 | 1180 | 1180 |
Feed, F80 (µm) | 9,674 | 10,198 | 10,161 |
Product, P80 (µm) | 916 | 905 | 901 |
Grams per revolution | 9.26 | 9.26 | 11.03 |
Work Index (kWhr/t) | 14.62 | 12.84 | 16.89 |
Relative Hardness Classification | Hard | Medium | Hard |
Table 6: Bond Rod Mill Work Index test results
Bond Rod Mill Work index testing indicated that AM-MET01 and AM-MET03 samples are classified as "hard" and AM-MET02 is classified as being of "medium" hardness.
Bond Ball Mill Work Index tests
Bond Ball Mill Work Index (BBMWi) testing was used to determine the work index of the AM-MET samples composites, which is a measure of the resistance of the material to grinding. It can be used to determine the grinding power requirements for a given throughput of material under ball milling conditions. Table 7 shows the result of the Bond Ball Mill Work Index tests.
| Sample ID | ||
AM-MET01 | AM-MET02 | AM-MET03 | |
Fin Vein oxide | CVZ oxide | CVZ transitional | |
Closing screen (µm) | 106 | 106 | 106 |
Feed, F80 (µm) | 2,509 | 2,359 | 2,724 |
Product, P80 (µm) | 77 | 80 | 78 |
Grams per revolution | 1.22 | 1.22 | 1.33 |
Work Index (kWhr/t) | 15.20 | 14.57 | 17.10 |
Relative Hardness Classification | Hard | Hard | Hard |
Table 7: Bond Ball Mill Work Index test results
Based on the Bond Work Index classification criteria all 3 tested samples can be classified as "hard".
Whole ore cyanidation leach testwork
A single kinetic cyanide leach test was conducted on each composite sample to investigate metal recoveries achieved under conventional cyanide leaching conditions.
Results of the whole ore leach tests conducted on each of the 9 AM-MET samples are summarised in Table 8 below:
Sample / Test ID | Mineralisation type | Extraction (%) | Reagent consumption (kg/t) | ||||
Au | Ag | Cu | Zn | NaCN | Lime | ||
AM-MET01-LT1 | Fin Vein oxide | 85.5 | 48.3 | 19.5 | 1.5 | 4.4 | 3.2 |
AM-MET02-LT1 | CVZ oxide | 69.8 | 62.2 | 22.0 | 0.0 | 9.2 | 2.4 |
AM-MET03-LT1 | CVZ transitional | 79.2 | 66.7 | 26.0 | 0.8 | 4.6 | 0.9 |
AM-MET04-LT1 | Fin Vein transitional | 82.3 | 64.4 | 15.0 | 0.2 | 3.6 | 0.6 |
AM-MET05-LT1 | Fin Vein oxide | 82.5 | 42.0 | 18.0 | 0.5 | 4.6 | 1.8 |
AM-MET06-LT1 | CVZ oxide | 83.5 | 61.2 | 12.2 | 1.5 | 8.1 | 12.0 |
AM-MET07-LT1 | CVZ oxide | 75.5 | 51.6 | 30.8 | 0.1 | 6.2 | 2.0 |
AM-MET08-LT1 | JVZ oxide | 89.2 | 62.6 | 45.3 | 4.2 | 4.1 | 1.2 |
AM-MET09-LT1 | CVZ sulphide | 90.7 | 88.4 | 3.4 | 0.4 | 3.2 | 1.3 |
Table 8: Whole ore cyanidation leach test results
The results show gold extractions ranging from 69.8% in AM-MET02 to 90.7% in AM-MET09, and silver extractions ranging from 48.3% in AM-MET01 to 88.4% in AM-MET09.
The results show sodium cyanide ("NaCN") consumptions ranging from 3.2 kg/t in AM-MET09 to 9.2 kg/t in AM-MET02, and lime consumptions ranging from 0.6 kg/t in AM-MET04 to 12.0 kg/t in AM-MET06.
Flotation testwork programme - oxide mineralisation
Rougher kinetic tests
Rougher kinetic flotation tests were conducted on the Fin Vein, CVZ and JVZ structure oxide mineralisation composite samples. Results from the rougher stage obtained from the corresponding optimal open cycle cleaner ("OCC") tests are summarised in Table 9 below.
Sample ID | OCC test ID | Product ID | Mass pull (%) | Grade | Recovery (%) | ||||||||
Cu (%) | Au (g/t) | Ag (g/t) | Zn (%) | STOT (%) | Cu | Au | Ag | Zn | STOT | ||||
AM-MET05 | FCT 3 | Rougher Conc | 6.13 | 4.9 | 52.0 | 1,038 | 11.3 | 0.8 | 65.8 | 59.7 | 66.5 | 17.7 | 52.8 |
AM-MET06 | FCT 4 | 9.17 | 8.0 | 9.3 | 188.8 | 1.1 | 0.4 | 69.9 | 43.1 | 53.4 | 22.6 | 31.5 | |
AM-MET07 | FCT 4 | 4.77 | 5.9 | 38.1 | 519.7 | 3.0 | 0.8 | 56.1 | 59.4 | 59.8 | 8.2 | 38.8 | |
AM-MET08 | FCT 2 | 3.92 | 2.4 | 32.8 | 716.9 | 1.6 | 1.3 | 48.4 | 39.3 | 62.5 | 12.0 | 44.4 | |
Table 9: Rougher kinetic float test results - oxide mineralisation
The results show that reasonable metal recoveries were obtained to the copper rougher concentrate ranging from 48.4% to 65.8%, at concentrate grades ranging from 2.4% Cu to 8.0% Cu.
Open cycle cleaner tests
A follow-up series of OCC flotation tests were subsequently conducted based upon the optimum rougher flotation conditions. A summary of the optimum OCC test results is provided in Table 10 below.
Sample ID | OCC test ID | Product ID | Mass pull (%) | Grade | Recovery (%) | ||||||||
Cu (%) | Au (g/t) | Ag (g/t) | Zn (%) | STOT (%) | Cu | Au | Ag | Zn | STOT | ||||
AM-MET05 | FCT 3 | Cl 2 Conc | 0.99 | 17.6 | 159 | 3,647 | 15.7 | 2.0 | 37.8 | 29.5 | 37.7 | 3.9 | 20.3 |
AM-MET06 | FCT 4 | Cl1+Sc Conc | 2.69 | 24.4 | 23.2 | 534.6 | 1.4 | 0.9 | 62.6 | 31.5 | 44.3 | 8.6 | 17.9 |
AM-MET07 | FCT 4 | Cl 2 Conc | 0.78 | 22.8 | 139 | 1,868 | 5.6 | 1.9 | 35.7 | 35.5 | 35.3 | 2.5 | 14.7 |
AM-MET08 | FCT 2 | Cl 3 Conc | 0.43 | 13.9 | 101 | 3,410 | 3.4 | 7.6 | 30.9 | 13.1 | 32.3 | 2.8 | 27.8 |
Table 10: Open cycle cleaner test results - oxide mineralisation
Results show that reasonable copper recoveries were obtained to the cleaner concentrate ranging from 30.9% to 62.6%, at cleaner concentrate grades ranging from 13.9% Cu to 24.4% Cu. The target was to achieve a saleable concentrate grade of 18-22% Cu, which was obtained for the Fin Vein and CVZ oxide mineralisation (samples AM-MET05 to AM-MET07), but not for the JVZ oxide mineralisation (sample AM-MET08). Even with 3-stage cleaning a cleaner concentrate grade of only 13.9% Cu was achieved for the JVZ oxide sample, AM-MET08.
The gold and silver metal grades reporting to the saleable copper concentrate are also reasonable and will result in significant precious metal credits.
The zinc grade in the Fin Vein oxide composite sample (AM-MET05) at 15.7% Zn is higher than the maximum acceptable zinc grade for a saleable copper concentrate and thus will attract smelter penalties. Net Smelter Return ("NSR") will be calculated for different concentrate options in order to determine which will have the highest economic return.
Flotation testwork programme - transitional mineralisation
Rougher kinetic tests
Rougher kinetic flotation tests were conducted on the CVZ and Fin Vein transitional mineralisation types (samples AM-MET03 and AM-MET04, respectively).
Sequential float tests failed to produce separate copper and zinc rougher concentrates. The zinc grades in the combined rougher concentrate were too high to take forward to the cleaning stage.
The AM-MET03 and AM-MET04 samples are interpreted as being representative of the transitional mineralisation zone. Detailed geological examination and logging of drill core from the transitional zone shows that there are visible copper oxide coatings on the zinc carbonate and oxide minerals. The presence of copper oxide mineral coatings results in self-activation of the zinc carbonate and oxide minerals in the copper rougher flotation stage.
Open cycle cleaner tests
Open cycle cleaner tests were conducted on the CVZ and Fin Vein transitional mineralisation types. Results of the optimal OCC tests are summarised in Table 11 below.
Sample ID | OCC test ID | Product ID | Mass pull (%) | Grade | Recovery (%) | ||||||||
Cu (%) | Au (g/t) | Ag (g/t) | Zn (%) | STOT (%) | Cu | Au | Ag | Zn | STOT | ||||
AM-MET03 | FCT2 | Cl2 Conc | 1.4 | 9.9 | 28.6 | 799.6 | 44.6 | 33.3 | 38.8 | 23.2 | 25.1 | 38.4 | 18.0 |
AM-MET04 | FCT2 | Cl2 Conc | 3.4 | 7.5 | 65.5 | 2,393 | 38.8 | 34.2 | 77.2 | 54.0 | 54.2 | 35.1 | 38.8 |
Table 11: Open cycle cleaner test results - transitional mineralisation
Results of the OCC tests show that it was not possible to produce a saleable copper concentrate. Levels of zinc in the cleaner 2 concentrate are too high even with a fine regrind stage (P80 of 15µm) on the bulk rougher concentrate.
Nevertheless, the cleaner 2 concentrates contain high gold and silver metal values and could be marketed as a precious metals concentrate, or as a zinc concentrate with metal credits.
Flotation testwork programme - sulphide mineralisation
Rougher kinetic tests
Rougher kinetic flotation tests were conducted on the CVZ sulphide ore type (AM-MET09) adopting the optimal flotation parameters from rougher tests carried out on the CVZ transitional ores. Results of the rougher tests from the optimal OOC tests are summarised in Table 12 below.
Test ID | OCC test ID | Mass pull (%) | Grade | Recovery (%) | ||||||||||
Cu (%) | Au (g/t) | Ag (g/t) | Zn (%) | Pb (%) | STOT (%) | Cu | Au | Ag | Zn | Pb | STOT | |||
FT1 | Cu Ro Conc | 19.5 | 2.01 | 16.0 | 386.4 | 7.6 | 0.69 | 11.7 | 91.9 | 70.0 | 72.0 | 32.9 | 84.7 | 52.7 |
Zn Ro Conc | 6.2 | 0.16 | 8.5 | 194.7 | 45.5 | 0.06 | 25.6 | 2.4 | 11.8 | 11.6 | 62.7 | 2.5 | 36.8 | |
FT2 | Cu Ro Conc | 11.1 | 3.44 | 26.3 | 613.2 | 12.0 | 1.10 | 18.5 | 89.7 | 65.4 | 67.5 | 29.0 | 76.5 | 49.2 |
Zn Ro Conc | 8.3 | 0.21 | 8.9 | 192.6 | 36.7 | 0.12 | 22.6 | 4.1 | 16.4 | 15.8 | 66.2 | 6.0 | 44.6 | |
FT3 | Cu Ro Conc | 9.6 | 4.27 | 29.2 | 665.8 | 11.6 | 1.23 | 17.2 | 89.2 | 62.4 | 66.0 | 23.5 | 75.5 | 39.8 |
Zn Ro Conc | 8.3 | 0.20 | 8.7 | 188.1 | 40.5 | 0.10 | 22.0 | 3.6 | 15.9 | 15.9 | 70.3 | 5.5 | 43.5 | |
Table 12: Rougher kinetic test results - CVZ sulphide mineralisation
Results in Table 12 show that the optimal rougher performance was achieved in FT3. The test conditions for FT3 were subsequently used in the OCC tests.
Open cycle cleaner tests
Follow-up open cycle cleaner tests were conducted on the CVZ sulphide mineralisation adopting the optimal flotation parameters from the transitional ore OCC tests. Optimal results were achieved in FCT3. Results of the optimal OCC tests are summarised in Table 13 below.
Optimal results were achieved with the test parameters adopted in FCT3:
CuCl1+Sc: copper recovery of 65.2% at a concentrate grade of 14.6% Cu
ZnCl1+Sc: zinc recovery of 72.3% at a concentrate grade of 60.4% Zn.
Product | Weight (%) | Grade | Distribution (%) | ||||||||||
Cu (%) | Au (g/t) | Ag (g/t) | Zn (%) | STOT (%) | Pb (%) | Cu | Au | Ag | Zn | STOT | Pb | ||
CuCl2 Conc | 0.8 | 23.6 | 67.0 | 1,663 | 5.05 | 30.2 | 5.34 | 48.3 | 12.8 | 14.3 | 0.9 | 6.3 | 30.7 |
CuCl1 Conc + Scav Conc | 1.8 | 14.6 | 55.8 | 1,338 | 8.38 | 23.1 | 3.35 | 65.2 | 23.3 | 25.3 | 3.3 | 10.5 | 42.2 |
Cu Ro Conc | 2.2 | 12.0 | 49.6 | 1,182 | 9.00 | 20.9 | 2.83 | 66.7 | 25.9 | 27.8 | 4.4 | 11.9 | 44.4 |
ZnCl1 Conc | 4.7 | 0.36 | 13.2 | 326.6 | 62.3 | 30.9 | 0.20 | 4.3 | 14.6 | 16.3 | 64.2 | 37.2 | 6.6 |
ZnCl1 Combined | 5.5 | 0.44 | 13.8 | 343.2 | 60.4 | 30.2 | 0.49 | 6.1 | 17.7 | 19.9 | 72.3 | 42.3 | 9.2 |
Zn Ro Conc | 9.0 | 0.70 | 14.8 | 351.3 | 42.4 | 22.7 | 0.33 | 15.7 | 31.2 | 33.5 | 83.5 | 52.2 | 20.7 |
Table 13: Open cycle cleaner test results - CVZ sulphide mineralisation
Flotation tails leach testwork - oxide mineralisation
Flotation leach tests
The combined rougher and cleaner scavenger tails streams from the copper pre-float tests carried out on the oxide composite samples, were leached to determine metal recoveries from the flotation tails. Results of the cyanidation leach tests carried out on the combined float tails are summarised in Table 14 below.
Sample ID | Mineralisation type | Test ID | Extraction (%) | Reagent consumption (kg/t) | ||||
Au | Ag | Cu | Zn | NaCN | Lime | |||
AM-MET05 | Fin Vein oxide | FCT final tails | 76.5 | 36.8 | 20.6 | 3.3 | 3.6 | 1.5 |
AM-MET06 | CVZ oxide | FCT final tails | 59.5 | 43.9 | 20.2 | 8.0 | 4.0 | 1.3 |
AM-MET07 | CVZ oxide | FCT final tails | 77.0 | 48.6 | 16.9 | 5.0 | 3.2 | 1.1 |
AM-MET08 | JVZ oxide | FCT final tails | 86.6 | 64.0 | 64.0 | 16.1 | 3.2 | 0.8 |
Table 14: Float tail cyanidation leach test results
The results indicate that:
Gold extractions were moderate to high ranging from 59.5% to 86.6%;
Silver extractions were moderate ranging from 36.8% to 64.0%;
Copper dissolutions ranged from 16.9% to 64.0%;
Reagent consumptions ranged from 3.2 kg/t to 4.0 kg/t for sodium cyanide, and from for 0.8 kg/t to 1.5 kg/t lime.
Gold extractions in the float tails leach tests were generally lower than those of the whole ore cyanidation leach tests. This is interpreted as being mainly attributable to a significant amount of the gold having been previously recovered to the pre-float copper concentrate product, and secondly, due to cyanide starvation.
SART testwork - oxide mineralisation
Sighter flotation test
To generate sufficient pregnant leach solution ("PLS") for the SART tests a bulk float was carried out on a blend of the main copper oxide composite samples, AM-MET-05 (25%, Fin Vein oxide), AM-MET-06 (37.25%, CVZ oxide), and AM-MET-07 (37.5%, also CVZ oxide).
A sighter flotation test was first carried out on the copper oxide mineralisation blend to determine the optimum test conditions for the bulk float. Results of the sighter flotation test are shown in Table 15 below.
Product | Mass pull (%) | Grade | Distribution (%) | ||||||||
Cu (%) | Au (g/t) | Ag (g/t) | Zn (%) | STOT (%) | Cu | Au | Ag | Zn | STOT | ||
Cl2 Conc | 1.34 | 23.9 | 79.1 | 1,619 | 5.25 | 1.58 | 43.3 | 32.6 | 39.5 | 4.1 | 17.6 |
Cl1 Conc + Scav Conc | 3.39 | 13.3 | 47.5 | 926.7 | 5.15 | 1.05 | 61.0 | 49.5 | 57.2 | 10.3 | 29.6 |
Ro Conc | 9.13 | 5.5 | 20.7 | 388.8 | 3.97 | 0.54 | 67.5 | 58.1 | 64.7 | 21.4 | 41.1 |
Table 15: Sighter flotation test results for SART testwork
The copper cleaner grade-recovery ("GR") curve for the oxide mineralisation blend lies between that of AM-MET06 and AM-MET05. Whereas the gold cleaner GR curve for the oxide blend lies below that for AM-MET05 and AM-MET07.
Bulk flotation test
The purpose of the bulk float was to generate sufficient float tails sample mass for the subsequent bulk leach stage. The bulk flotation test was carried out on the copper oxide blend using the test conditions derived from the sighter flotation test. Results of the bulk flotation test are summarised in Table 16 below.
Results for the bulk float were very similar to the results achieved for the sighter test shown in Table 15. The rougher concentrate cleaned up quite well, with 60.1% copper recovered to the 1st cleaner plus scavenger concentrate at a grade of 15.0% Cu.
Product | Mass pull (%) | Grade | Distribution (%) | ||||||||||
Cu (%) | Au (g/t) | Ag (g/t) | Zn (%) | STOT (%) | Pb (%) | Cu | Au | Ag | Zn | STOT | Pb | ||
Cl2 Conc | 1.3 | 27.5 | 91.3 | 1,709 | 4.9 | 1.4 | 1.2 | 51.0 | 35.5 | 43.6 | 3.8 | 15.6 | 27.2 |
Cl1 Conc + Scav Conc | 2.8 | 15.0 | 55.5 | 984.8 | 4.6 | 1.0 | 0.5 | 60.1 | 46.6 | 54.3 | 7.7 | 23.6 | 39.3 |
Ro Conc | 9.8 | 4.9 | 19.9 | 338.2 | 3.2 | 0.5 | 0.3 | 68.9 | 58.1 | 64.9 | 18.6 | 38.8 | 54.1 |
Table 16: Bulk flotation test results for SART testwork
Bulk leach test
A bulk cyanidation leach test was carried out on the float tails from the bulk float test to generate the PLS stock for the subsequent SART tests. Results of the bulk leach are shown in Table 17 below.
Composite ID | Sample ID | Process option | Recovery | Concentrate grade | Tails grade | |||||||||
Cu (%) | Au (%) | Ag (%) | Zn (%) | Cu (%) | Au (g/t) | Ag (g/t) | Zn (%) | Cu (ppm) | Au (g/t) | Ag (g/t) | Zn (ppm) | |||
MET-AM ST | AM-ST Comp | Flotation | 51.0 | 35.5 | 43.6 | 3.8 | 27.4 | 91.3 | 1,709 | 4.93 | - | - | - | - |
AM-ST final tails | Leach | 20.1 | 76.4 | 58.8 | 11.3 | - | - | - | - | 396.2 | 0.9 | 8.1 | 1,233 | |
Combined | Float - Leach | 59.0 | 76.2 | 70.5 | 14.2 | - | - | - | - | - | - | - | - | |
Table 17: Bulk leach test results
The overall combined copper, gold and silver recoveries for the float-leach option were 59.0%, 76.2%, and 70.5% respectively. Overall metal recoveries for the float-leach option were higher than those achieved for the standalone leach option. This was mainly attributable to an increase in the free cyanide concentration for the leach test carried out on the AM-ST flotation tails.
SART test
The SART processing circuit consists of 2 stages:
Metal sulphide precipitation
Neutralisation and formation of gypsum
During stage 1 sulphuric acid is added to the PLS to decrease the pH down to 3-4. Limited testwork was undertaken to simulate stage 1 of a SART process. At this stage sodium hydrosulphide ("NaSH") is then added to the solution to precipitate metal sulphides complexed with cyanide. Table 18 shows the PLS assays with time as the NaSH is added.
Time (mins) | PLS concentration | |||||
Au (ppm) | Cu (ppm) | Ag (ppm) | Zn (ppm) | Pb (ppm) | Fe (ppm) | |
0 | 0.85 | 363.7 | 7.42 | 754.3 | 0.67 | 0.23 |
15 | 0.33 | 7.62 | 0.15 | 22.50 | 0.59 | 0.14 |
30 | 0.32 | 0.69 | 0.01 | 11.82 | 0.59 | 0.11 |
Table 18: Pregnant leach solution assay results
The degree of metal sulphide precipitation was estimated by the difference between the PLS assays and the barren leach solution ("BLS") assays over time. Metal precipitations are shown in Table 19 below.
Time (mins) | Metal sulphide precipitation | |||||
Au (%) | Cu (%) | Ag (%) | Zn (%) | Pb (%) | Fe (%) | |
0 | 0.0 | 0.0 | 0.0 | 0.0 | 0.0 | 0.0 |
15 | 61.0 | 97.9 | 98.0 | 97.0 | 13.1 | 38.2 |
30 | 61.6 | 99.8 | 99.9 | 98.4 | 13.2 | 49.5 |
Table 19: Pregnant leach solution metal precipitation results
SART test filtrate assays indicate >97% precipitation of Ag, Cu and Zn within 15 minutes of NaSH addition. Further residence time had little effect on the degree of metal precipitation. Only Fe displayed a significant increase in precipitation, with a further 11.3% precipitated after 30 minutes.
Despite being a noble metal, Au precipitation was only 61.6%. This is likely due to NaSH reducing dicyanoaurate ([Au(CN)2]) ions to elemental gold, along with entrainment and/or co-precipitation.
No testwork was undertaken to simulate stage 2 of a SART processing circuit.
Discussion of results
Interpretation of the comminution test results indicates that the various Abu Marawat mineralisation types will be moderately hard to crush. Abu Marawat mineralisation is considered slightly to moderately abrasive, and would be considered hard from a milling perspective.
Whole ore cyanidation leach tests carried out on the composite samples indicate that moderate to high gold and silver leach extractions can be achieved. However, the trade-off will be high reagent consumptions, and thus high process opex costs when processing Abu Marawat mineralisation types by conventional CIL. Reagent consumptions are highly dependent on the degree of cyanide soluble copper in the mineralisation.
The optimum process route for processing the Abu Marawat oxide mineralisation types will be by adopting a copper pre-float stage followed by direct cyanidation leach and production of a pregnant leach solution. The PLS is then processed in a SART circuit to produce a saleable metal sulphide concentrate, and to recycle and regenerate the cyanide. The SART tails can then be processed through a Merrill-Crowe circuit to recover the remaining gold and silver in solution to produce doré.
It was not possible to produce separate saleable copper and zinc concentrates from the CVZ and Fin Vein transitional mineralisation types. The preferred process option for the transitional or types is material will be to produce and sell a zinc concentrate with copper, gold and silver credits, which could alternatively be sold as a precious metals concentrate.
The preferred process option for processing the Abu Marawat CVZ sulphide mineralisation is by sequential flotation to produce separate saleable copper and zinc concentrates with precious metal credits.
About Aton Resources Inc.
Aton Resources Inc. (AAN:TSX-V) is focused on its 100% owned Abu Marawat Concession ("Abu Marawat"), located in Egypt's Arabian-Nubian Shield, approximately 200 km north of Anglogold Ashanti's world-class Sukari gold mine. Aton has identified numerous gold and base metal exploration targets at Abu Marawat, including the Hamama deposit in the west, the Abu Marawat deposit in the northeast, and the Rodruin deposit in the south of the Concession. Two historic British gold mines are also located on the Concession at Semna and Sir Bakis. Aton has identified several distinct geological trends within Abu Marawat, which display potential for the development of a variety of styles of precious and base metal mineralisation. The Abu Marawat exploitation lease is 57.66 km2 in size, covering the Hamama West and Rodruin mineral deposits, and was established In January 2024 and is valid for an initial period of 20 years. The Concession also includes an additional 255.0 km2 of exploration areas at Abu Marawat, retained for a further period of 4 years from January 2024. Abu Marawat is located in an area of excellent infrastructure; a four-lane highway, a 220kV power line, and a water pipeline are in close proximity, as are the international airports at Hurghada and Luxor.
Qualified person
The technical information contained in this News Release was prepared by Gary Patrick BSc, MAusIMM, CP (Met), Principal Consultant of Metallurg Pty Ltd. Mr. Patrick is a qualified person (QP) under National Instrument 43-101 Standards of Disclosure for Mineral Projects.
For further information regarding Aton Resources Inc., please visit us at www.atonresources.com or contact:
TONNO VAHK
Chief Executive Officer
Tel: +1 604 318 0390
Email: info@atonresources.com
Note Regarding Forward-Looking Statements
Some of the statements contained in this release are forward-looking statements. Since forward-looking statements address future events and conditions; by their very nature they involve inherent risks and uncertainties. Actual results in each case could differ materially from those currently anticipated in such statements.
Neither TSX Venture Exchange nor its Regulation Services Provider (as that term is defined in policies of the TSX Venture Exchange) accepts responsibility for the adequacy or accuracy of this release.
SOURCE: Aton Resources, Inc.
View the original press release on ACCESS Newswire:
https://www.accessnewswire.com/newsroom/en/metals-and-mining/aton-reports-new-results-from-metallurgical-testing-on-abu-marawat-oxide-transiti-1123636
