

VANCOUVER, BC / ACCESS Newswire / March 26, 2026 / Aton Resources Inc. (TSX-V:AAN) ("Aton" or the "Company") updates investors on the first results from its reverse circulation percussion ("RC") drilling programme at the Abu Marawat deposit ("Abu Marawat"), located within the retained exploration areas of the Company's Abu Marawat Concession (the "Concession") in the Eastern Desert of Egypt.
Highlights:
The results from the first 14 holes of the 2025 RC infill drilling programme at Abu Marawat, AMP-214 to AMP-227 are now available. Further significant high grade polymetallic mineralised intersections were returned from the Fin Vein, including the following:
21.85 g/t Au, 178 g/t Ag, 23.83 g/t AuEq, 0.55% Cu and 5.21% Zn over a 20m interval from 31m downhole depth (hole AMP-225), estimated 5.5m true width;
17.13 g/t Au, 307 g/t Ag, 20.54 g/t AuEq, 0.82% Cu and 5.50% Zn over a 9m interval from 77m downhole depth (hole AMP-218), estimated 6.5m true width;
5.48 g/t Au, 60.5 g/t Ag, 6.15 g/t AuEq, 0.36% Cu and 2.07% Zn over a 14m interval from 54m downhole depth (hole AMP-216), estimated 10m true width;
7.74 g/t Au, 109 g/t Ag, 8.96 g/t AuEq, 0.40% Cu and 4.07% Zn over an 8m interval from 48m downhole depth (hole AMP-223), estimated 3m true width; and
7.01 g/t Au, 63.7 g/t Ag, 7.72 g/t AuEq, 0.68% Cu and 3.31% Zn over a 6m interval from 14m downhole depth (hole AMP-224), estimated 4.5m true width.
"We are pleased to release another set of very strong drill results from the Abu Marawat deposit, and are particularly pleased with the high grade polymetallic vein mineralisation we continue to intersect there. The previously reported metallurgical testwork programme has indicated that we will be able to successfully recover gold, silver, copper and zinc from the Abu Marawat mineralisation through a combination of conventional CIL, flotation and SART processing, so the continued delineation of near surface high grade polymetallic mineralisation is highly encouraging" said Tonno Vahk, Chief Executive Officer. "On other fronts we continue to push ahead with the development of the Hamama gold mine, with a new programme of metallurgical testwork currently ongoing in the UK, and we are also looking to appoint heap leach design and FEED contractors in the coming weeks, for the design and development of the Hamama West starter heap leach project. Our long-term consultants SLR Consulting and Cube Consulting are also making good progress on the updated mineral resources and mine design at Hamama, and will soon be switching their focus to updated and maiden MRE's at Abu Marawat and Semna as the final drill data becomes available, and we look forward to restating the mineral resources over the whole of the Abu Marawat Concession later this year, as we push on towards the development of Egypt's next gold mine."
Abu Marawat gold-silver-copper-zinc deposit
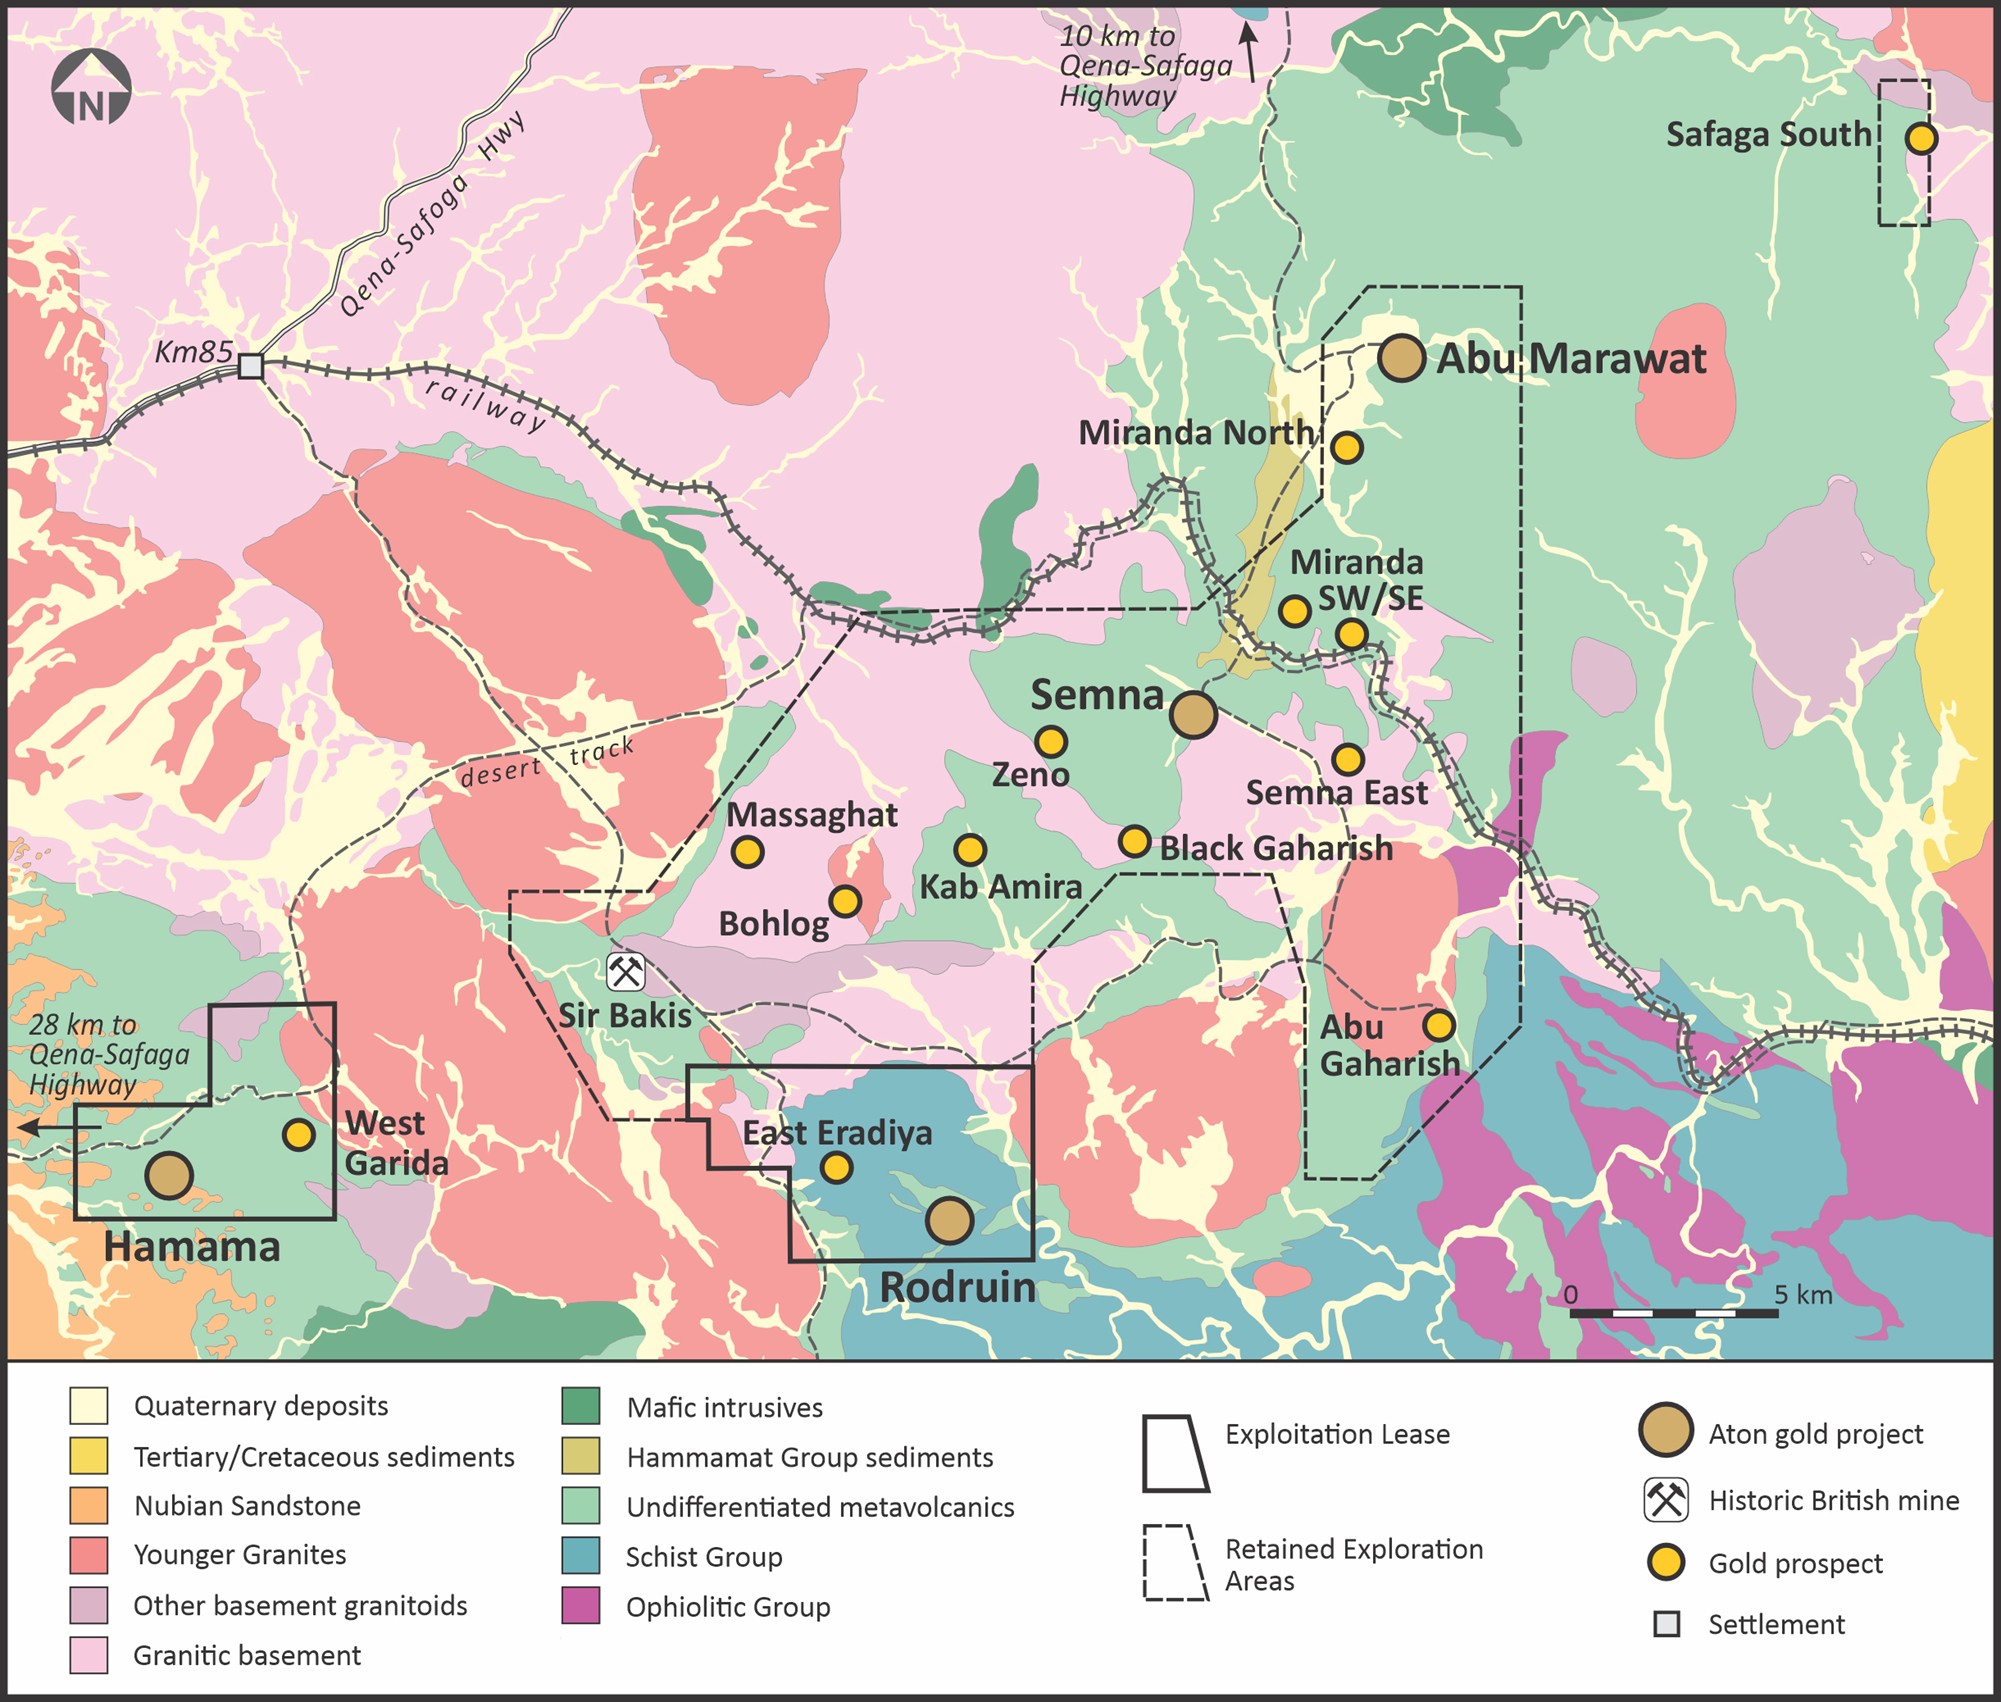
The Abu Marawat gold-silver-copper-zinc deposit is located approximately 35km northeast of the Hamama West deposit and 10km north-northeast of the Semna gold mine project, and is accessed via a well maintained desert track from the Qena-Safaga highway, approximately 25km to the north (Figure 1). On March 1, 2012 Aton Resources, when formerly named Alexander Nubia International Inc, announced a maiden Inferred Mineral Resource at Abu Marawat, prepared by Roscoe Postle Associates Inc., in compliance with the requirements set out in Canada's National Instrument 43-101. The resource was subsequently restated in an updated Technical Report without amendment (see news release dated January 24, 2017), and which is available online at Aton's website at https://atonresources.com/investors/reports-and-presentations. This Inferred Mineral Resource was based on 98 diamond drill holes totalling 19,573 metres. 19 of these holes were drilled by a former property owner, Minex Minerals Egypt, a wholly owned subsidiary of Greenwich Resources Plc during the late 1980's, and the remainder were drilled by Aton in 2011. The Inferred Mineral Resource comprises 2.9 million tonnes at an average grade of 1.75 g/t Au, 29.3 g/t Ag, 0.77% Cu and 1.15% Zn, containing 162 thousand ounces of gold, 2.7 million ounces of silver, 49 million lbs of copper, and 73 million lbs of zinc, and was based on net smelter return ("NSR") cut-off grades.
The polymetallic mineralisation at Abu Marawat is interpreted as being mesothermal in origin, and occurs in a series of discrete and roughly parallel N-S to NNW-SSE trending veins and structures, of which the Fin Vein and the CVZ are the most significant, hosted within a sequence of intensely hydrothermally altered, felsic metavolcanic rocks (Figure 2). The Fin Vein and the CVZ are about 50-100m apart and have been traced for at least 800m in surface outcrop and drill holes. Aton's previous drilling has demonstrated that these structures extend to at least 200m in depth. The bulk of the Inferred Mineral Resource at the Abu Marawat deposit encompasses parts of the CVZ and the Fin Vein, but there are also other subparallel mineralised veins to the east and to the west of these structures, such as the J Vein, the JVZ structure, and the Valley Vein zone (Figure 2).
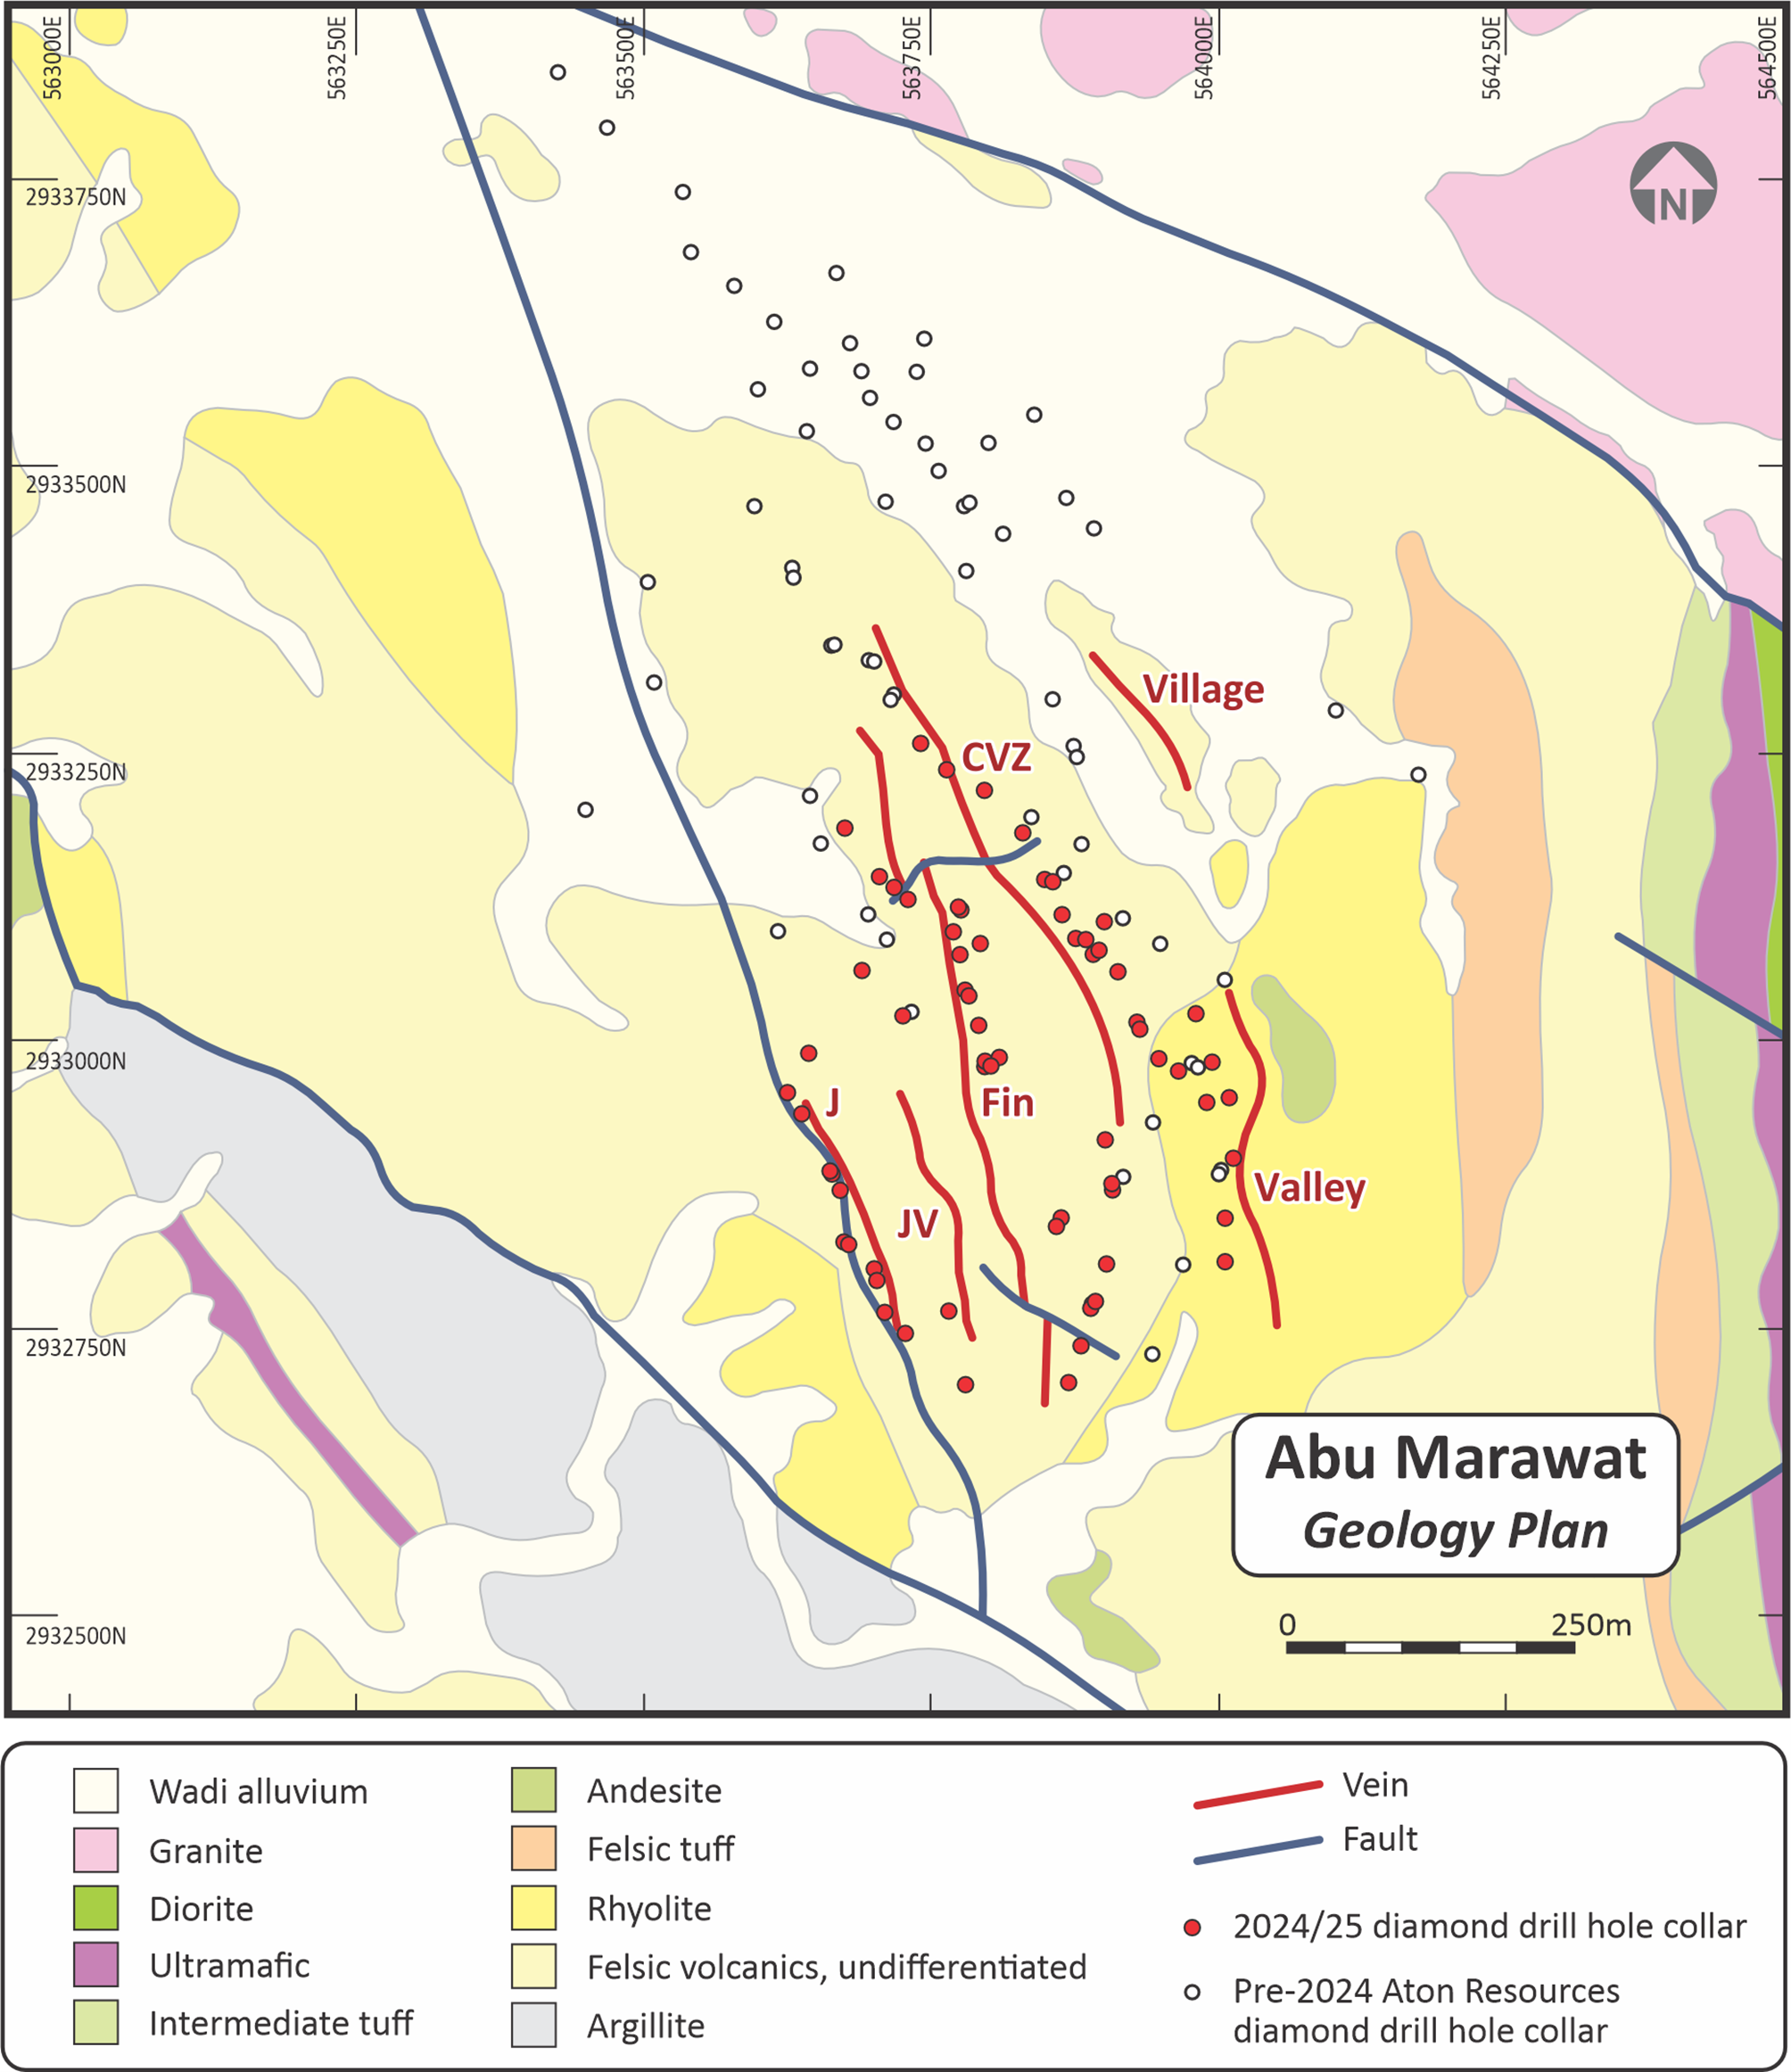
The mineralisation at Abu Marawat comprises a series of steep to near vertical finely brecciated quartz-carbonate-sulphide "veins". At surface the Fin Vein and the CVZ are expressed by quartz-rich gossans, and all the larger structures display development of intense wallrock alteration in outcrop. Several of the veins, notably the CVZ, were mined at surface in ancient times, apparently primarily for copper. The mineralised system at Abu Marawat currently remains open both laterally and at depth.
Further to the north, the Abu Marawat deposit appears to be truncated by a large WNW-ESE trending fault postulated to run beneath wadi sediments. To the east a prominent ridge composed of altered ultramafic rocks is thought to represent a significant geological terrane boundary (Figure 2).
Abu Marawat diamond drilling programme
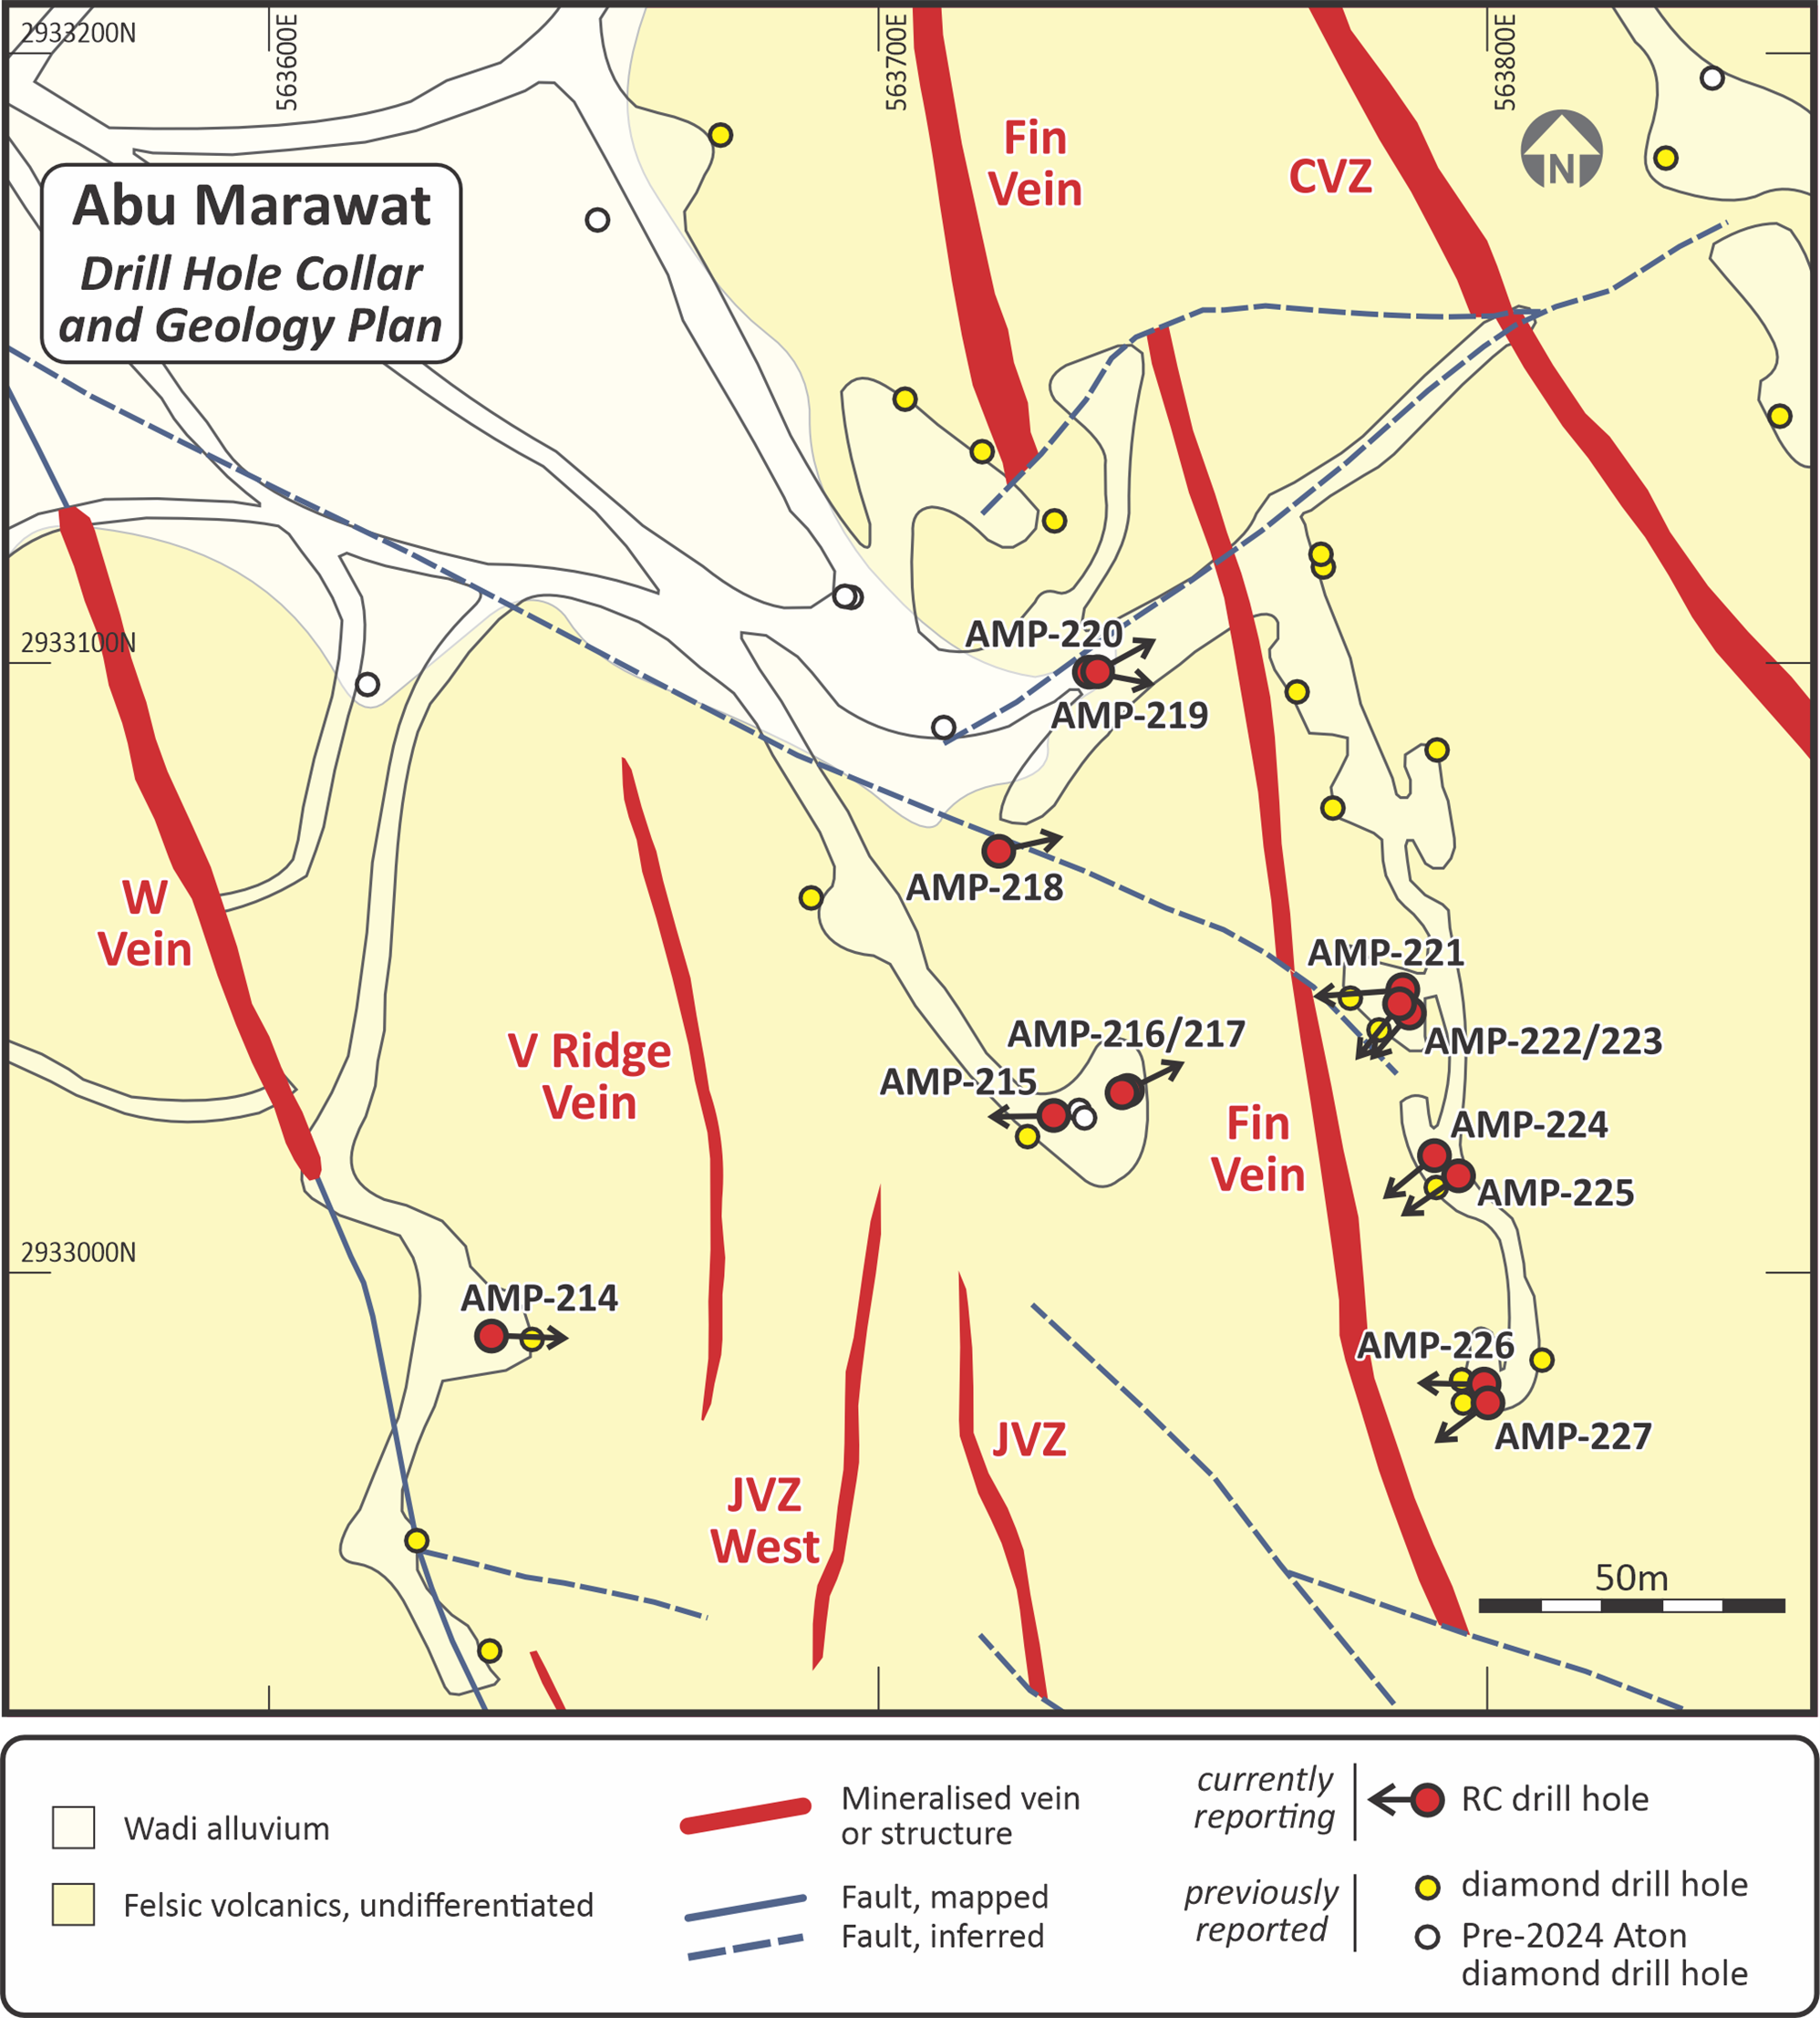
An infill RC drilling programme was completed at Abu Marawat in November 2025, with 71 holes (holes AMP-214 to AMD-284) drilled for a total of 6,647 metres. The programme was designed to infill previous diamond drilling, and to provide a sufficient drill density to allow for the estimation of an indicated resource at the Abu Marawat deposit. Assay results are now available for the first 14 holes, AMP-214 to AMP-227, which were mainly designed to test the northern part of the Fin Vein (Figure 3). The collar details of these holes are provided in Table 1 below.
Hole ID | Collar co-ordinates 1,2 | EOH depth (m) | Dip | Grid azimuth | Target | ||
X | Y | Z | |||||
AMP-214 | 563636.1 | 2932989.6 | 656.6 | 85 | -44.3 | 93.3 | V Ridge Vein |
AMP-215 | 563728.3 | 2933025.6 | 648.8 | 110 | -43.5 | 272.7 | V Ridge Vein |
AMP-216 | 563740.6 | 2933029.8 | 649.0 | 80 | -45.7 | 63.8 | Fin Vein |
AMP-217 | 563739.7 | 2933029.4 | 649.0 | 110 | -61.4 | 60.8 | Fin Vein |
AMP-218 | 563719.4 | 2933068.9 | 640.8 | 110 | -46.2 | 79.7 | Fin Vein |
AMP-219 | 563734.5 | 2933098.6 | 639.0 | 70 | -45.5 | 99.3 | Fin Vein |
AMP-220 | 563735.5 | 2933098.4 | 639.1 | 70 | -46.3 | 58.1 | Fin Vein |
AMP-221 | 563785.7 | 2933046.5 | 660.1 | 50 | -60.1 | 260.1 | Fin Vein |
AMP-222 | 563786.9 | 2933042.6 | 660.3 | 40 | -47.0 | 222.1 | Fin Vein |
AMP-223 | 563785.9 | 2933043.8 | 660.2 | 70 | -71.0 | 219.2 | Fin Vein |
AMP-224 | 563790.8 | 2933019.0 | 666.5 | 30 | -45.5 | 230.1 | Fin Vein |
AMP-225 | 563794.8 | 2933015.7 | 667.1 | 80 | -75.5 | 235.1 | Fin Vein |
AMP-226 | 563799.4 | 2932982.3 | 675.9 | 70 | -59.2 | 270.9 | Fin Vein |
AMP-227 | 563800.1 | 2932979.5 | 675.7 | 50 | -59.8 | 231.6 | Fin Vein |
Notes:
| |||||||
Table 1: Abu Marawat RC drill hole collar details, holes AMP-214 to AMP-227
Discussion of results
All intersection details from holes AMP-214 to AMD-227 are provided in Appendix A, with selected intersections shown below in Table 1.
Hole ID | Intersection (m) | Au (g/t) | Ag (g/t) | AuEq (g/t) 1 | Cu (%) | Pb (%) | Zn (%) | Comments | ||
From | To | Interval | ||||||||
AMP-216 | 54 | 68 | 14 | 5.48 | 60.5 | 6.15 | 0.36 | 0.04 | 2.07 | Fin Vein (estimated true width 10m) |
incl. | 57 | 67 | 10 | 7.55 | 74.6 | 8.37 | 0.49 | 0.06 | 2.69 | |
AMP-218 | 77 | 86 | 9 | 17.13 | 307 | 20.54 | 0.82 | 0.12 | 5.50 | Fin Vein (estimated true width 6.5m) |
AMP-223 | 48 | 56 | 8 | 7.74 | 109 | 8.96 | 0.40 | 0.06 | 4.07 | Fin Vein (estimated true width 3m) |
incl. | 48 | 53 | 5 | 12.14 | 154 | 13.85 | 0.60 | 0.08 | 5.76 | |
AMP-224 | 14 | 20 | 6 | 7.01 | 63.7 | 7.72 | 0.68 | 0.13 | 3.31 | Fin Vein |
AMP-225 | 31 | 51 | 20 | 21.85 | 178 | 23.83 | 0.55 | 0.18 | 5.21 | Fin Vein (estimated true width 5.5m) |
AMP-226 | 27 | 30 | 3 | 4.22 | 88.9 | 5.21 | 1.14 | 0.07 | 2.58 | Fin Vein |
AMP-227 | 31 | 33 | 2 | 8.13 | 190 | 10.24 | 0.74 | 0.27 | 6.10 | Fin Vein |
Notes:
| ||||||||||
Table 2: Selected intersections from the Abu Marawat diamond drilling programme, holes AMP-214 to AMP-227
The initial holes from the RC infill drill programme were designed to test the northern part of the Fin Vein, with the first 2 holes testing the apparently weakly mineralised V Ridge Vein and the JVZ structure (Figure 3). Only narrow, weak mineralisation was intersected in holes AMP-214 and AMP-215 targeting the V Ridge Vein, as expected.
The Fin Vein was intersected in all holes (AMP-216 to AMP-227) targeting it, at varying widths and grades see Appendix A). High grade intersections included 21.85 g/t Au, 178 g/t Ag, 23.83 g/t AuEq, 0.55% Cu and 5.21% Zn over a 20m interval (estimated true width of 5.5m) from 31m downhole depth (hole AMP-225), 7.13 g/t Au, 307 g/t Ag, 20.54 g/t AuEq, 0.82% Cu and 5.50% Zn over a 9m interval (estimated true width of 6.5m) from 77m downhole depth (hole AMP-218), and 5.48 g/t Au, 60.5 g/t Ag, 6.15 g/t AuEq, 0.36% Cu and 2.07% Zn over a 14m interval (estimated true width of 10m) from 54m downhole depth (hole AMP-216).
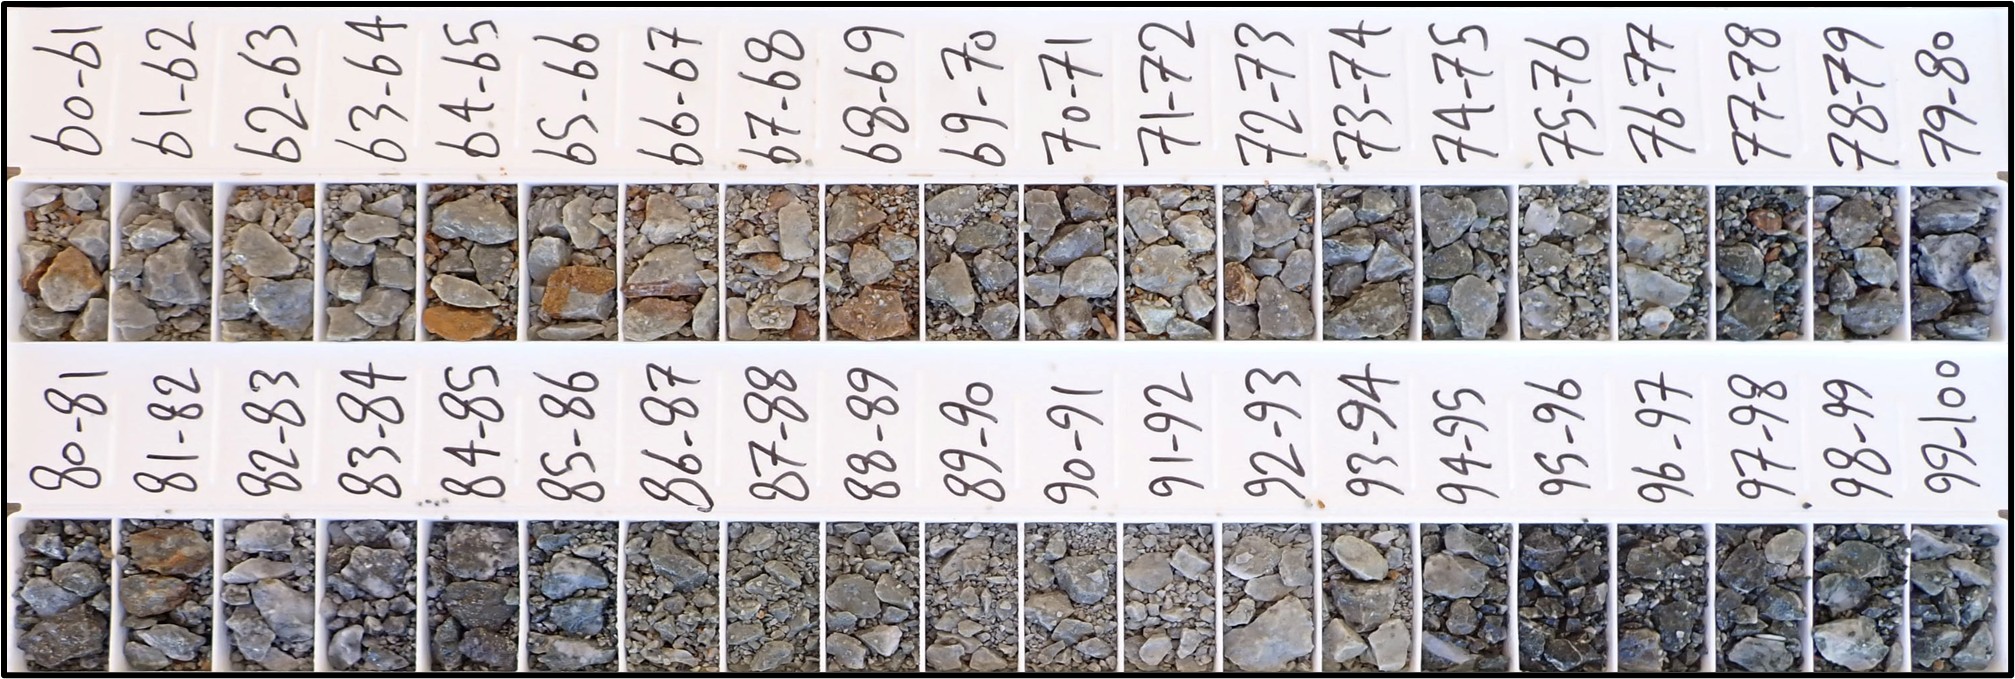
The Intersected mineralisation is typically quite cryptic from the Fin Vein, and is identifiable by the presence of generally minor but varying amounts of sugary vein quartz and typical green copper oxide mineral staining in the oxide zone, and an abundance of copper and zinc sulphide minerals (chalcopyrite and sphalerite), as well as minor galena in the fresh zone (see Figures 4 and 5).
Exploration Activity Update
Aton completed its Phase 3b RC drilling programme at Semna in February 2026, with the drill rig returning there after the completion of the Abu Marawat programme, with a further 42 holes drilled for a total 4,388 metres (holes SMP-093 to SMP-134). The Phase 3 programme was originally started in January 2025, with results having been previously reported for the first tranche of holes (Phase 3a, holes SMP-049 to SMP-092), see news releases dated July 2, 2025 and December 23, 2025. The first results from the Phase 3b programme will be reported in the coming weeks, when they are available.
Aton also completed a short Phase 4 diamond drilling programme at Semna in December 2025, consisting of 8 holes for a total of 406.8 metres drilled. This programme will be reported with the Phase 3b RC programme.
After a short pause in the drilling operations at the Concession to coincide with the month of Ramadan a Phase 5 RC diamond drill programme will commence at Semna in April 2026. An initial 4,000 metres has been planned.
A first-pass programme of RC drilling will also commence in April 2026 at the undrilled Bohlog prospect in the Company's retained exploration areas, with an initial 4,700 metres planned over a strike length of over a kilometre at Zones 1 and 2, see news release dated December 4, 2017. Surface trenching at Bohlog has returned mineralised intervals including 1.57 g/t Au over a 20 metre interval, and 1.65 g/t Au over a 9 metre interval, see news release dated February 28, 2018.
Cube Consulting and SLR Consulting are currently finalising mineral resource estimate updates at the Hamama and Rodruin deposits, ahead of the planned start of production at Hamama West in 2027. Cube and SLR will also start work on updating the Abu Marawat mineral resource as well as a maiden mineral resource estimate at Semna, once all the drilling data from programmes completed to date has been compiled, and geological interpretations of the two deposits have been completed. The Company looks forward to releasing a new mineral resource statement for the entire Abu Marawat Concession later this year.
Sampling and analytical procedures
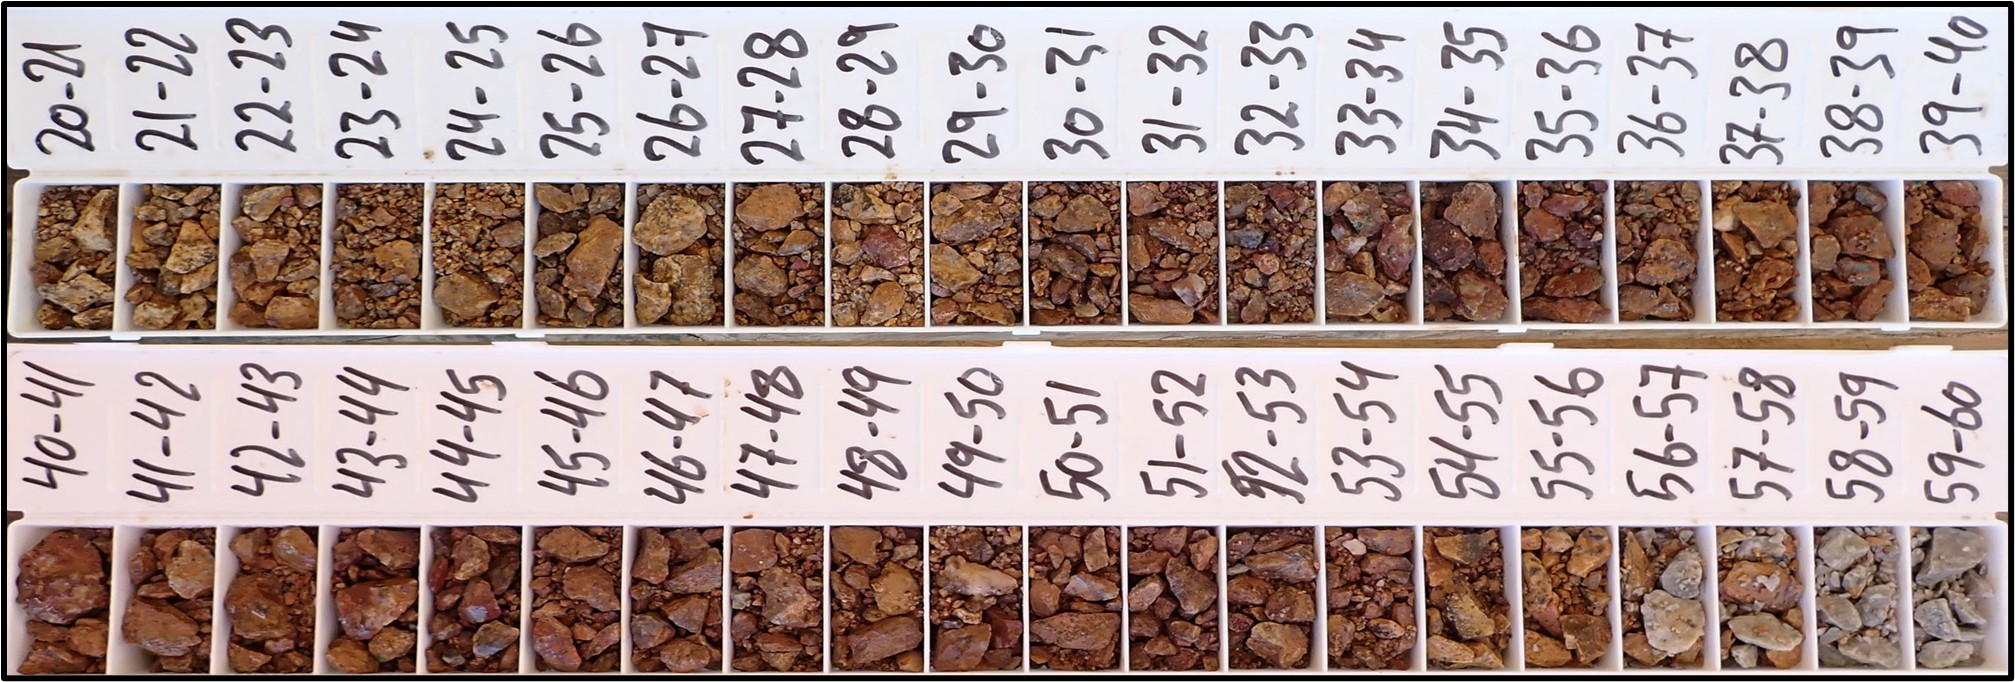
The RC drill holes were drilled at 5½" size (138-140mm diameter), using an Explorac 100 RC drilling rig, operated by Capital Limited. The rig was equipped with an onboard cone splitter which was set to produce 2 separate 1/8 split samples ("L" - laboratory and "R" - retain) which were collected into cloth bags directly from the splitter. The remaining c. 75% of the bulk percussion chip samples was collected directly from the cyclone into pre-written large plastic bags every metre, numbered with the hole number and hole depths. The bulk sample bags were laid out sequentially at the drill site. Between each metre of drilling the cyclone was cleaned out with compressed air, and the hole was blown clean to reduce the risk of downhole contamination. The chips were logged on the drill sites by Aton geologists. A representative sample of each metre was washed and stored in marked plastic chip trays, each containing 20m of samples, photographed, and retained onsite as a permanent record of the drill hole, with the bulk sample bags being retained at the drill sites.
Each drill hole was pre-allocated sampling intervals, with both 1m split samples over pre-determined target depths, and selected 4m composite samples being sent for analysis. The entirety of all the holes were sent for analysis, with 1m split samples sent for analysis from the pre-allocated target depths. 4m composites were sent for analysis from the non-target depths.
The 1m "L" split samples, weighing approximately 4-5kg each were transported to the Abu Marawat sample processing facility, where they were 1/2 riffle split into 2 separate sub-samples, weighing approximately 2-2.5kg. The splitter was cleaned with compressed air between each sample. One of these sub-samples was marked and labelled, and retained at Abu Marawat for storage. A further c. 500-1,000g sub-sample was split off from the pre-selected 1m target intervals from the "L" bags. QAQC samples were inserted into the 1m split sample stream at a rate of approximately 1 certified reference material (or "standard" sample) every 30 samples, 1 blank sample every 15 samples, and 1 field duplicate or replicate sample every 15 samples. The selected 1m split samples were sent to ALS Minerals for analysis.
The 1m sub-samples from the non-target intervals were also combined into 4m composite samples, weighing approximately 8-10kg. These were thoroughly mixed and homogenised and again riffle split to produce nominal c. 500-1,000g 4m composite samples at Abu Marawat, and were allocated new sample numbers. These 4m composite samples were also dispatched to ALS Minerals for analysis. The bulk reject material from the riffle split 4m composite samples was disposed of. QAQC samples were inserted into the 4m composite sample stream at a rate of approximately 1 certified reference material/standard every 60 samples, 1 blank sample every 30 samples, and 1 field duplicate split sample ("L" bag) or replicate sample (taken from the "R" bag) every 30 samples.
The "R" bags were retained separately onsite and stored at the Abu Marawat sample storage facility.
The selected 1m split and 4m composite samples were shipped to ALS Minerals sample preparation laboratory at Marsa Alam, Egypt, where they were pulverised to a size fraction of better than 85% passing 75 microns. From this pulverised material a further sub-sample was split off with a nominal c. 100g size, which was shipped on to ALS Minerals at Rosia Montana, Romania for analysis.
All samples were analysed for gold by fire assay (30g charge) with an atomic absorption spectroscopy ("AAS") finish (analytical code Au-AA23). Any high grade gold samples (>10 g/t Au) were re-analysed using analytical code Au-GRA22 (also fire assay, 50g charge, with a gravimetric finish).
Samples were also analysed for silver, copper, lead and zinc using an aqua regia digest followed by an AAS finish (analytical code AA45). Any high grade silver and base metal samples (Ag >100 g/t, and Cu, Pb or Zn >10,000ppm or >1%) were re-analysed using the ore grade technique AA46 (also an aqua regia digest followed by an AAS finish).
Following receipt of the 4m composite assay results, any mineralised intervals were re-submitted for additional analysis. Additional 1m samples were selected from the mineralised 4m intervals with a further c. 500-1,000g sub-sample being split off from the retained material from the "L" bags, and again allocated new sample numbers. QAQC samples were again inserted into this additional 1m split sample stream at a rate of approximately 1 certified reference material/standard sample every 30 samples, 1 blank sample every 15 samples, and 1 field duplicate or replicate sample every 15 samples. Any remaining material from the "L" bags was again retained onsite at Abu Marawat. These additional 1m split samples were again sent to ALS Minerals Egypt for sample preparation and on to ALS Romania for gold, silver and copper analysis. The Au-AA23 and Au-GRA22 methods were again used for gold, and the AA45 and AA46 methods for silver, copper, lead and zinc.
The reject pulp material from ALS Marsa Alam from all the samples was returned to the sample preparation facility at Rodruin, where it is also retained onsite.
About Aton Resources Inc.
Aton Resources Inc. (AAN: TSX-V) is focused on its 100% owned Abu Marawat Concession ("the Concession"), located in Egypt's Arabian-Nubian Shield, approximately 200 km north of AngloGold Ashanti's world-class Sukari gold mine. Aton has identified numerous gold and base metal exploration targets at the Concession, including the Hamama deposit in the west, the Abu Marawat deposit in the northeast, and the Rodruin deposit in the south of the Concession. Two historic British gold mines are also located on the Concession at Semna and Sir Bakis. Aton has identified several distinct geological trends within the Concession, which display potential for the development of a variety of styles of precious and base metal mineralisation. The Abu Marawat exploitation lease is 57.66 km2 in size, covering the Hamama West and Rodruin mineral deposits, and was established In January 2024 and is valid for an initial period of 20 years. The Concession also includes an additional 255.0 km2 of exploration areas, retained for a further period of 4 years from January 2024. The Concession is located in an area of excellent infrastructure; a four-lane highway, a 220kV power line, and a water pipeline are in close proximity, as are the international airports at Hurghada and Luxor.
Qualified person
The technical information contained in this News Release was prepared by Javier Orduña BSc (hons), MSc, MCSM, DIC, MAIG, SEG(M), Chief Geologist of Aton Resources Inc. Mr. Orduña is a qualified person (QP) under National Instrument 43-101 Standards of Disclosure for Mineral Projects.
For further information regarding Aton Resources Inc., please visit us at www.atonresources.com or contact:
TONNO VAHK
Chief Executive Officer
Tel: +1 604 318 0390
Email: info@atonresources.com
Note Regarding Forward-Looking Statements
Some of the statements contained in this release are forward-looking statements. Since forward-looking statements address future events and conditions; by their very nature they involve inherent risks and uncertainties. Actual results in each case could differ materially from those currently anticipated in such statements.
Neither TSX Venture Exchange nor its Regulation Services Provider (as that term is defined in policies of the TSX Venture Exchange) accepts responsibility for the adequacy or accuracy of this release.
Appendix A - Abu Marawat significant intersections, holes AMP-214 to AMP-227
Hole ID | Intersection (m) | Au (g/t) | Ag (g/t) | AuEq (g/t) 2 | Cu (%) | Pb (%) | Zn (%) | Comments | ||
From | To | Interval | ||||||||
AMP-214 | 69 | 70 | 1 | 2.09 | 18.3 | 2.29 | 0.23 | 0.00 | 1.57 | Possible JVZ West zone? |
AMP-215 | 75 | 77 | 2 | 1.82 | 11.5 | 1.94 | 0.07 | 0.01 | 0.70 | V Ridge Vein? |
AMP-216 | 54 | 68 | 14 | 5.48 | 60.5 | 6.15 | 0.36 | 0.04 | 2.07 | Fin Vein |
incl. | 57 | 67 | 10 | 7.55 | 74.6 | 8.37 | 0.49 | 0.06 | 2.69 |
|
AMP-217 | 91 | 94 | 3 | 0.59 | 12.5 | 0.73 | 0.30 | 0.01 | 0.53 | Fin Vein? |
AMP-218 | 77 | 86 | 9 | 17.13 | 307 | 20.54 | 0.82 | 0.12 | 5.50 | Fin Vein |
AMP-219 | 50 | 53 | 3 | 1.03 | 27.5 | 1.34 | 0.07 | 0.02 | 0.31 | Possible fault offset of Fin Vein? |
and | 57 | 62 | 5 | 0.84 | 21.5 | 1.08 | 0.05 | 0.01 | 0.75 | Possible fault offset of Fin Vein? |
and | 68 | 69 | 1 | 1.14 | 19.3 | 1.35 | 0.03 | 0.00 | 0.27 | Possible fault offset of Fin Vein? |
AMP-220 | 28 | 30 | 2 | 0.55 | 18.1 | 0.75 | 0.10 | 0.01 | 1.35 | Fin Vein |
AMP-221 | 29 | 31 | 2 | 1.89 | 45.1 | 2.39 | 0.14 | 0.06 | 1.56 | Fin Vein |
AMP-222 | 17 | 23 | 6 | 0.37 | 60.3 | 1.04 | 0.05 | 0.05 | 0.44 | Fin Vein |
incl. | 18 | 20 | 2 | 1.02 | 62.8 | 1.71 | 0.12 | 0.12 | 0.85 |
|
AMP-223 | 48 | 56 | 8 | 7.74 | 109 | 8.96 | 0.40 | 0.06 | 4.07 | Fin Vein |
incl. | 48 | 53 | 5 | 12.14 | 154 | 13.85 | 0.60 | 0.08 | 5.76 |
|
AMP-224 | 14 | 20 | 6 | 7.01 | 63.7 | 7.72 | 0.68 | 0.13 | 3.31 | Fin Vein |
AMP-225 | 31 | 51 | 20 | 21.85 | 178 | 23.83 | 0.55 | 0.18 | 5.21 | Fin Vein (nb: not true width) |
AMP-226 | 27 | 30 | 3 | 4.22 | 88.9 | 5.21 | 1.14 | 0.07 | 2.58 | Fin Vein |
AMP-227 | 31 | 33 | 2 | 8.13 | 190 | 10.24 | 0.74 | 0.27 | 6.10 | Fin Vein |
Notes:
| ||||||||||
SOURCE: Aton Resources, Inc.
View the original press release on ACCESS Newswire:
https://www.accessnewswire.com/newsroom/en/metals-and-mining/aton-reports-the-first-results-from-its-abu-marawat-rc-infill-drill-programme-inc-1151602
